Node information
Test timing information
Up ramp statistics
Runtime session statistics
Down ramp statistics
Overall statistics
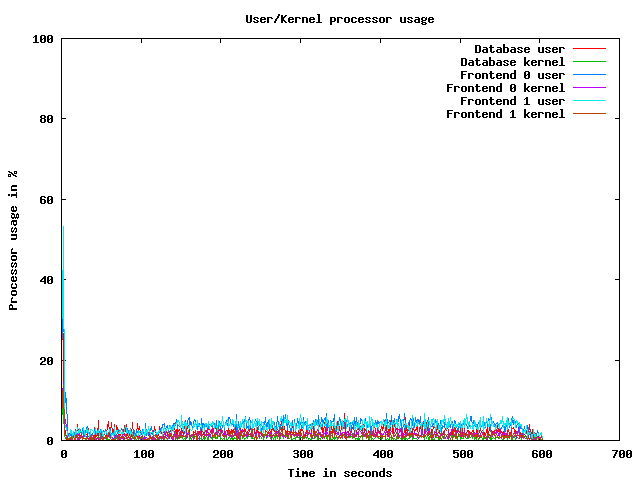
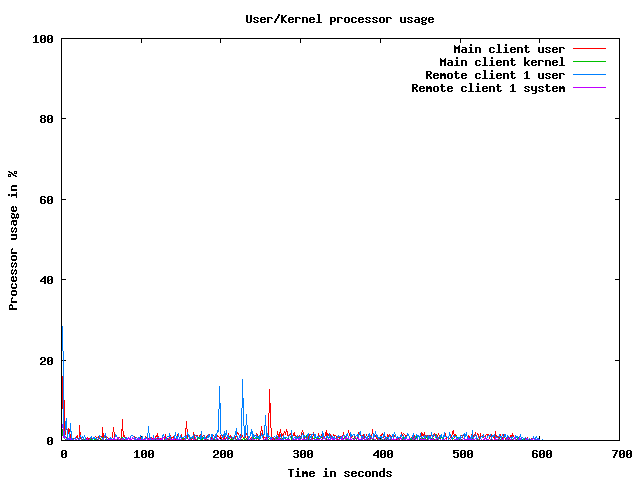
CPU usage graphs
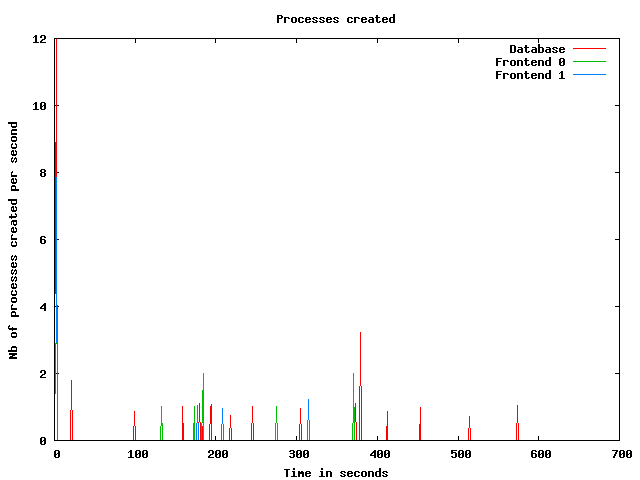
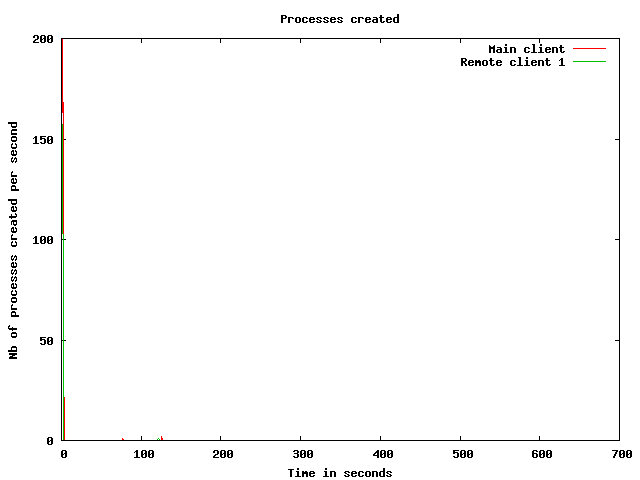
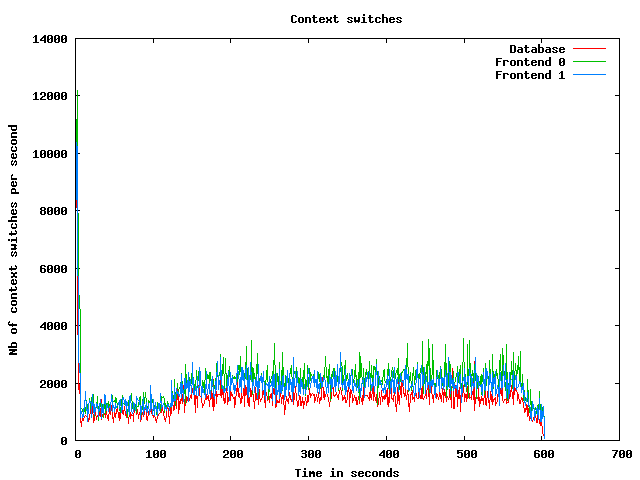
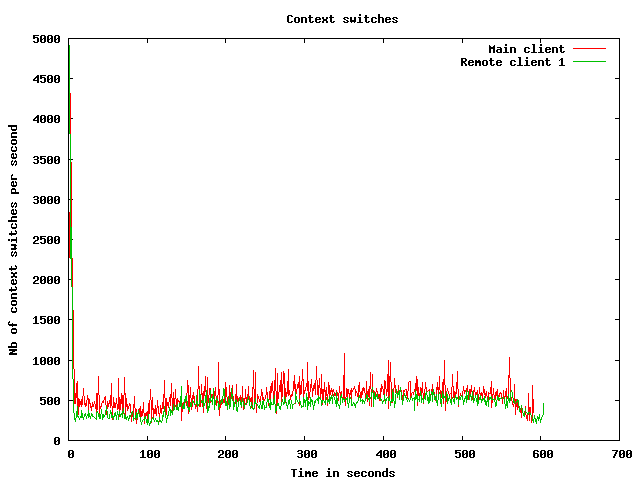
Processes usage graphs
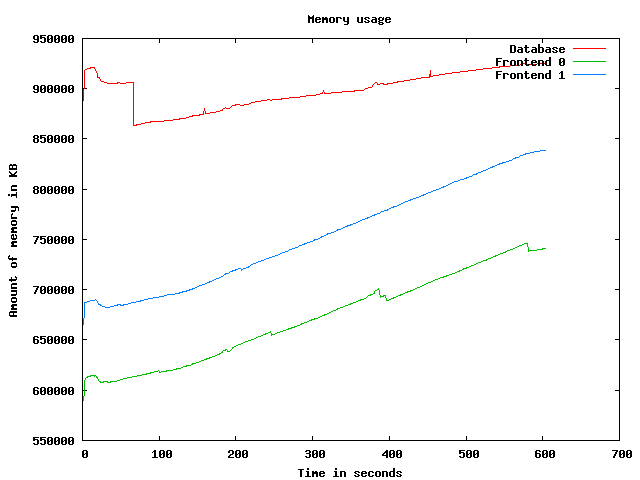
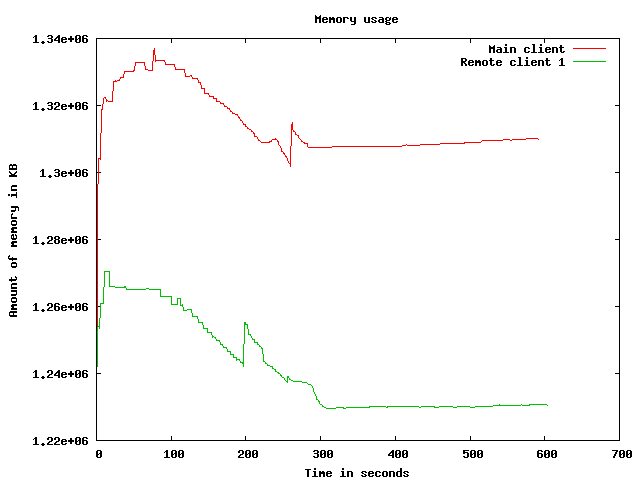
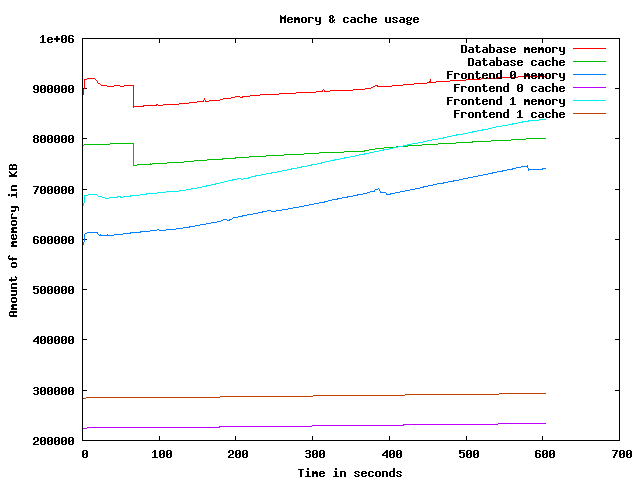
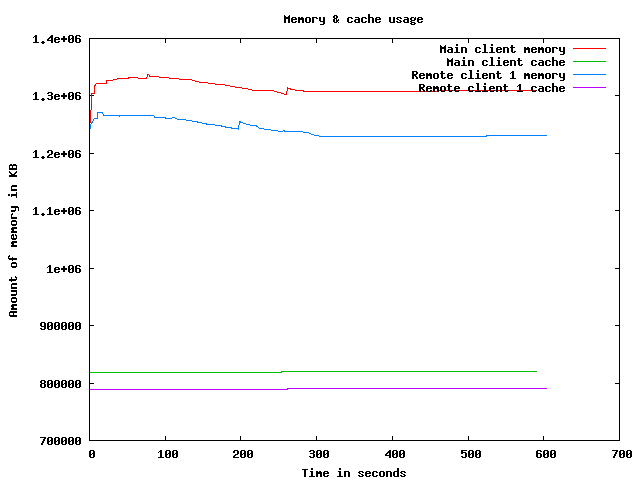
Memory usage graph
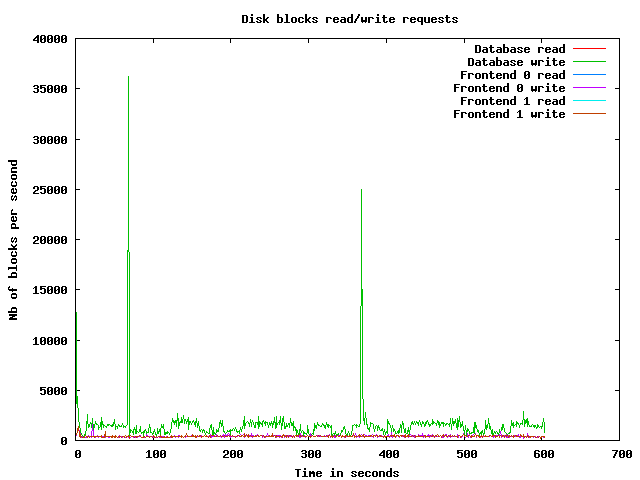
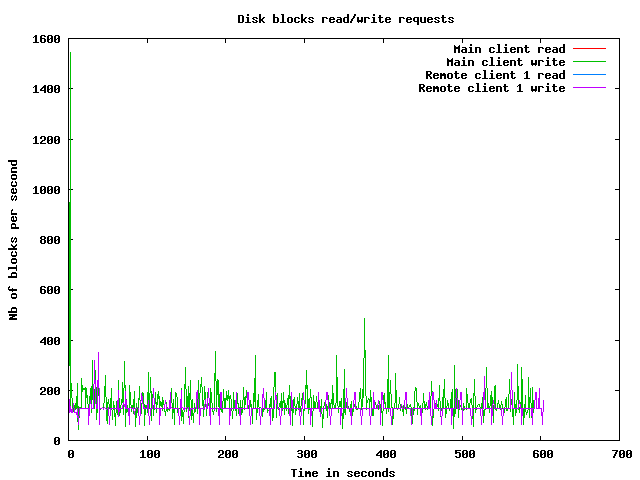
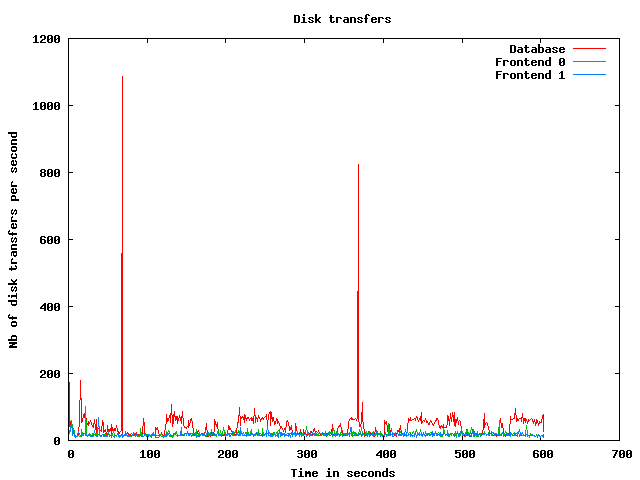
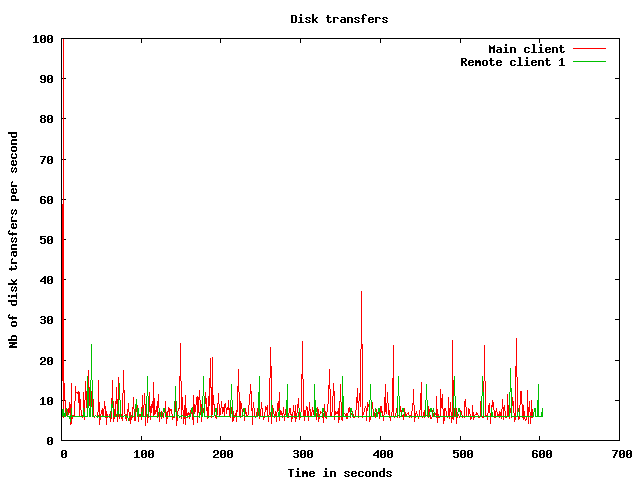
Disk usage graphs
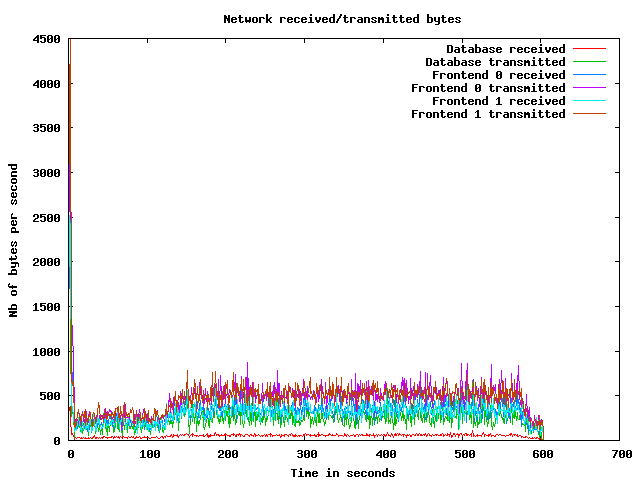
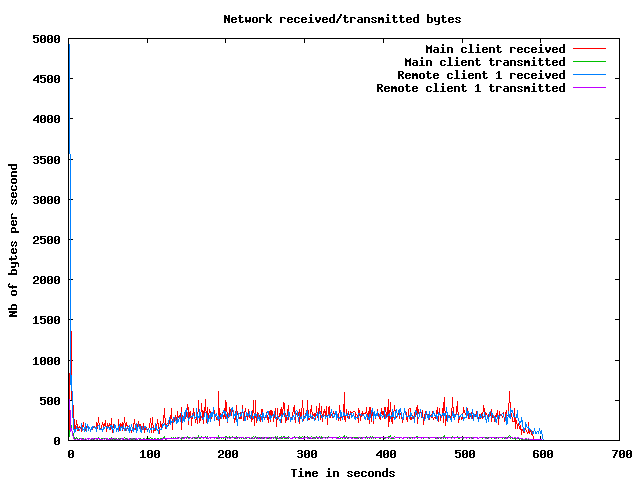
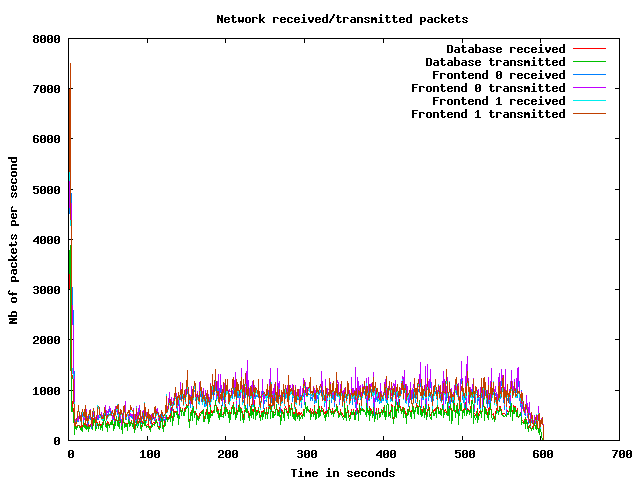
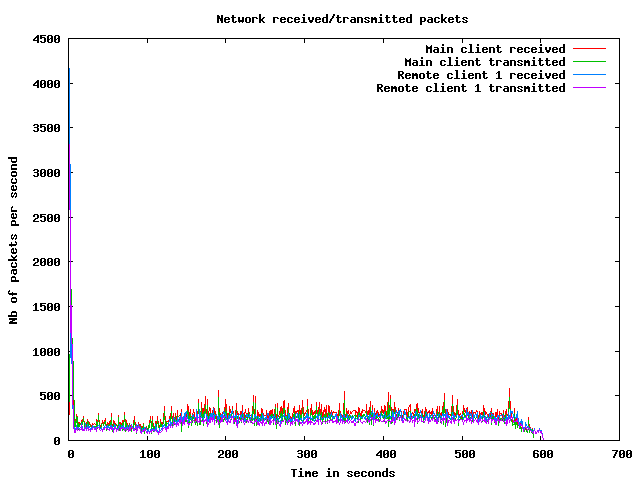
Network usage graphs
| Test start | 2009-3-19 5:52:51 |
| Up ramp start | 2009-3-19 5:52:56 |
| Runtime session start | 2009-3-19 5:54:56 |
| Down ramp start | 2009-3-19 6:2:26 |
| Test end | 2009-3-19 6:4:13 |
| Up ramp length | 2 minutes 0 millisecond (requested 120000 ms) |
| Runtime session length | 7 minutes 30 seconds 0 millisecond (requested 450000 ms) |
| Down ramp length | 30 seconds 1 millisecond (requested 30000 ms) |
| Total test length | 11 minutes 21 seconds 114 milliseconds |
| State name | % of total | Count | Errors | Minimum Time | Maximum Time | Average Time |
|---|---|---|---|---|---|---|
Home | 10 % | 742 | 0 | 0 ms | 3152 ms | 1282 ms
|
Register | 1 % | 104 | 0 | 0 ms | 3013 ms | 96 ms
|
RegisterUser | 1 % | 96 | 0 | 5 ms | 3016 ms | 153 ms
|
Browse | 9 % | 652 | 0 | 0 ms | 3009 ms | 205 ms
|
BrowseCategories | 6 % | 463 | 0 | 3 ms | 3020 ms | 136 ms
|
SearchItemsInCategory | 15 % | 1047 | 0 | 0 ms | 3023 ms | 69 ms
|
BrowseRegions | 2 % | 149 | 0 | 3 ms | 3006 ms | 120 ms
|
BrowseCategoriesInRegion | 2 % | 138 | 0 | 3 ms | 3009 ms | 54 ms
|
SearchItemsInRegion | 3 % | 262 | 0 | 0 ms | 3020 ms | 59 ms
|
ViewItem | 12 % | 866 | 0 | 3 ms | 3031 ms | 58 ms
|
ViewUserInfo | 2 % | 158 | 0 | 3 ms | 3002 ms | 25 ms
|
ViewBidHistory | 1 % | 81 | 0 | 3 ms | 3016 ms | 67 ms
|
BuyNowAuth | 0 % | 63 | 0 | 2 ms | 3006 ms | 51 ms
|
BuyNow | 0 % | 57 | 12 | 4 ms | 33 ms | 6 ms
|
StoreBuyBow | 0 % | 41 | 0 | 4 ms | 246 ms | 14 ms
|
PutBidAuth | 4 % | 293 | 0 | 0 ms | 3000 ms | 29 ms
|
PutBid | 3 % | 262 | 42 | 4 ms | 3014 ms | 65 ms
|
StoreBid | 1 % | 131 | 0 | 4 ms | 3019 ms | 97 ms
|
PutCommentAuth | 0 % | 0 | 0 | 0 ms | 0 ms | 0 ms
|
PutComment | 0 % | 23 | 3 | 3 ms | 37 ms | 6 ms
|
StoreComment | 0 % | 19 | 0 | 5 ms | 10 ms | 5 ms
|
Sell | 0 % | 49 | 0 | 0 ms | 3004 ms | 368 ms
|
SelectCategoryToSellItem | 0 % | 48 | 0 | 3 ms | 3002 ms | 87 ms
|
SellItemForm | 0 % | 40 | 0 | 2 ms | 3004 ms | 78 ms
|
RegisterItem | 0 % | 37 | 0 | 4 ms | 721 ms | 28 ms
|
AboutMe (auth form) | 2 % | 170 | 0 | 0 ms | 3006 ms | 185 ms
|
AboutMe | 3 % | 228 | 0 | 4 ms | 3029 ms | 187 ms
|
Back probability | 7 % | 546 | 0 | 0 ms | 0 ms | 0 ms
|
End of Session | 0 % | 63 | 0 | 0 ms | 0 ms | 0 ms
|
Total | 100 % | 6828 | 57 | - | - | 216 ms
|
Average throughput | 57 req/s
| |||||
Completed sessions | 55
| |||||
Total time | 3464 seconds
| |||||
Average session time | 62 seconds
| |||||
| State name | % of total | Count | Errors | Minimum Time | Maximum Time | Average Time |
|---|---|---|---|---|---|---|
Home | 4 % | 1809 | 0 | 0 ms | 8 ms | 0 ms
|
Register | 1 % | 393 | 0 | 0 ms | 5 ms | 0 ms
|
RegisterUser | 1 % | 383 | 0 | 5 ms | 874 ms | 13 ms
|
Browse | 7 % | 2668 | 0 | 0 ms | 41 ms | 0 ms
|
BrowseCategories | 4 % | 1837 | 0 | 3 ms | 23 ms | 4 ms
|
SearchItemsInCategory | 15 % | 5681 | 0 | 0 ms | 54 ms | 4 ms
|
BrowseRegions | 2 % | 801 | 0 | 3 ms | 15 ms | 4 ms
|
BrowseCategoriesInRegion | 2 % | 791 | 0 | 3 ms | 49 ms | 4 ms
|
SearchItemsInRegion | 5 % | 1913 | 0 | 0 ms | 729 ms | 8 ms
|
ViewItem | 14 % | 5271 | 2 | 3 ms | 78 ms | 6 ms
|
ViewUserInfo | 3 % | 1253 | 0 | 3 ms | 384 ms | 6 ms
|
ViewBidHistory | 1 % | 643 | 0 | 3 ms | 56 ms | 12 ms
|
BuyNowAuth | 1 % | 470 | 0 | 2 ms | 15 ms | 2 ms
|
BuyNow | 1 % | 462 | 65 | 3 ms | 24 ms | 6 ms
|
StoreBuyBow | 1 % | 389 | 0 | 4 ms | 511 ms | 7 ms
|
PutBidAuth | 4 % | 1790 | 0 | 0 ms | 12 ms | 2 ms
|
PutBid | 5 % | 2048 | 264 | 3 ms | 47 ms | 7 ms
|
StoreBid | 3 % | 1305 | 0 | 4 ms | 939 ms | 6 ms
|
PutCommentAuth | 0 % | 0 | 0 | 0 ms | 0 ms | 0 ms
|
PutComment | 0 % | 196 | 18 | 3 ms | 15 ms | 5 ms
|
StoreComment | 0 % | 174 | 0 | 4 ms | 598 ms | 9 ms
|
Sell | 0 % | 232 | 0 | 0 ms | 7 ms | 0 ms
|
SelectCategoryToSellItem | 0 % | 227 | 0 | 3 ms | 50 ms | 5 ms
|
SellItemForm | 0 % | 228 | 0 | 2 ms | 51 ms | 3 ms
|
RegisterItem | 0 % | 222 | 0 | 4 ms | 581 ms | 8 ms
|
AboutMe (auth form) | 1 % | 631 | 0 | 0 ms | 7 ms | 0 ms
|
AboutMe | 2 % | 1052 | 0 | 4 ms | 42 ms | 14 ms
|
Back probability | 10 % | 3808 | 0 | 0 ms | 0 ms | 0 ms
|
End of Session | 1 % | 541 | 0 | 0 ms | 0 ms | 0 ms
|
Total | 100 % | 37218 | 349 | - | - | 4 ms
|
Average throughput | 83 req/s
| |||||
Completed sessions | 543
| |||||
Total time | 126008 seconds
| |||||
Average session time | 232 seconds
| |||||
| State name | % of total | Count | Errors | Minimum Time | Maximum Time | Average Time |
|---|---|---|---|---|---|---|
Home | 4 % | 61 | 0 | 0 ms | 4 ms | 0 ms
|
Register | 1 % | 17 | 0 | 0 ms | 5 ms | 0 ms
|
RegisterUser | 1 % | 15 | 0 | 5 ms | 6 ms | 3 ms
|
Browse | 7 % | 91 | 0 | 0 ms | 5 ms | 0 ms
|
BrowseCategories | 4 % | 63 | 0 | 3 ms | 12 ms | 3 ms
|
SearchItemsInCategory | 15 % | 195 | 0 | 1 ms | 12 ms | 4 ms
|
BrowseRegions | 1 % | 19 | 0 | 3 ms | 8 ms | 4 ms
|
BrowseCategoriesInRegion | 1 % | 22 | 0 | 3 ms | 7 ms | 4 ms
|
SearchItemsInRegion | 5 % | 65 | 0 | 0 ms | 66 ms | 9 ms
|
ViewItem | 14 % | 182 | 0 | 3 ms | 63 ms | 6 ms
|
ViewUserInfo | 2 % | 37 | 0 | 3 ms | 9 ms | 5 ms
|
ViewBidHistory | 1 % | 20 | 0 | 3 ms | 24 ms | 11 ms
|
BuyNowAuth | 1 % | 13 | 0 | 2 ms | 10 ms | 4 ms
|
BuyNow | 1 % | 16 | 4 | 4 ms | 10 ms | 6 ms
|
StoreBuyBow | 1 % | 14 | 0 | 4 ms | 9 ms | 5 ms
|
PutBidAuth | 6 % | 83 | 0 | 0 ms | 6 ms | 2 ms
|
PutBid | 6 % | 84 | 10 | 3 ms | 17 ms | 6 ms
|
StoreBid | 3 % | 46 | 0 | 4 ms | 18 ms | 6 ms
|
PutCommentAuth | 0 % | 0 | 0 | 0 ms | 0 ms | 0 ms
|
PutComment | 0 % | 10 | 0 | 5 ms | 7 ms | 1 ms
|
StoreComment | 0 % | 2 | 0 | 5 ms | 6 ms | 15 ms
|
Sell | 0 % | 5 | 0 | 0 ms | 1 ms | 0 ms
|
SelectCategoryToSellItem | 0 % | 4 | 0 | 5 ms | 5 ms | 2 ms
|
SellItemForm | 0 % | 2 | 0 | 2 ms | 6 ms | 10 ms
|
RegisterItem | 0 % | 6 | 0 | 4 ms | 6 ms | 7 ms
|
AboutMe (auth form) | 2 % | 27 | 0 | 0 ms | 4 ms | 0 ms
|
AboutMe | 3 % | 47 | 0 | 4 ms | 23 ms | 13 ms
|
Back probability | 10 % | 129 | 0 | 0 ms | 0 ms | 0 ms
|
End of Session | 0 % | 12 | 0 | 0 ms | 0 ms | 0 ms
|
Total | 100 % | 1287 | 14 | - | - | 4 ms
|
Average throughput | 43 req/s
| |||||
Completed sessions | 14
| |||||
Total time | 5084 seconds
| |||||
Average session time | 363 seconds
| |||||
| State name | % of total | Count | Errors | Minimum Time | Maximum Time | Average Time |
|---|---|---|---|---|---|---|
Home | 5 % | 2612 | 0 | 0 ms | 3152 ms | 364 ms
|
Register | 1 % | 514 | 0 | 0 ms | 3013 ms | 19 ms
|
RegisterUser | 1 % | 494 | 0 | 5 ms | 3016 ms | 40 ms
|
Browse | 7 % | 3411 | 0 | 0 ms | 3009 ms | 39 ms
|
BrowseCategories | 5 % | 2363 | 0 | 3 ms | 3020 ms | 30 ms
|
SearchItemsInCategory | 15 % | 6946 | 0 | 0 ms | 3023 ms | 14 ms
|
BrowseRegions | 2 % | 969 | 0 | 3 ms | 3006 ms | 22 ms
|
BrowseCategoriesInRegion | 2 % | 951 | 0 | 3 ms | 3009 ms | 11 ms
|
SearchItemsInRegion | 4 % | 2245 | 0 | 0 ms | 3020 ms | 14 ms
|
ViewItem | 13 % | 6330 | 2 | 3 ms | 3031 ms | 13 ms
|
ViewUserInfo | 3 % | 1449 | 0 | 3 ms | 3002 ms | 8 ms
|
ViewBidHistory | 1 % | 746 | 0 | 3 ms | 3016 ms | 18 ms
|
BuyNowAuth | 1 % | 546 | 0 | 2 ms | 3006 ms | 8 ms
|
BuyNow | 1 % | 535 | 81 | 3 ms | 33 ms | 6 ms
|
StoreBuyBow | 0 % | 444 | 0 | 4 ms | 511 ms | 7 ms
|
PutBidAuth | 4 % | 2166 | 0 | 0 ms | 3000 ms | 6 ms
|
PutBid | 5 % | 2398 | 316 | 3 ms | 3014 ms | 13 ms
|
StoreBid | 3 % | 1482 | 0 | 4 ms | 3019 ms | 14 ms
|
PutCommentAuth | 0 % | 0 | 0 | 0 ms | 0 ms | 0 ms
|
PutComment | 0 % | 229 | 21 | 3 ms | 37 ms | 5 ms
|
StoreComment | 0 % | 195 | 0 | 4 ms | 598 ms | 9 ms
|
Sell | 0 % | 286 | 0 | 0 ms | 3004 ms | 63 ms
|
SelectCategoryToSellItem | 0 % | 279 | 0 | 3 ms | 3002 ms | 19 ms
|
SellItemForm | 0 % | 270 | 0 | 2 ms | 3004 ms | 14 ms
|
RegisterItem | 0 % | 265 | 0 | 4 ms | 721 ms | 11 ms
|
AboutMe (auth form) | 1 % | 828 | 0 | 0 ms | 3006 ms | 38 ms
|
AboutMe | 2 % | 1334 | 0 | 4 ms | 3029 ms | 43 ms
|
Back probability | 9 % | 4483 | 0 | 0 ms | 0 ms | 0 ms
|
End of Session | 1 % | 616 | 0 | 0 ms | 0 ms | 0 ms
|
Total | 100 % | 45386 | 420 | - | - | 36 ms
|
Average throughput | 76 req/s
| |||||
Completed sessions | 616
| |||||
Total time | 136320 seconds
| |||||
Average session time | 221 seconds
| |||||
An error occured while waiting for remote processes termination (Skipping waits)
Command is: /usr/bin/scp farm6.csail.mit.edu:/tmp/client1 /home/drkp/sandbox/txcache/src/RUBiS-1.4.3/bench/2009-3-19@5:52:51//client1.bin
Command is: /usr/bin/ssh -x localhost /bin/bash -c 'LANG=en_GB.UTF-8 /usr/bin/sar -n DEV -n SOCK -rubcw 1 605 -f /home/drkp/sandbox/txcache/src/RUBiS-1.4.3/bench/2009-3-19@5:52:51//client1.bin > /home/drkp/sandbox/txcache/src/RUBiS-1.4.3/bench/2009-3-19@5:52:51//client1'
Command is: /usr/bin/scp farm14:/tmp/db_server0 /home/drkp/sandbox/txcache/src/RUBiS-1.4.3/bench/2009-3-19@5:52:51//db_server0.bin
Command is: /usr/bin/ssh -x localhost /bin/bash -c 'LANG=en_GB.UTF-8 /usr/bin/sar -n DEV -n SOCK -rubcw 1 605 -f /home/drkp/sandbox/txcache/src/RUBiS-1.4.3/bench/2009-3-19@5:52:51//db_server0.bin > /home/drkp/sandbox/txcache/src/RUBiS-1.4.3/bench/2009-3-19@5:52:51//db_server0'
Command is: /usr/bin/scp farm12.csail.mit.edu:/tmp/web_server0 /home/drkp/sandbox/txcache/src/RUBiS-1.4.3/bench/2009-3-19@5:52:51//web_server0.bin
Command is: /usr/bin/ssh -x localhost /bin/bash -c 'LANG=en_GB.UTF-8 /usr/bin/sar -n DEV -n SOCK -rubcw 1 605 -f /home/drkp/sandbox/txcache/src/RUBiS-1.4.3/bench/2009-3-19@5:52:51//web_server0.bin > /home/drkp/sandbox/txcache/src/RUBiS-1.4.3/bench/2009-3-19@5:52:51//web_server0'
Command is: /usr/bin/scp farm13.csail.mit.edu:/tmp/web_server1 /home/drkp/sandbox/txcache/src/RUBiS-1.4.3/bench/2009-3-19@5:52:51//web_server1.bin
Command is: /usr/bin/ssh -x localhost /bin/bash -c 'LANG=en_GB.UTF-8 /usr/bin/sar -n DEV -n SOCK -rubcw 1 605 -f /home/drkp/sandbox/txcache/src/RUBiS-1.4.3/bench/2009-3-19@5:52:51//web_server1.bin > /home/drkp/sandbox/txcache/src/RUBiS-1.4.3/bench/2009-3-19@5:52:51//web_server1'
Command is: /usr/bin/scp localhost:/tmp/client0 /home/drkp/sandbox/txcache/src/RUBiS-1.4.3/bench/2009-3-19@5:52:51//client0.bin
Command is: /usr/bin/ssh -x localhost /bin/bash -c 'LANG=en_GB.UTF-8 /usr/bin/sar -n DEV -n SOCK -rubcw 1 605 -f /home/drkp/sandbox/txcache/src/RUBiS-1.4.3/bench/2009-3-19@5:52:51//client0.bin > /home/drkp/sandbox/txcache/src/RUBiS-1.4.3/bench/2009-3-19@5:52:51//client0'
Command is: /usr/bin/scp farm6.csail.mit.edu:/tmp/trace_client1.html /home/drkp/sandbox/txcache/src/RUBiS-1.4.3/bench/2009-3-19@5:52:51//
Command is: /usr/bin/scp farm6.csail.mit.edu:/tmp/stat_client1.html /home/drkp/sandbox/txcache/src/RUBiS-1.4.3/bench/2009-3-19@5:52:51//
|
|
|
|
|
|
 | 
|
 | 
|
 | 
|
 | 
|
 | 
|
 | 
|
 | 
|
 | 
|
 | 
|