Node information
Test timing information
Up ramp statistics
Runtime session statistics
Down ramp statistics
Overall statistics
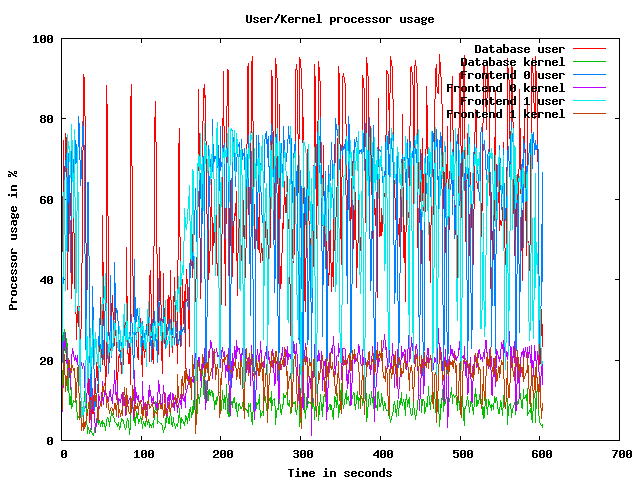
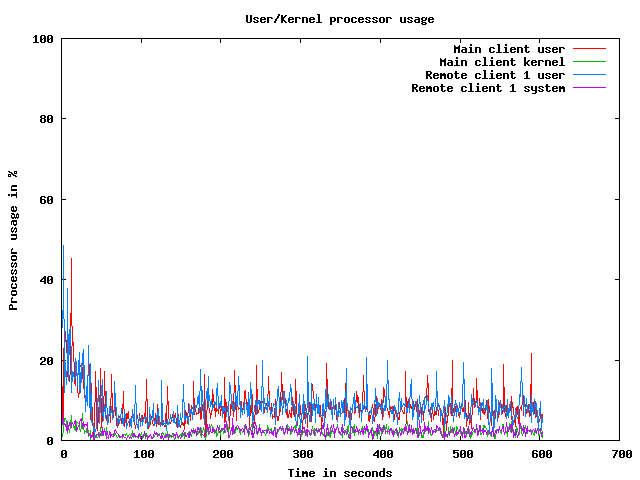
CPU usage graphs
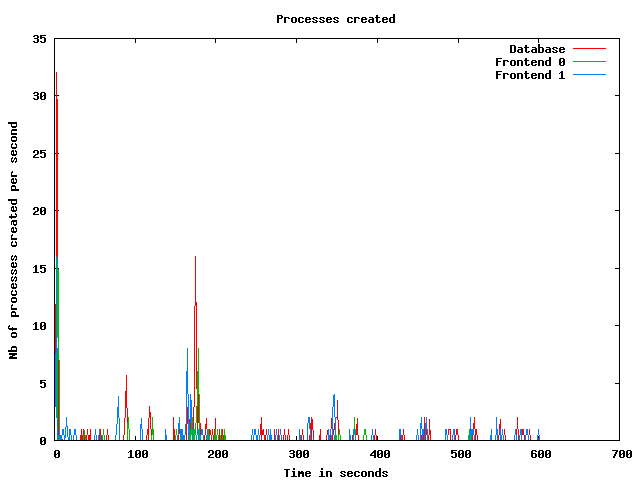
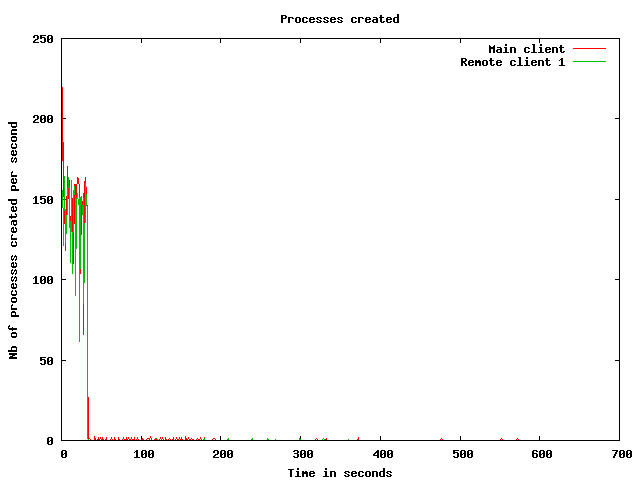
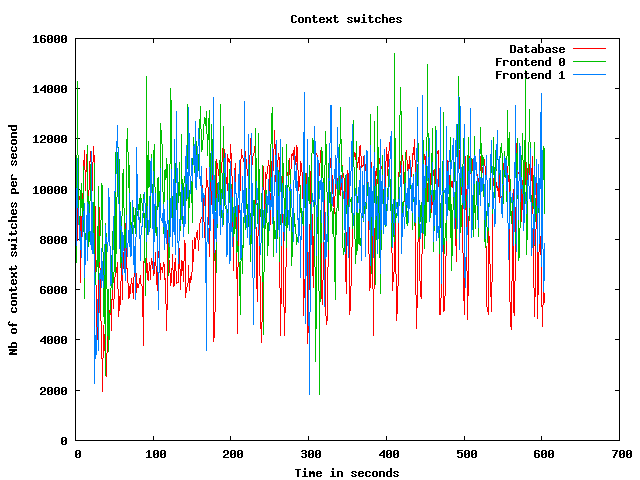
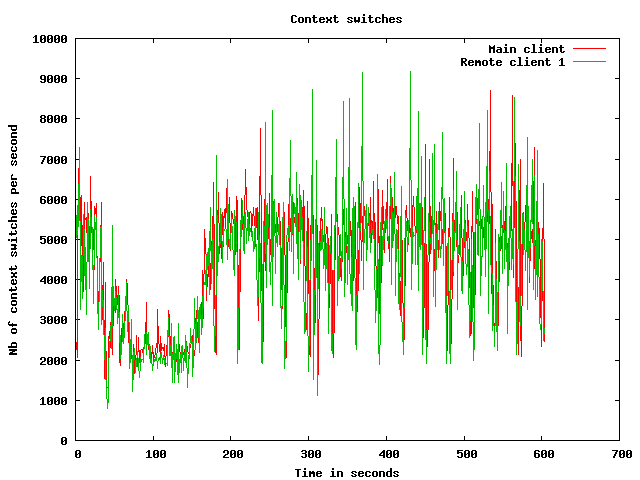
Processes usage graphs
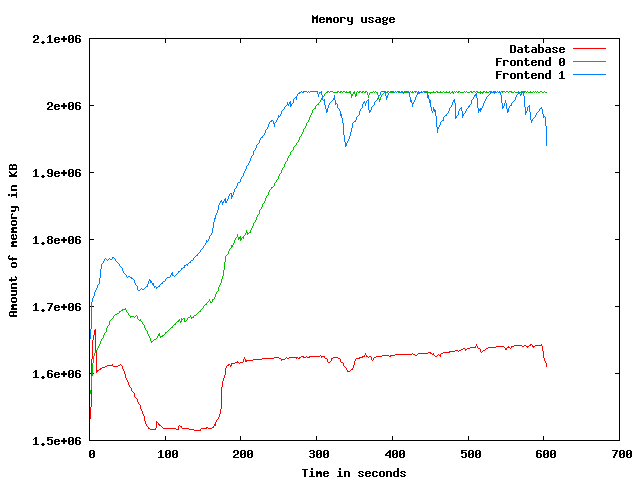
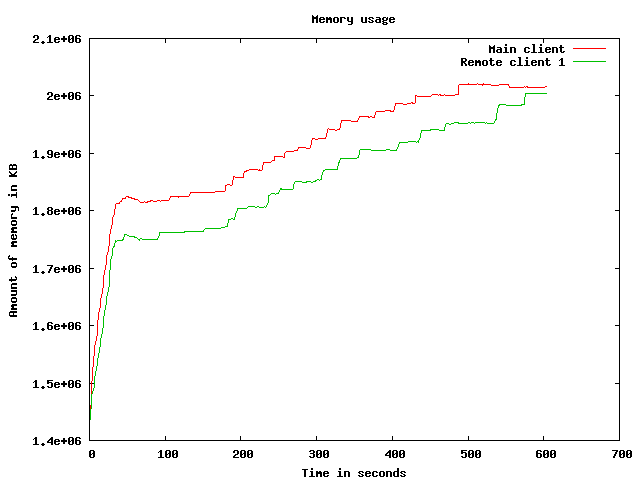
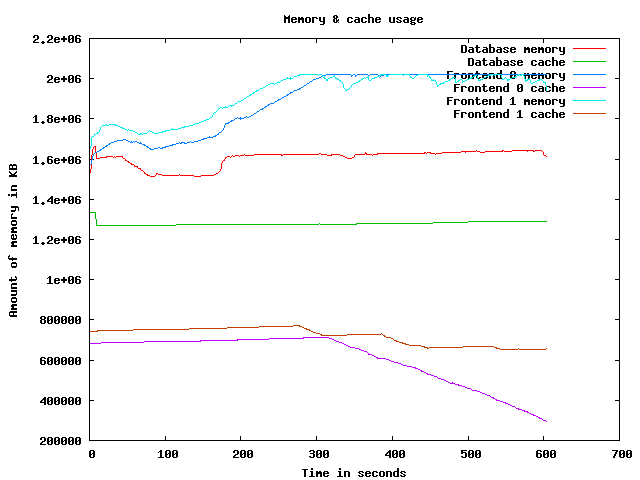
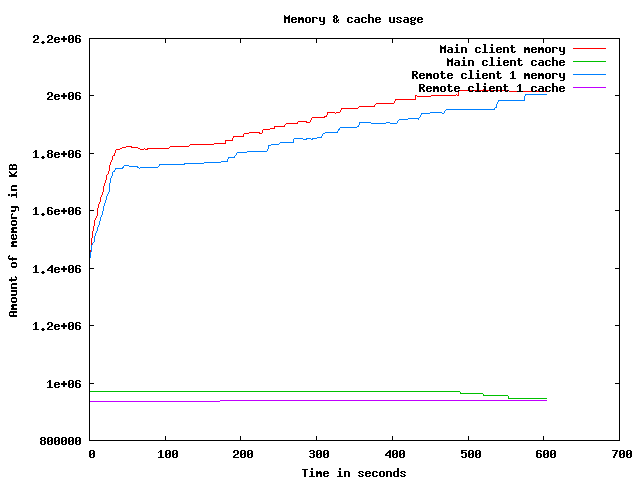
Memory usage graph
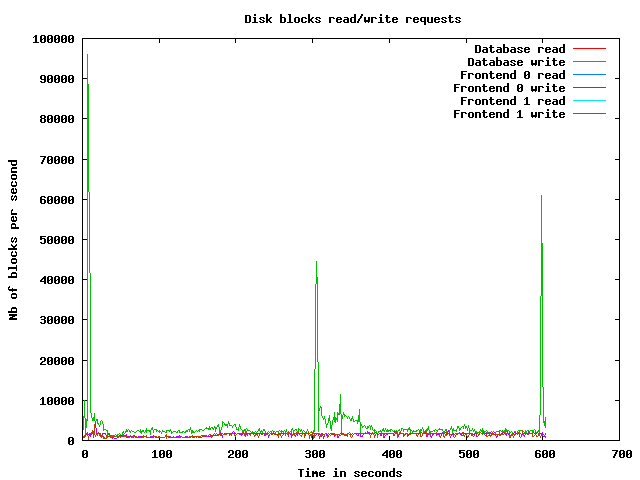
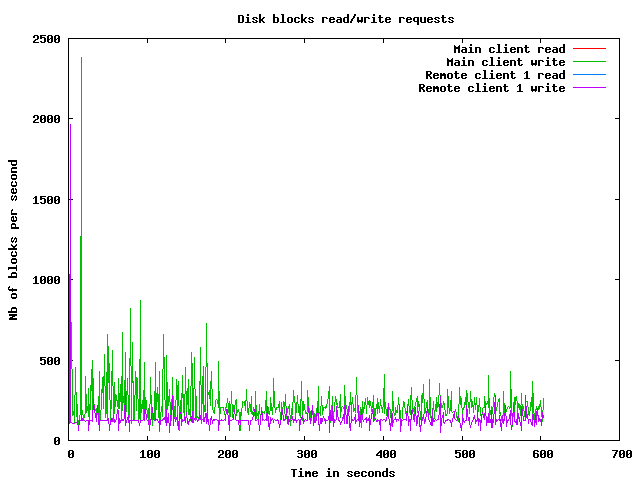
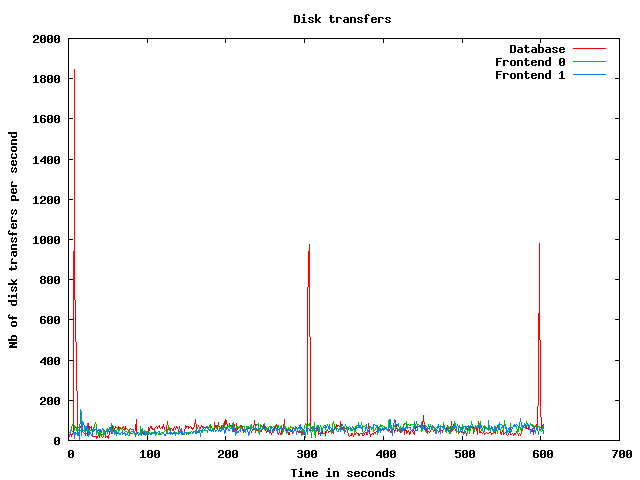
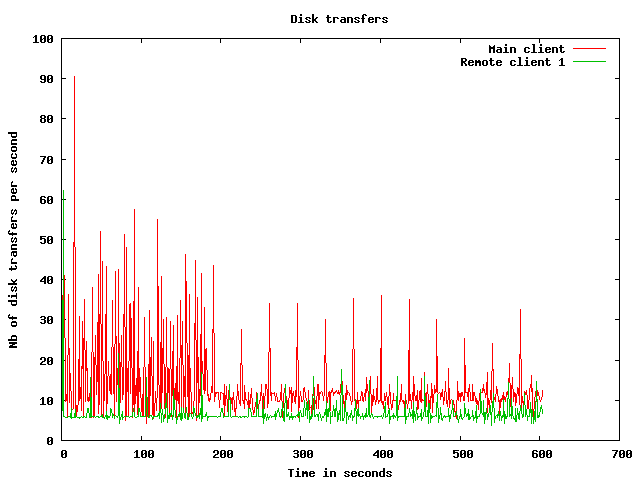
Disk usage graphs
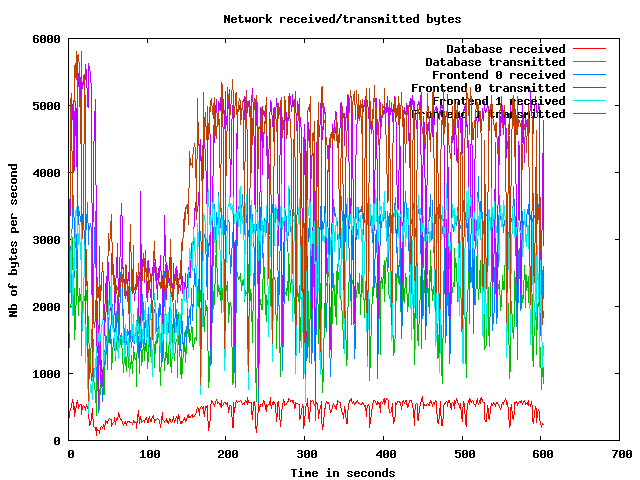
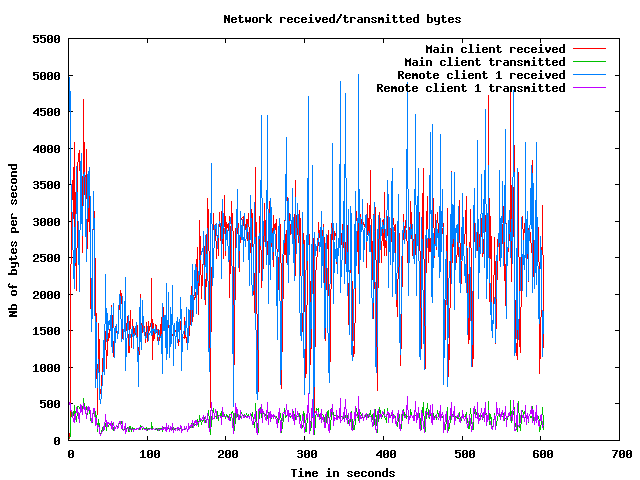
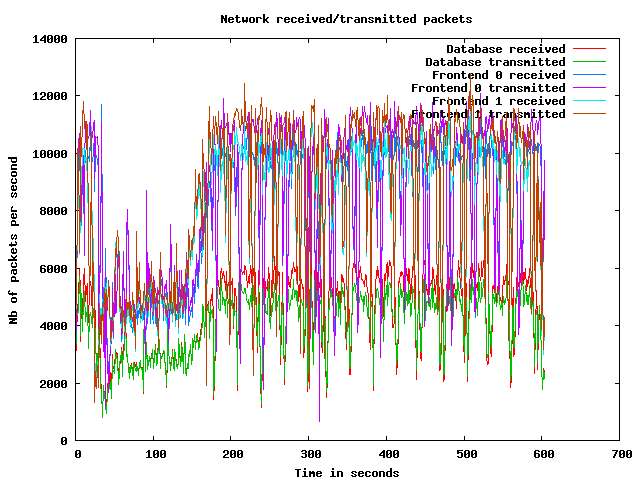
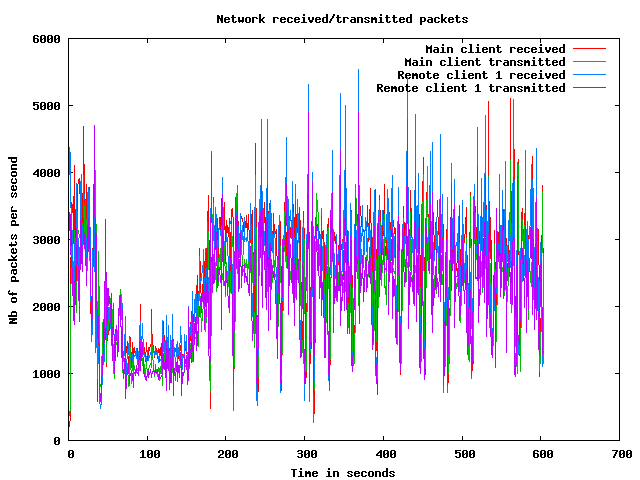
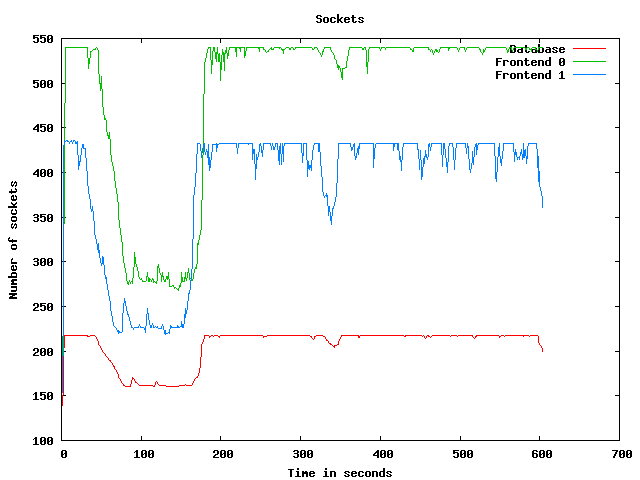
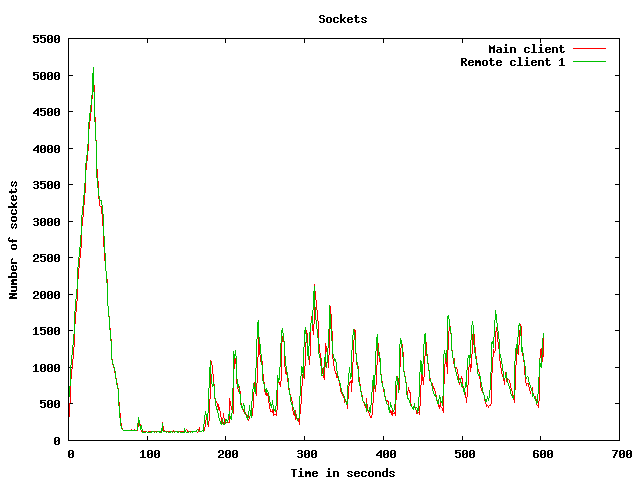
Network usage graphs
| Test start | 2009-3-19 7:48:52 |
| Up ramp start | 2009-3-19 7:49:27 |
| Runtime session start | 2009-3-19 7:51:27 |
| Down ramp start | 2009-3-19 7:58:57 |
| Test end | 2009-3-19 8:1:41 |
| Up ramp length | 2 minutes 0 millisecond (requested 120000 ms) |
| Runtime session length | 7 minutes 30 seconds 1 millisecond (requested 450000 ms) |
| Down ramp length | 30 seconds 0 millisecond (requested 30000 ms) |
| Total test length | 12 minutes 48 seconds 995 milliseconds |
| State name | % of total | Count | Errors | Minimum Time | Maximum Time | Average Time |
|---|---|---|---|---|---|---|
Home | 9 % | 7657 | 0 | 0 ms | 93005 ms | 6294 ms
|
Register | 1 % | 1099 | 0 | 0 ms | 45812 ms | 2078 ms
|
RegisterUser | 1 % | 1031 | 57 | 5 ms | 45589 ms | 1837 ms
|
Browse | 9 % | 7820 | 0 | 0 ms | 45720 ms | 2509 ms
|
BrowseCategories | 6 % | 5186 | 0 | 3 ms | 59121 ms | 1761 ms
|
SearchItemsInCategory | 14 % | 12065 | 0 | 3 ms | 59106 ms | 1395 ms
|
BrowseRegions | 2 % | 2160 | 0 | 3 ms | 45754 ms | 1878 ms
|
BrowseCategoriesInRegion | 2 % | 2024 | 0 | 3 ms | 59104 ms | 1514 ms
|
SearchItemsInRegion | 5 % | 4127 | 0 | 0 ms | 65184 ms | 1567 ms
|
ViewItem | 12 % | 10228 | 0 | 3 ms | 45811 ms | 1218 ms
|
ViewUserInfo | 2 % | 1766 | 0 | 3 ms | 45255 ms | 1036 ms
|
ViewBidHistory | 1 % | 988 | 0 | 3 ms | 45817 ms | 1506 ms
|
BuyNowAuth | 1 % | 846 | 0 | 2 ms | 45394 ms | 1158 ms
|
BuyNow | 0 % | 754 | 94 | 3 ms | 45366 ms | 732 ms
|
StoreBuyBow | 0 % | 570 | 0 | 5 ms | 45377 ms | 1466 ms
|
PutBidAuth | 4 % | 3553 | 0 | 0 ms | 45497 ms | 1328 ms
|
PutBid | 4 % | 3522 | 387 | 0 ms | 45615 ms | 1416 ms
|
StoreBid | 2 % | 2122 | 0 | 5 ms | 45480 ms | 1310 ms
|
PutCommentAuth | 0 % | 0 | 0 | 0 ms | 0 ms | 0 ms
|
PutComment | 0 % | 317 | 43 | 4 ms | 45676 ms | 872 ms
|
StoreComment | 0 % | 254 | 0 | 5 ms | 45034 ms | 1229 ms
|
Sell | 0 % | 592 | 0 | 0 ms | 45282 ms | 1958 ms
|
SelectCategoryToSellItem | 0 % | 549 | 0 | 3 ms | 45385 ms | 1665 ms
|
SellItemForm | 0 % | 508 | 0 | 2 ms | 45509 ms | 1735 ms
|
RegisterItem | 0 % | 485 | 0 | 4 ms | 45259 ms | 1659 ms
|
AboutMe (auth form) | 2 % | 1773 | 0 | 0 ms | 45682 ms | 2375 ms
|
AboutMe | 3 % | 2503 | 0 | 4 ms | 45778 ms | 1757 ms
|
Back probability | 7 % | 6472 | 0 | 0 ms | 0 ms | 0 ms
|
End of Session | 1 % | 870 | 0 | 0 ms | 0 ms | 0 ms
|
Total | 100 % | 81841 | 581 | - | - | 1882 ms
|
Average throughput | 686 req/s
| |||||
Completed sessions | 795
| |||||
Total time | 45448 seconds
| |||||
Average session time | 57 seconds
| |||||
| State name | % of total | Count | Errors | Minimum Time | Maximum Time | Average Time |
|---|---|---|---|---|---|---|
Home | 4 % | 13009 | 0 | 0 ms | 191436 ms | 451 ms
|
Register | 1 % | 3294 | 0 | 0 ms | 99820 ms | 893 ms
|
RegisterUser | 1 % | 3246 | 161 | 5 ms | 190009 ms | 1021 ms
|
Browse | 7 % | 22568 | 0 | 0 ms | 211811 ms | 936 ms
|
BrowseCategories | 4 % | 15804 | 0 | 3 ms | 190032 ms | 906 ms
|
SearchItemsInCategory | 15 % | 49553 | 0 | 3 ms | 211871 ms | 995 ms
|
BrowseRegions | 2 % | 6527 | 0 | 3 ms | 211457 ms | 1023 ms
|
BrowseCategoriesInRegion | 2 % | 6425 | 0 | 3 ms | 191648 ms | 954 ms
|
SearchItemsInRegion | 5 % | 16942 | 0 | 0 ms | 211853 ms | 1070 ms
|
ViewItem | 14 % | 45789 | 0 | 3 ms | 195764 ms | 1004 ms
|
ViewUserInfo | 3 % | 10311 | 0 | 3 ms | 194324 ms | 1032 ms
|
ViewBidHistory | 1 % | 5539 | 0 | 4 ms | 191021 ms | 1527 ms
|
BuyNowAuth | 1 % | 4328 | 0 | 2 ms | 190034 ms | 953 ms
|
BuyNow | 1 % | 4240 | 497 | 3 ms | 194285 ms | 1073 ms
|
StoreBuyBow | 1 % | 3685 | 6 | 5 ms | 93823 ms | 917 ms
|
PutBidAuth | 4 % | 15908 | 0 | 0 ms | 193983 ms | 1007 ms
|
PutBid | 5 % | 18311 | 1896 | 4 ms | 191935 ms | 965 ms
|
StoreBid | 3 % | 12255 | 12 | 5 ms | 191703 ms | 948 ms
|
PutCommentAuth | 0 % | 0 | 0 | 0 ms | 0 ms | 0 ms
|
PutComment | 0 % | 1584 | 92 | 5 ms | 190096 ms | 1172 ms
|
StoreComment | 0 % | 1456 | 0 | 5 ms | 65107 ms | 1066 ms
|
Sell | 0 % | 1728 | 0 | 0 ms | 193998 ms | 1066 ms
|
SelectCategoryToSellItem | 0 % | 1711 | 0 | 4 ms | 93892 ms | 1109 ms
|
SellItemForm | 0 % | 1677 | 0 | 2 ms | 45625 ms | 709 ms
|
RegisterItem | 0 % | 1638 | 0 | 5 ms | 94592 ms | 885 ms
|
AboutMe (auth form) | 1 % | 5197 | 0 | 0 ms | 189997 ms | 1090 ms
|
AboutMe | 2 % | 8926 | 0 | 4 ms | 193783 ms | 1112 ms
|
Back probability | 10 % | 33960 | 0 | 0 ms | 0 ms | 0 ms
|
End of Session | 1 % | 4692 | 0 | 0 ms | 0 ms | 0 ms
|
Total | 100 % | 320303 | 2664 | - | - | 853 ms
|
Average throughput | 717 req/s
| |||||
Completed sessions | 4680
| |||||
Total time | 1230773 seconds
| |||||
Average session time | 262 seconds
| |||||
| State name | % of total | Count | Errors | Minimum Time | Maximum Time | Average Time |
|---|---|---|---|---|---|---|
Home | 4 % | 471 | 0 | 0 ms | 9745 ms | 335 ms
|
Register | 0 % | 102 | 0 | 0 ms | 9736 ms | 757 ms
|
RegisterUser | 0 % | 109 | 5 | 5 ms | 94501 ms | 4154 ms
|
Browse | 7 % | 847 | 0 | 0 ms | 189999 ms | 1622 ms
|
BrowseCategories | 4 % | 562 | 0 | 3 ms | 93003 ms | 2613 ms
|
SearchItemsInCategory | 16 % | 1873 | 0 | 3 ms | 193037 ms | 1726 ms
|
BrowseRegions | 1 % | 206 | 0 | 3 ms | 93018 ms | 2692 ms
|
BrowseCategoriesInRegion | 1 % | 219 | 0 | 3 ms | 93000 ms | 2065 ms
|
SearchItemsInRegion | 5 % | 591 | 0 | 0 ms | 93076 ms | 1818 ms
|
ViewItem | 13 % | 1543 | 0 | 3 ms | 190020 ms | 2344 ms
|
ViewUserInfo | 3 % | 386 | 0 | 3 ms | 93019 ms | 2051 ms
|
ViewBidHistory | 1 % | 193 | 0 | 4 ms | 93050 ms | 2494 ms
|
BuyNowAuth | 1 % | 157 | 0 | 2 ms | 45045 ms | 1274 ms
|
BuyNow | 1 % | 158 | 25 | 4 ms | 93022 ms | 2516 ms
|
StoreBuyBow | 1 % | 144 | 1 | 5 ms | 93011 ms | 1948 ms
|
PutBidAuth | 4 % | 568 | 0 | 0 ms | 93003 ms | 1607 ms
|
PutBid | 5 % | 635 | 60 | 4 ms | 190064 ms | 2027 ms
|
StoreBid | 3 % | 443 | 0 | 5 ms | 93035 ms | 1903 ms
|
PutCommentAuth | 0 % | 0 | 0 | 0 ms | 0 ms | 0 ms
|
PutComment | 0 % | 64 | 2 | 5 ms | 93008 ms | 3211 ms
|
StoreComment | 0 % | 60 | 0 | 5 ms | 45008 ms | 2161 ms
|
Sell | 0 % | 67 | 0 | 0 ms | 93005 ms | 2422 ms
|
SelectCategoryToSellItem | 0 % | 55 | 0 | 4 ms | 93006 ms | 4096 ms
|
SellItemForm | 0 % | 69 | 0 | 2 ms | 21008 ms | 987 ms
|
RegisterItem | 0 % | 52 | 0 | 4 ms | 45022 ms | 1904 ms
|
AboutMe (auth form) | 1 % | 218 | 0 | 0 ms | 191041 ms | 2333 ms
|
AboutMe | 2 % | 318 | 0 | 5 ms | 93027 ms | 1828 ms
|
Back probability | 10 % | 1228 | 0 | 0 ms | 0 ms | 0 ms
|
End of Session | 1 % | 168 | 0 | 0 ms | 0 ms | 0 ms
|
Total | 100 % | 11506 | 93 | - | - | 1693 ms
|
Average throughput | 386 req/s
| |||||
Completed sessions | 176
| |||||
Total time | 64263 seconds
| |||||
Average session time | 365 seconds
| |||||
| State name | % of total | Count | Errors | Minimum Time | Maximum Time | Average Time |
|---|---|---|---|---|---|---|
Home | 5 % | 21138 | 0 | 0 ms | 191436 ms | 2565 ms
|
Register | 1 % | 4495 | 0 | 0 ms | 190004 ms | 1307 ms
|
RegisterUser | 1 % | 4389 | 223 | 5 ms | 190009 ms | 1289 ms
|
Browse | 7 % | 31242 | 0 | 0 ms | 211811 ms | 1381 ms
|
BrowseCategories | 5 % | 21558 | 0 | 3 ms | 190032 ms | 1213 ms
|
SearchItemsInCategory | 15 % | 63746 | 0 | 3 ms | 211871 ms | 1134 ms
|
BrowseRegions | 2 % | 8894 | 0 | 3 ms | 211457 ms | 1322 ms
|
BrowseCategoriesInRegion | 2 % | 8671 | 0 | 3 ms | 191648 ms | 1134 ms
|
SearchItemsInRegion | 5 % | 21736 | 0 | 0 ms | 211853 ms | 1224 ms
|
ViewItem | 13 % | 57677 | 0 | 3 ms | 195764 ms | 1117 ms
|
ViewUserInfo | 3 % | 12496 | 0 | 3 ms | 194324 ms | 1160 ms
|
ViewBidHistory | 1 % | 6746 | 0 | 3 ms | 191021 ms | 1574 ms
|
BuyNowAuth | 1 % | 5333 | 0 | 2 ms | 190034 ms | 1065 ms
|
BuyNow | 1 % | 5155 | 617 | 3 ms | 194285 ms | 1102 ms
|
StoreBuyBow | 1 % | 4400 | 7 | 5 ms | 93823 ms | 1043 ms
|
PutBidAuth | 4 % | 20041 | 0 | 0 ms | 193983 ms | 1114 ms
|
PutBid | 5 % | 22546 | 2343 | 0 ms | 191935 ms | 1087 ms
|
StoreBid | 3 % | 14822 | 12 | 5 ms | 191703 ms | 1086 ms
|
PutCommentAuth | 0 % | 0 | 0 | 0 ms | 0 ms | 0 ms
|
PutComment | 0 % | 1966 | 137 | 4 ms | 190096 ms | 1286 ms
|
StoreComment | 0 % | 1771 | 0 | 5 ms | 65107 ms | 1126 ms
|
Sell | 0 % | 2388 | 0 | 0 ms | 193998 ms | 1363 ms
|
SelectCategoryToSellItem | 0 % | 2316 | 0 | 3 ms | 93892 ms | 1311 ms
|
SellItemForm | 0 % | 2254 | 0 | 2 ms | 93007 ms | 990 ms
|
RegisterItem | 0 % | 2176 | 0 | 4 ms | 94592 ms | 1081 ms
|
AboutMe (auth form) | 1 % | 7190 | 0 | 0 ms | 191041 ms | 1483 ms
|
AboutMe | 2 % | 11827 | 0 | 4 ms | 193783 ms | 1380 ms
|
Back probability | 10 % | 41679 | 0 | 0 ms | 0 ms | 0 ms
|
End of Session | 1 % | 5731 | 0 | 0 ms | 0 ms | 0 ms
|
Total | 100 % | 414383 | 3339 | - | - | 1116 ms
|
Average throughput | 696 req/s
| |||||
Completed sessions | 5731
| |||||
Total time | 1370904 seconds
| |||||
Average session time | 239 seconds
| |||||
An error occured while waiting for remote processes termination (Skipping waits)
Command is: /usr/bin/scp farm6.csail.mit.edu:/tmp/client1 /home/drkp/sandbox/txcache/src/RUBiS-1.4.3/bench/2009-3-19@7:48:52//client1.bin
Command is: /usr/bin/ssh -x localhost /bin/bash -c 'LANG=en_GB.UTF-8 /usr/bin/sar -n DEV -n SOCK -rubcw 1 605 -f /home/drkp/sandbox/txcache/src/RUBiS-1.4.3/bench/2009-3-19@7:48:52//client1.bin > /home/drkp/sandbox/txcache/src/RUBiS-1.4.3/bench/2009-3-19@7:48:52//client1'
Command is: /usr/bin/scp farm14:/tmp/db_server0 /home/drkp/sandbox/txcache/src/RUBiS-1.4.3/bench/2009-3-19@7:48:52//db_server0.bin
Command is: /usr/bin/ssh -x localhost /bin/bash -c 'LANG=en_GB.UTF-8 /usr/bin/sar -n DEV -n SOCK -rubcw 1 605 -f /home/drkp/sandbox/txcache/src/RUBiS-1.4.3/bench/2009-3-19@7:48:52//db_server0.bin > /home/drkp/sandbox/txcache/src/RUBiS-1.4.3/bench/2009-3-19@7:48:52//db_server0'
Command is: /usr/bin/scp farm12.csail.mit.edu:/tmp/web_server0 /home/drkp/sandbox/txcache/src/RUBiS-1.4.3/bench/2009-3-19@7:48:52//web_server0.bin
Command is: /usr/bin/ssh -x localhost /bin/bash -c 'LANG=en_GB.UTF-8 /usr/bin/sar -n DEV -n SOCK -rubcw 1 605 -f /home/drkp/sandbox/txcache/src/RUBiS-1.4.3/bench/2009-3-19@7:48:52//web_server0.bin > /home/drkp/sandbox/txcache/src/RUBiS-1.4.3/bench/2009-3-19@7:48:52//web_server0'
Command is: /usr/bin/scp farm13.csail.mit.edu:/tmp/web_server1 /home/drkp/sandbox/txcache/src/RUBiS-1.4.3/bench/2009-3-19@7:48:52//web_server1.bin
Command is: /usr/bin/ssh -x localhost /bin/bash -c 'LANG=en_GB.UTF-8 /usr/bin/sar -n DEV -n SOCK -rubcw 1 605 -f /home/drkp/sandbox/txcache/src/RUBiS-1.4.3/bench/2009-3-19@7:48:52//web_server1.bin > /home/drkp/sandbox/txcache/src/RUBiS-1.4.3/bench/2009-3-19@7:48:52//web_server1'
Command is: /usr/bin/scp localhost:/tmp/client0 /home/drkp/sandbox/txcache/src/RUBiS-1.4.3/bench/2009-3-19@7:48:52//client0.bin
Command is: /usr/bin/ssh -x localhost /bin/bash -c 'LANG=en_GB.UTF-8 /usr/bin/sar -n DEV -n SOCK -rubcw 1 605 -f /home/drkp/sandbox/txcache/src/RUBiS-1.4.3/bench/2009-3-19@7:48:52//client0.bin > /home/drkp/sandbox/txcache/src/RUBiS-1.4.3/bench/2009-3-19@7:48:52//client0'
Command is: /usr/bin/scp farm6.csail.mit.edu:/tmp/trace_client1.html /home/drkp/sandbox/txcache/src/RUBiS-1.4.3/bench/2009-3-19@7:48:52//
Command is: /usr/bin/scp farm6.csail.mit.edu:/tmp/stat_client1.html /home/drkp/sandbox/txcache/src/RUBiS-1.4.3/bench/2009-3-19@7:48:52//
|
|
|
|
|
|
 | 
|
 | 
|
 | 
|
 | 
|
 | 
|
 | 
|
 | 
|
 | 
|
 | 
|