Node information
Test timing information
Up ramp statistics
Runtime session statistics
Down ramp statistics
Overall statistics
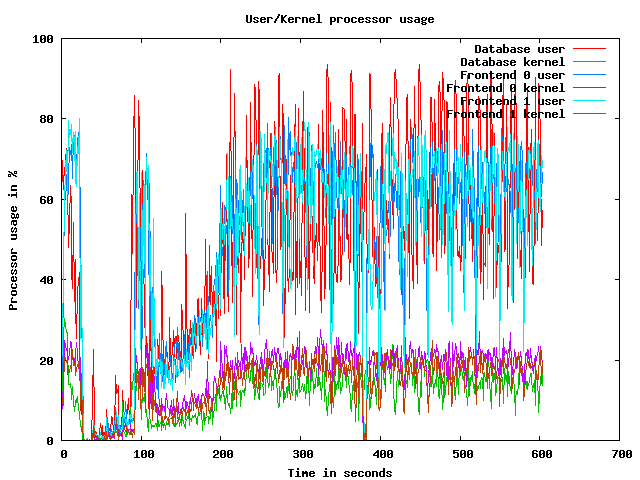
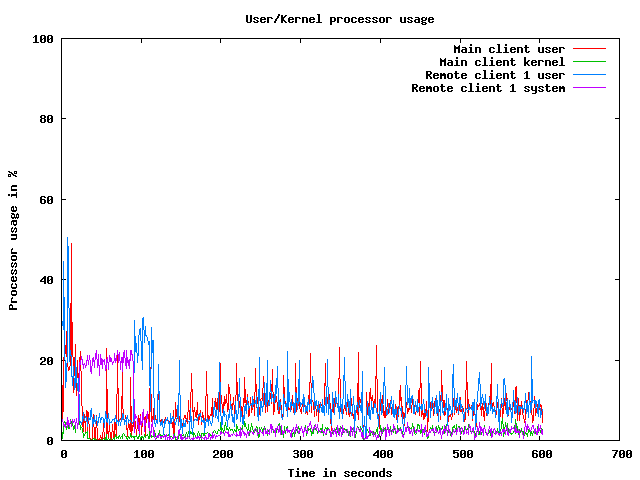
CPU usage graphs
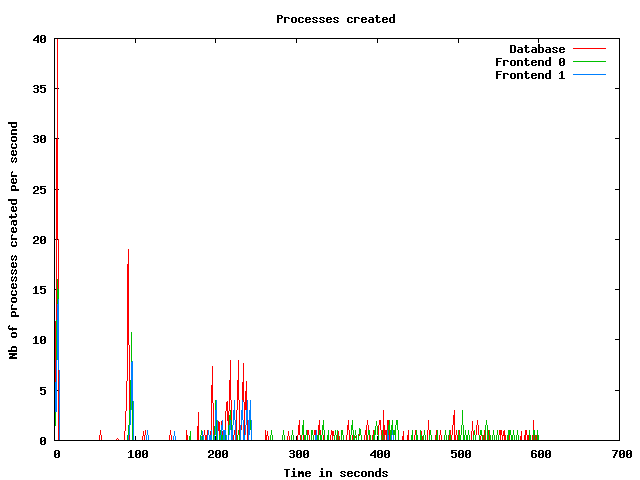
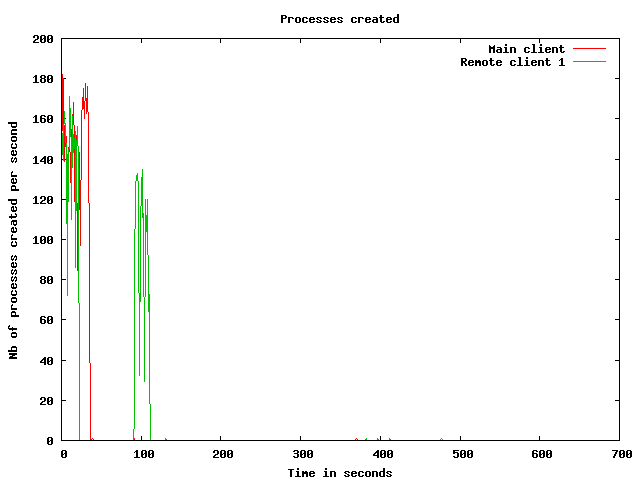
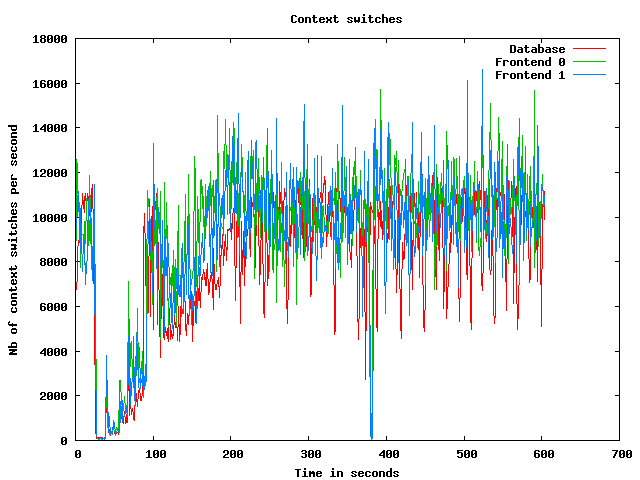
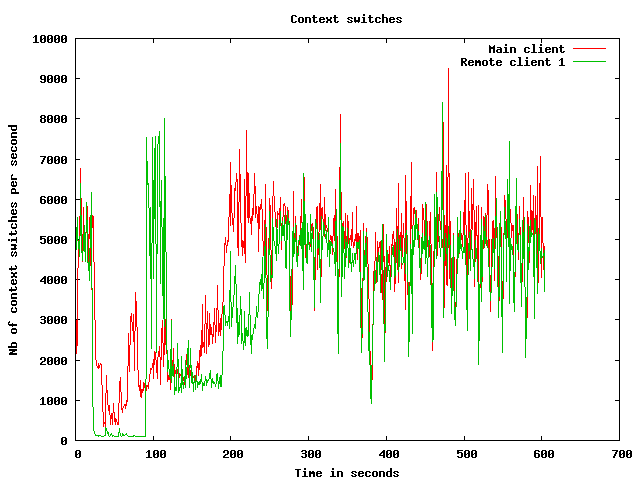
Processes usage graphs
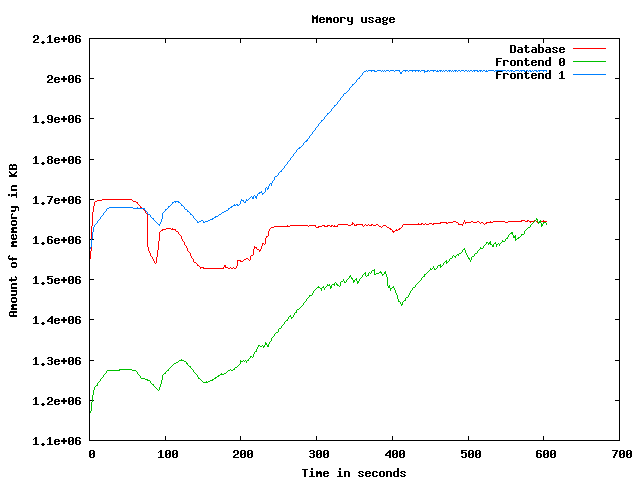
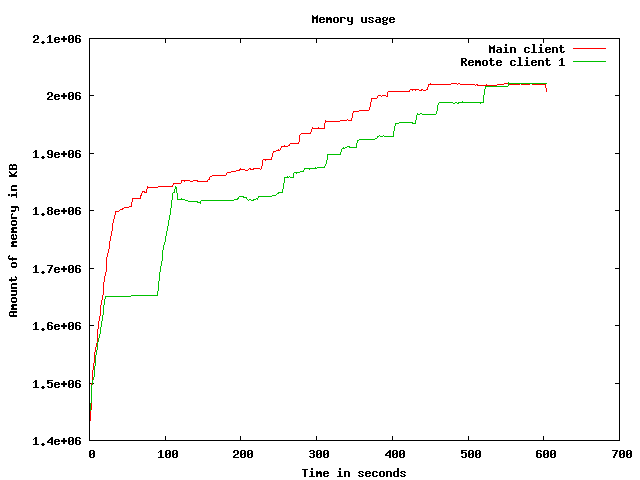
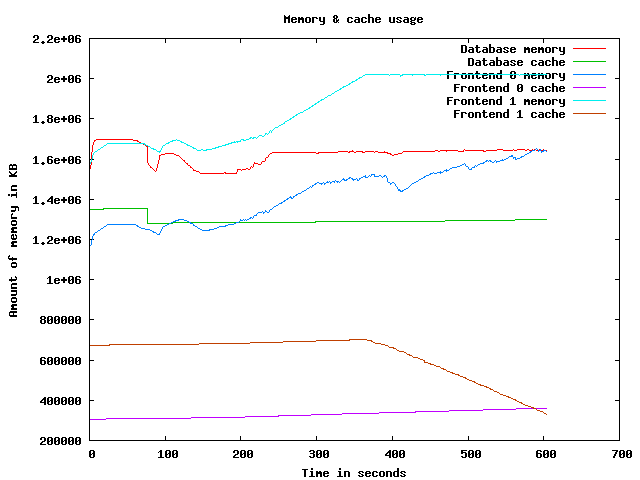
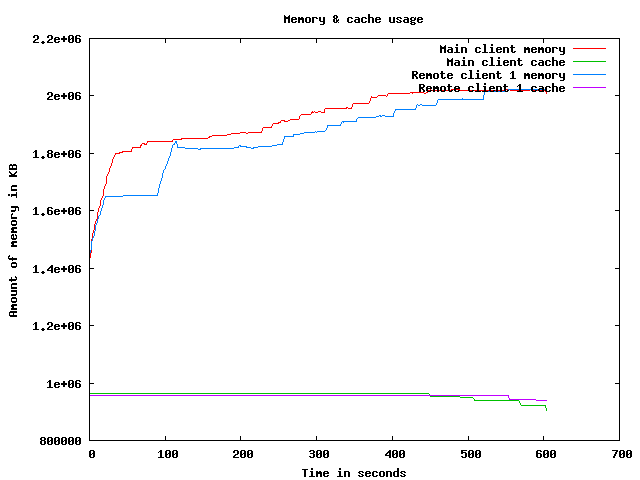
Memory usage graph
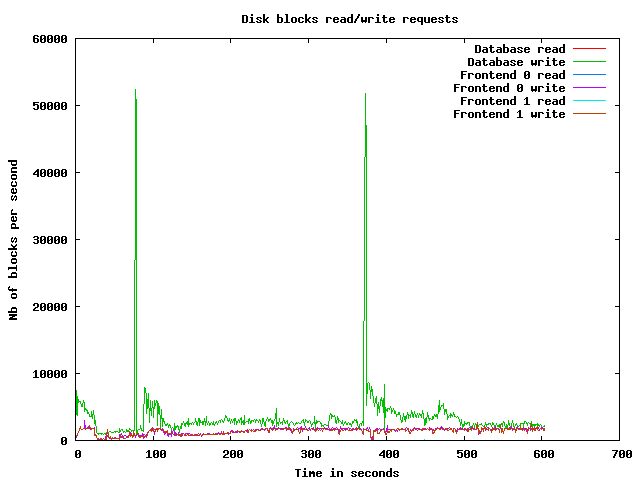
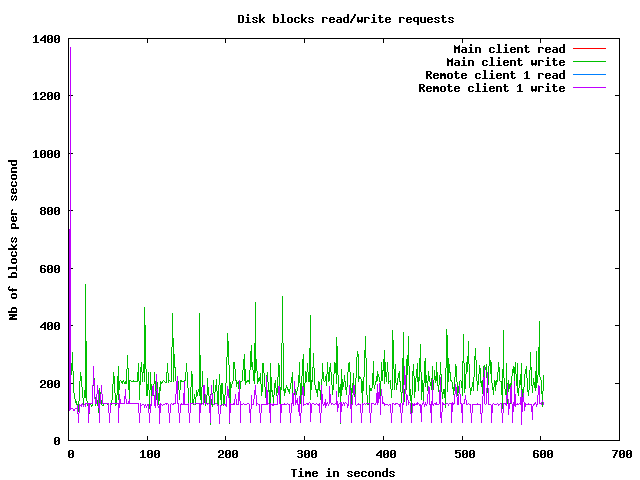
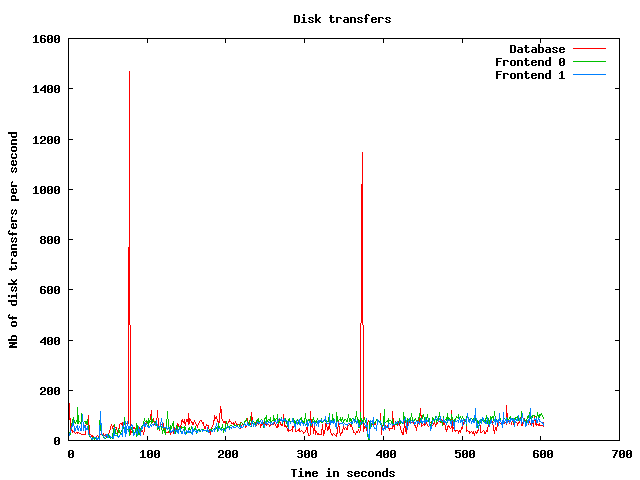
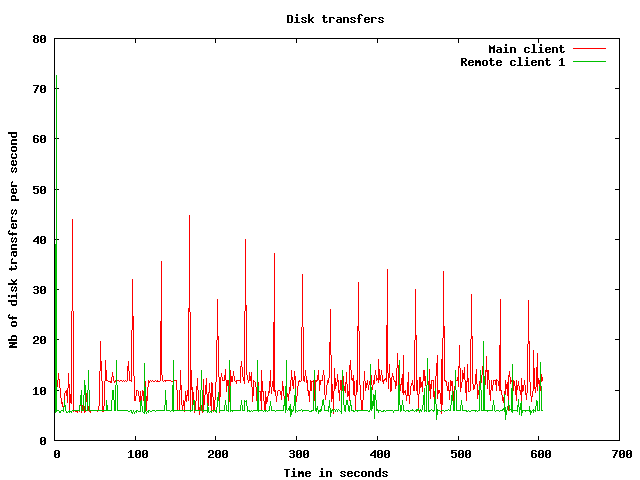
Disk usage graphs
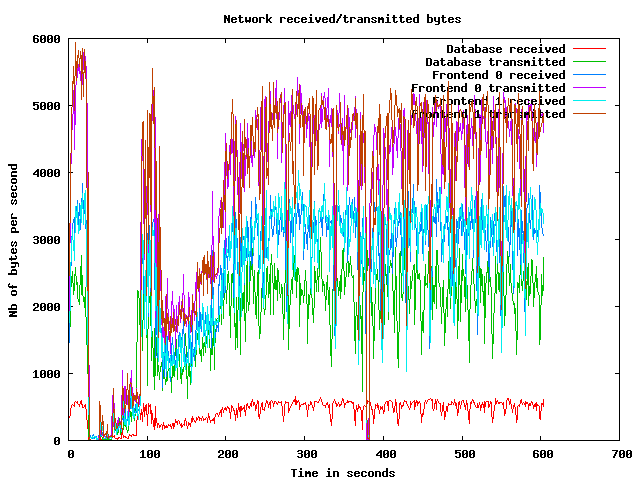
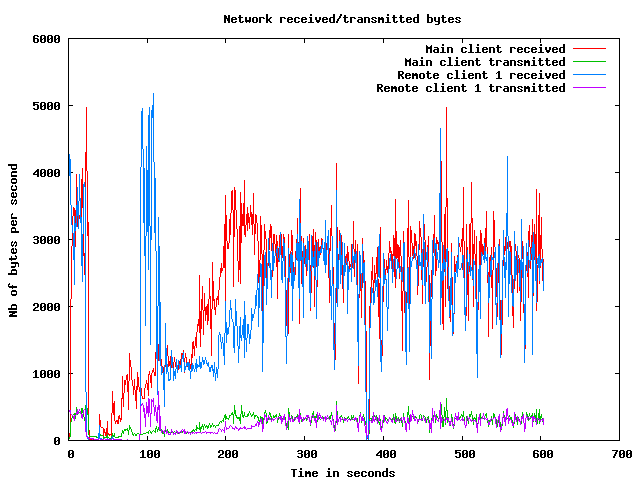
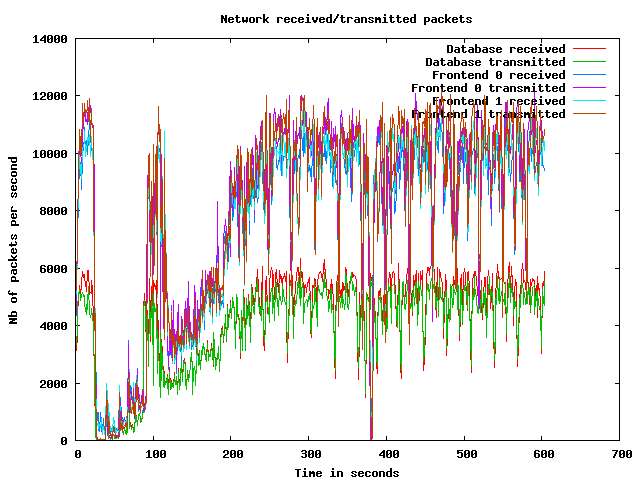
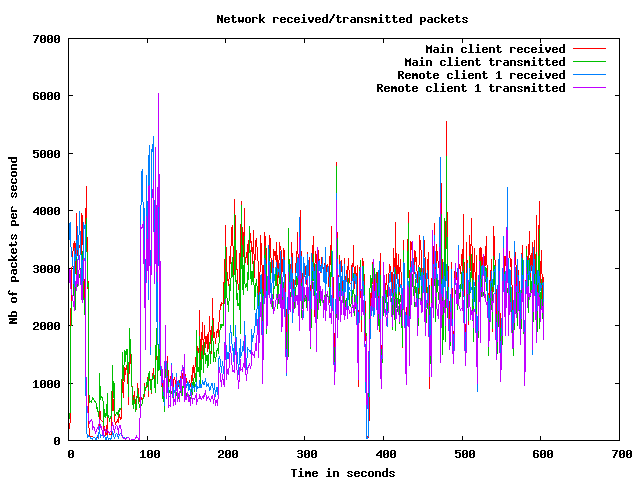
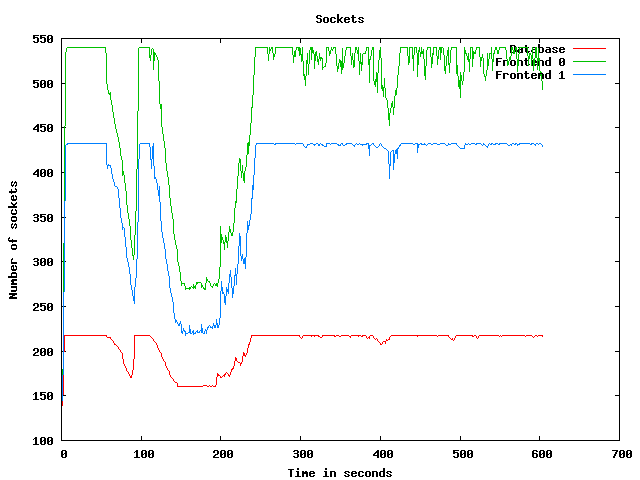
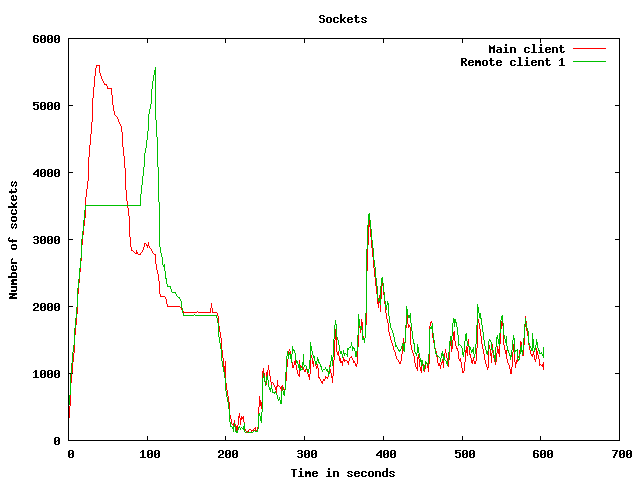
Network usage graphs
| Test start | 2009-3-19 8:2:42 |
| Up ramp start | 2009-3-19 8:3:19 |
| Runtime session start | 2009-3-19 8:5:19 |
| Down ramp start | 2009-3-19 8:12:49 |
| Test end | 2009-3-19 8:15:36 |
| Up ramp length | 2 minutes 0 millisecond (requested 120000 ms) |
| Runtime session length | 7 minutes 30 seconds 407 milliseconds (requested 450000 ms) |
| Down ramp length | 30 seconds 1 millisecond (requested 30000 ms) |
| Total test length | 12 minutes 54 seconds 221 milliseconds |
| State name | % of total | Count | Errors | Minimum Time | Maximum Time | Average Time |
|---|---|---|---|---|---|---|
Home | 12 % | 7007 | 0 | 0 ms | 142002 ms | 15520 ms
|
Register | 1 % | 808 | 0 | 0 ms | 97677 ms | 2862 ms
|
RegisterUser | 1 % | 722 | 32 | 4 ms | 107965 ms | 2298 ms
|
Browse | 10 % | 5963 | 0 | 0 ms | 119691 ms | 3295 ms
|
BrowseCategories | 7 % | 3858 | 0 | 3 ms | 129975 ms | 2123 ms
|
SearchItemsInCategory | 14 % | 7842 | 0 | 3 ms | 107417 ms | 2495 ms
|
BrowseRegions | 2 % | 1565 | 0 | 3 ms | 96359 ms | 1687 ms
|
BrowseCategoriesInRegion | 2 % | 1408 | 0 | 3 ms | 99832 ms | 2720 ms
|
SearchItemsInRegion | 4 % | 2559 | 0 | 0 ms | 106884 ms | 2035 ms
|
ViewItem | 11 % | 6287 | 0 | 3 ms | 106876 ms | 2411 ms
|
ViewUserInfo | 1 % | 1051 | 0 | 3 ms | 97867 ms | 2371 ms
|
ViewBidHistory | 0 % | 519 | 0 | 3 ms | 97087 ms | 2289 ms
|
BuyNowAuth | 0 % | 508 | 0 | 2 ms | 106901 ms | 3237 ms
|
BuyNow | 0 % | 424 | 62 | 4 ms | 129999 ms | 2260 ms
|
StoreBuyBow | 0 % | 293 | 0 | 5 ms | 95385 ms | 1329 ms
|
PutBidAuth | 3 % | 2014 | 0 | 0 ms | 129985 ms | 2130 ms
|
PutBid | 3 % | 1867 | 202 | 3 ms | 98351 ms | 1958 ms
|
StoreBid | 1 % | 1059 | 0 | 4 ms | 98318 ms | 3172 ms
|
PutCommentAuth | 0 % | 0 | 0 | 0 ms | 0 ms | 0 ms
|
PutComment | 0 % | 187 | 21 | 4 ms | 98293 ms | 1478 ms
|
StoreComment | 0 % | 137 | 0 | 5 ms | 98337 ms | 1668 ms
|
Sell | 0 % | 453 | 0 | 0 ms | 129936 ms | 2461 ms
|
SelectCategoryToSellItem | 0 % | 412 | 0 | 4 ms | 95850 ms | 2558 ms
|
SellItemForm | 0 % | 371 | 0 | 2 ms | 97202 ms | 2372 ms
|
RegisterItem | 0 % | 329 | 0 | 4 ms | 98389 ms | 4468 ms
|
AboutMe (auth form) | 2 % | 1324 | 0 | 0 ms | 129966 ms | 2811 ms
|
AboutMe | 3 % | 1660 | 0 | 4 ms | 98402 ms | 2495 ms
|
Back probability | 6 % | 3680 | 0 | 0 ms | 0 ms | 0 ms
|
End of Session | 0 % | 466 | 0 | 0 ms | 0 ms | 0 ms
|
Total | 100 % | 54773 | 317 | - | - | 3954 ms
|
Average throughput | 459 req/s
| |||||
Completed sessions | 424
| |||||
Total time | 19747 seconds
| |||||
Average session time | 46 seconds
| |||||
| State name | % of total | Count | Errors | Minimum Time | Maximum Time | Average Time |
|---|---|---|---|---|---|---|
Home | 4 % | 12875 | 0 | 0 ms | 216065 ms | 8681 ms
|
Register | 1 % | 3488 | 0 | 0 ms | 200215 ms | 2865 ms
|
RegisterUser | 1 % | 3434 | 175 | 4 ms | 213406 ms | 2583 ms
|
Browse | 7 % | 22664 | 0 | 0 ms | 200594 ms | 3127 ms
|
BrowseCategories | 4 % | 15850 | 0 | 3 ms | 285001 ms | 2764 ms
|
SearchItemsInCategory | 15 % | 49692 | 0 | 3 ms | 296899 ms | 2215 ms
|
BrowseRegions | 2 % | 6577 | 0 | 3 ms | 212816 ms | 2388 ms
|
BrowseCategoriesInRegion | 2 % | 6469 | 0 | 3 ms | 200501 ms | 2348 ms
|
SearchItemsInRegion | 5 % | 17014 | 0 | 0 ms | 201164 ms | 2060 ms
|
ViewItem | 14 % | 45466 | 0 | 3 ms | 227113 ms | 2086 ms
|
ViewUserInfo | 3 % | 10296 | 0 | 3 ms | 201529 ms | 1730 ms
|
ViewBidHistory | 1 % | 5594 | 0 | 3 ms | 214786 ms | 2411 ms
|
BuyNowAuth | 1 % | 4360 | 0 | 2 ms | 212063 ms | 1853 ms
|
BuyNow | 1 % | 4284 | 537 | 4 ms | 193737 ms | 1678 ms
|
StoreBuyBow | 1 % | 3644 | 4 | 5 ms | 287203 ms | 1782 ms
|
PutBidAuth | 4 % | 15867 | 0 | 0 ms | 287234 ms | 1866 ms
|
PutBid | 5 % | 18295 | 1786 | 4 ms | 227107 ms | 1904 ms
|
StoreBid | 3 % | 12131 | 5 | 4 ms | 212865 ms | 1685 ms
|
PutCommentAuth | 0 % | 0 | 0 | 0 ms | 0 ms | 0 ms
|
PutComment | 0 % | 1570 | 94 | 4 ms | 190933 ms | 2194 ms
|
StoreComment | 0 % | 1451 | 0 | 5 ms | 191494 ms | 1924 ms
|
Sell | 0 % | 1853 | 0 | 0 ms | 194435 ms | 3146 ms
|
SelectCategoryToSellItem | 0 % | 1826 | 0 | 4 ms | 194245 ms | 2386 ms
|
SellItemForm | 0 % | 1791 | 0 | 2 ms | 201500 ms | 2506 ms
|
RegisterItem | 0 % | 1749 | 0 | 4 ms | 194076 ms | 1778 ms
|
AboutMe (auth form) | 1 % | 5331 | 0 | 0 ms | 193835 ms | 3662 ms
|
AboutMe | 2 % | 9138 | 0 | 4 ms | 201582 ms | 2609 ms
|
Back probability | 10 % | 33782 | 0 | 0 ms | 0 ms | 0 ms
|
End of Session | 1 % | 4751 | 0 | 0 ms | 0 ms | 0 ms
|
Total | 100 % | 321242 | 2601 | - | - | 2228 ms
|
Average throughput | 719 req/s
| |||||
Completed sessions | 4712
| |||||
Total time | 1281177 seconds
| |||||
Average session time | 271 seconds
| |||||
| State name | % of total | Count | Errors | Minimum Time | Maximum Time | Average Time |
|---|---|---|---|---|---|---|
Home | 3 % | 454 | 0 | 0 ms | 93559 ms | 1639 ms
|
Register | 1 % | 140 | 0 | 0 ms | 92996 ms | 1825 ms
|
RegisterUser | 1 % | 127 | 12 | 6 ms | 46178 ms | 1970 ms
|
Browse | 6 % | 831 | 0 | 0 ms | 236162 ms | 4636 ms
|
BrowseCategories | 4 % | 583 | 0 | 3 ms | 235883 ms | 3813 ms
|
SearchItemsInCategory | 15 % | 1937 | 0 | 3 ms | 235799 ms | 2789 ms
|
BrowseRegions | 2 % | 272 | 0 | 3 ms | 93504 ms | 2399 ms
|
BrowseCategoriesInRegion | 2 % | 279 | 0 | 4 ms | 190008 ms | 2210 ms
|
SearchItemsInRegion | 5 % | 689 | 0 | 0 ms | 235807 ms | 3728 ms
|
ViewItem | 14 % | 1853 | 0 | 3 ms | 236200 ms | 4178 ms
|
ViewUserInfo | 3 % | 406 | 0 | 3 ms | 93530 ms | 2491 ms
|
ViewBidHistory | 1 % | 190 | 0 | 3 ms | 236067 ms | 4741 ms
|
BuyNowAuth | 1 % | 164 | 0 | 2 ms | 45091 ms | 1805 ms
|
BuyNow | 1 % | 163 | 20 | 5 ms | 235785 ms | 4793 ms
|
StoreBuyBow | 1 % | 151 | 0 | 5 ms | 93001 ms | 2506 ms
|
PutBidAuth | 5 % | 632 | 0 | 1 ms | 235783 ms | 3290 ms
|
PutBid | 5 % | 688 | 49 | 5 ms | 235883 ms | 3969 ms
|
StoreBid | 3 % | 465 | 2 | 6 ms | 235712 ms | 2945 ms
|
PutCommentAuth | 0 % | 0 | 0 | 0 ms | 0 ms | 0 ms
|
PutComment | 0 % | 53 | 6 | 6 ms | 45034 ms | 2769 ms
|
StoreComment | 0 % | 45 | 0 | 5 ms | 46450 ms | 4599 ms
|
Sell | 0 % | 88 | 0 | 0 ms | 235834 ms | 4301 ms
|
SelectCategoryToSellItem | 0 % | 67 | 0 | 6 ms | 193005 ms | 3884 ms
|
SellItemForm | 0 % | 69 | 0 | 2 ms | 45260 ms | 2244 ms
|
RegisterItem | 0 % | 67 | 0 | 5 ms | 190029 ms | 4854 ms
|
AboutMe (auth form) | 1 % | 220 | 0 | 0 ms | 235787 ms | 6523 ms
|
AboutMe | 2 % | 334 | 0 | 7 ms | 190093 ms | 5323 ms
|
Back probability | 11 % | 1390 | 0 | 0 ms | 0 ms | 0 ms
|
End of Session | 1 % | 188 | 0 | 0 ms | 0 ms | 0 ms
|
Total | 100 % | 12545 | 89 | - | - | 3050 ms
|
Average throughput | 421 req/s
| |||||
Completed sessions | 170
| |||||
Total time | 63250 seconds
| |||||
Average session time | 372 seconds
| |||||
| State name | % of total | Count | Errors | Minimum Time | Maximum Time | Average Time |
|---|---|---|---|---|---|---|
Home | 5 % | 20340 | 0 | 0 ms | 380020 ms | 10971 ms
|
Register | 1 % | 4441 | 0 | 0 ms | 380016 ms | 2978 ms
|
RegisterUser | 1 % | 4286 | 219 | 4 ms | 213406 ms | 2604 ms
|
Browse | 7 % | 29478 | 0 | 0 ms | 236162 ms | 3371 ms
|
BrowseCategories | 5 % | 20309 | 0 | 3 ms | 380069 ms | 2763 ms
|
SearchItemsInCategory | 15 % | 59778 | 0 | 3 ms | 380130 ms | 2378 ms
|
BrowseRegions | 2 % | 8427 | 0 | 3 ms | 212816 ms | 2378 ms
|
BrowseCategoriesInRegion | 2 % | 8163 | 0 | 3 ms | 200501 ms | 2509 ms
|
SearchItemsInRegion | 5 % | 20362 | 0 | 0 ms | 380040 ms | 2238 ms
|
ViewItem | 13 % | 53776 | 0 | 3 ms | 380063 ms | 2325 ms
|
ViewUserInfo | 3 % | 11801 | 0 | 3 ms | 380027 ms | 2087 ms
|
ViewBidHistory | 1 % | 6333 | 0 | 3 ms | 380224 ms | 2625 ms
|
BuyNowAuth | 1 % | 5033 | 0 | 2 ms | 380021 ms | 2169 ms
|
BuyNow | 1 % | 4876 | 619 | 4 ms | 235785 ms | 1947 ms
|
StoreBuyBow | 1 % | 4091 | 4 | 5 ms | 287203 ms | 1913 ms
|
PutBidAuth | 4 % | 18534 | 0 | 0 ms | 379997 ms | 2090 ms
|
PutBid | 5 % | 20928 | 2039 | 3 ms | 380019 ms | 2101 ms
|
StoreBid | 3 % | 13662 | 7 | 4 ms | 235712 ms | 1991 ms
|
PutCommentAuth | 0 % | 0 | 0 | 0 ms | 0 ms | 0 ms
|
PutComment | 0 % | 1812 | 122 | 4 ms | 190933 ms | 2186 ms
|
StoreComment | 0 % | 1633 | 0 | 5 ms | 191494 ms | 2033 ms
|
Sell | 0 % | 2394 | 0 | 0 ms | 235834 ms | 3138 ms
|
SelectCategoryToSellItem | 0 % | 2306 | 0 | 4 ms | 194245 ms | 2459 ms
|
SellItemForm | 0 % | 2231 | 0 | 2 ms | 201500 ms | 2517 ms
|
RegisterItem | 0 % | 2146 | 0 | 4 ms | 194076 ms | 2286 ms
|
AboutMe (auth form) | 1 % | 6886 | 0 | 0 ms | 235787 ms | 3693 ms
|
AboutMe | 2 % | 11213 | 0 | 4 ms | 201582 ms | 2878 ms
|
Back probability | 9 % | 38894 | 0 | 0 ms | 0 ms | 0 ms
|
End of Session | 1 % | 5409 | 0 | 0 ms | 0 ms | 0 ms
|
Total | 100 % | 389542 | 3010 | - | - | 2609 ms
|
Average throughput | 653 req/s
| |||||
Completed sessions | 5409
| |||||
Total time | 1406559 seconds
| |||||
Average session time | 260 seconds
| |||||
An error occured while waiting for remote processes termination (Skipping waits)
Command is: /usr/bin/scp farm6.csail.mit.edu:/tmp/client1 /home/drkp/sandbox/txcache/src/RUBiS-1.4.3/bench/2009-3-19@8:2:42//client1.bin
Command is: /usr/bin/ssh -x localhost /bin/bash -c 'LANG=en_GB.UTF-8 /usr/bin/sar -n DEV -n SOCK -rubcw 1 605 -f /home/drkp/sandbox/txcache/src/RUBiS-1.4.3/bench/2009-3-19@8:2:42//client1.bin > /home/drkp/sandbox/txcache/src/RUBiS-1.4.3/bench/2009-3-19@8:2:42//client1'
Command is: /usr/bin/scp farm14:/tmp/db_server0 /home/drkp/sandbox/txcache/src/RUBiS-1.4.3/bench/2009-3-19@8:2:42//db_server0.bin
Command is: /usr/bin/ssh -x localhost /bin/bash -c 'LANG=en_GB.UTF-8 /usr/bin/sar -n DEV -n SOCK -rubcw 1 605 -f /home/drkp/sandbox/txcache/src/RUBiS-1.4.3/bench/2009-3-19@8:2:42//db_server0.bin > /home/drkp/sandbox/txcache/src/RUBiS-1.4.3/bench/2009-3-19@8:2:42//db_server0'
Command is: /usr/bin/scp farm12.csail.mit.edu:/tmp/web_server0 /home/drkp/sandbox/txcache/src/RUBiS-1.4.3/bench/2009-3-19@8:2:42//web_server0.bin
Command is: /usr/bin/ssh -x localhost /bin/bash -c 'LANG=en_GB.UTF-8 /usr/bin/sar -n DEV -n SOCK -rubcw 1 605 -f /home/drkp/sandbox/txcache/src/RUBiS-1.4.3/bench/2009-3-19@8:2:42//web_server0.bin > /home/drkp/sandbox/txcache/src/RUBiS-1.4.3/bench/2009-3-19@8:2:42//web_server0'
Command is: /usr/bin/scp farm13.csail.mit.edu:/tmp/web_server1 /home/drkp/sandbox/txcache/src/RUBiS-1.4.3/bench/2009-3-19@8:2:42//web_server1.bin
Command is: /usr/bin/ssh -x localhost /bin/bash -c 'LANG=en_GB.UTF-8 /usr/bin/sar -n DEV -n SOCK -rubcw 1 605 -f /home/drkp/sandbox/txcache/src/RUBiS-1.4.3/bench/2009-3-19@8:2:42//web_server1.bin > /home/drkp/sandbox/txcache/src/RUBiS-1.4.3/bench/2009-3-19@8:2:42//web_server1'
Command is: /usr/bin/scp localhost:/tmp/client0 /home/drkp/sandbox/txcache/src/RUBiS-1.4.3/bench/2009-3-19@8:2:42//client0.bin
Command is: /usr/bin/ssh -x localhost /bin/bash -c 'LANG=en_GB.UTF-8 /usr/bin/sar -n DEV -n SOCK -rubcw 1 605 -f /home/drkp/sandbox/txcache/src/RUBiS-1.4.3/bench/2009-3-19@8:2:42//client0.bin > /home/drkp/sandbox/txcache/src/RUBiS-1.4.3/bench/2009-3-19@8:2:42//client0'
Command is: /usr/bin/scp farm6.csail.mit.edu:/tmp/trace_client1.html /home/drkp/sandbox/txcache/src/RUBiS-1.4.3/bench/2009-3-19@8:2:42//
Command is: /usr/bin/scp farm6.csail.mit.edu:/tmp/stat_client1.html /home/drkp/sandbox/txcache/src/RUBiS-1.4.3/bench/2009-3-19@8:2:42//
|
|
|
|
|
|
 | 
|
 | 
|
 | 
|
 | 
|
 | 
|
 | 
|
 | 
|
 | 
|
 | 
|