Node information
Test timing information
Up ramp statistics
Runtime session statistics
Down ramp statistics
Overall statistics
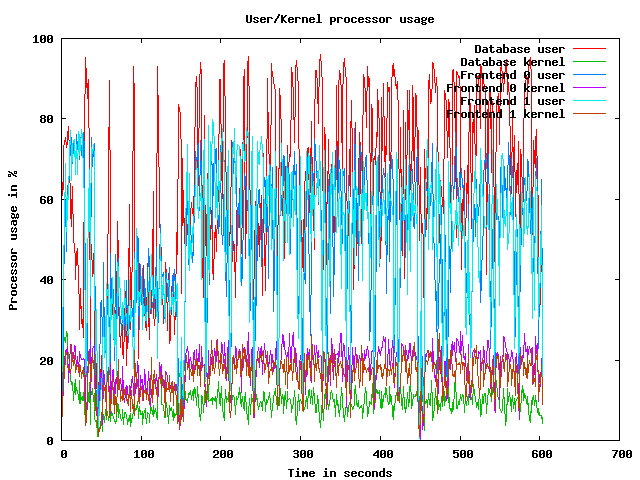
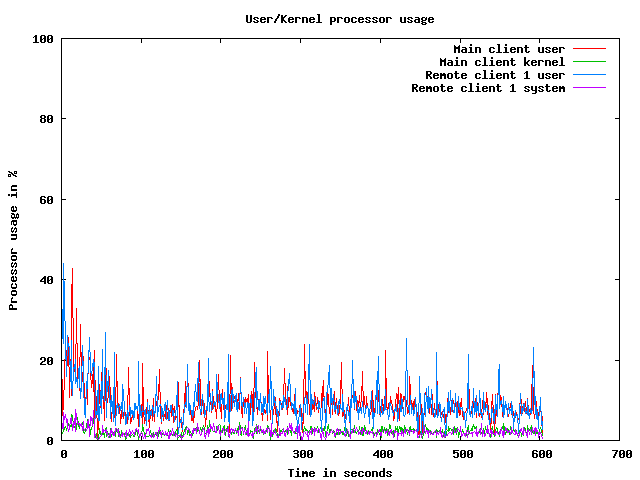
CPU usage graphs
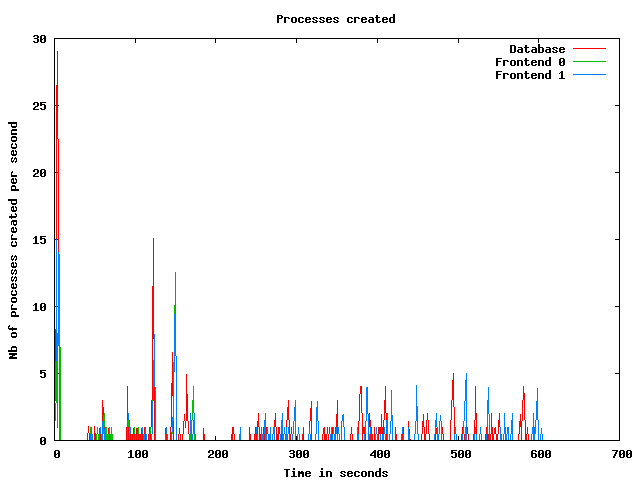
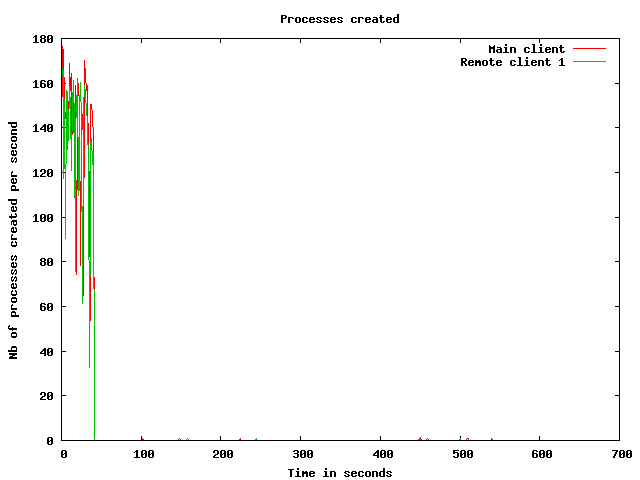
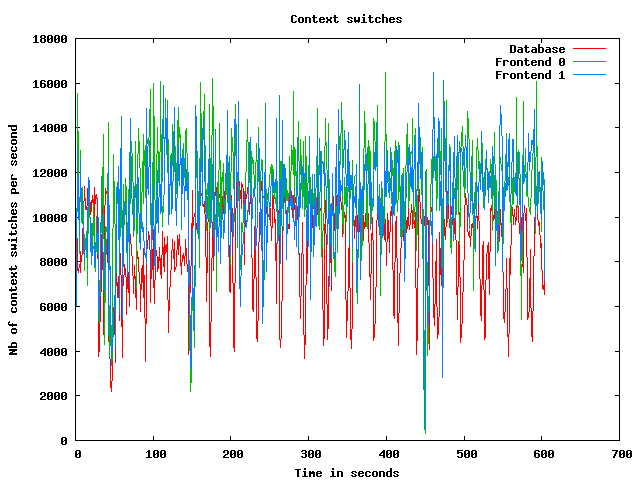
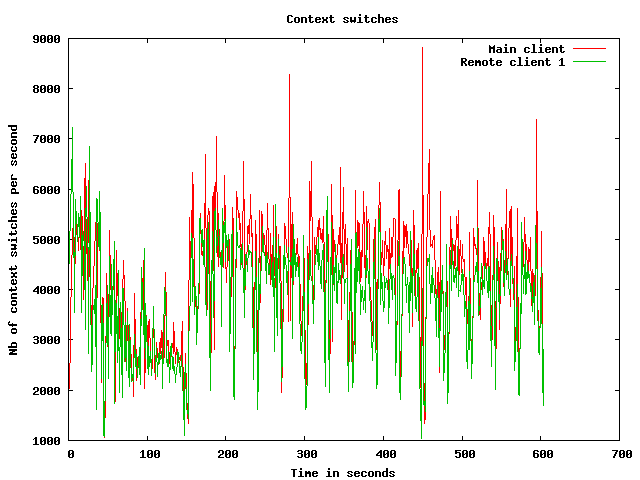
Processes usage graphs
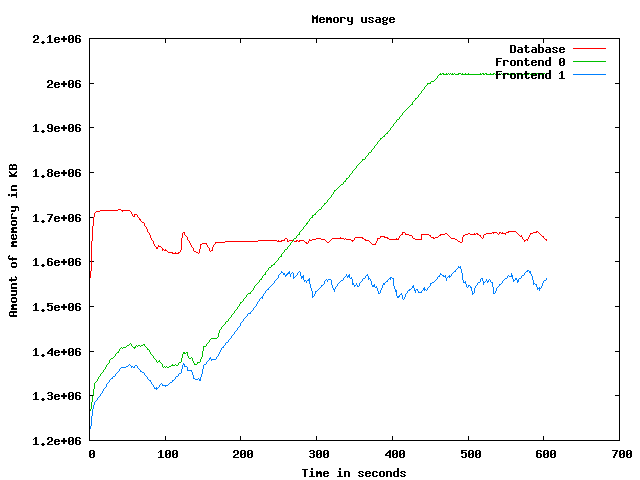
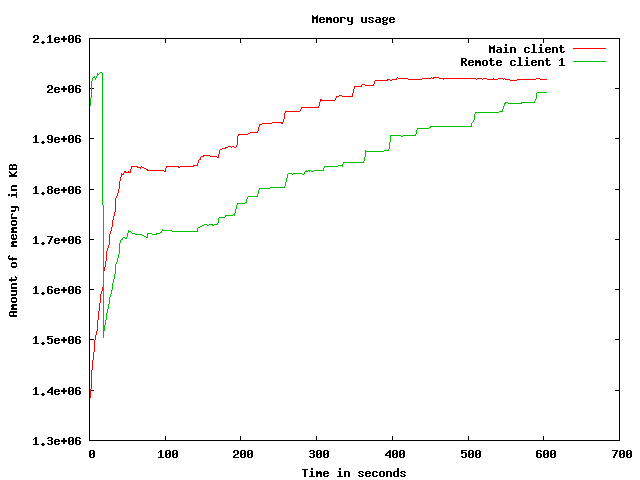
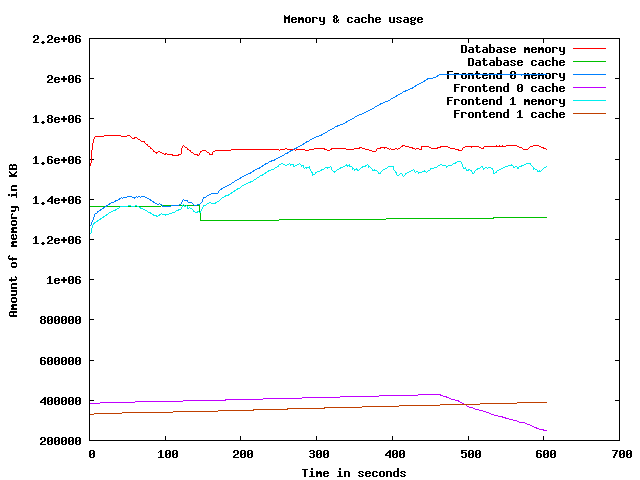
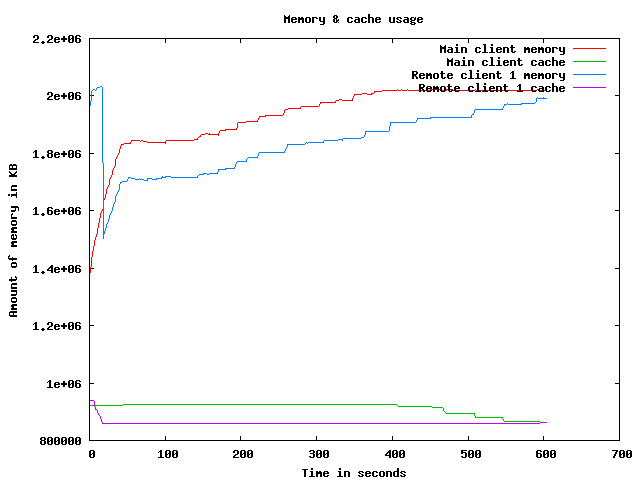
Memory usage graph
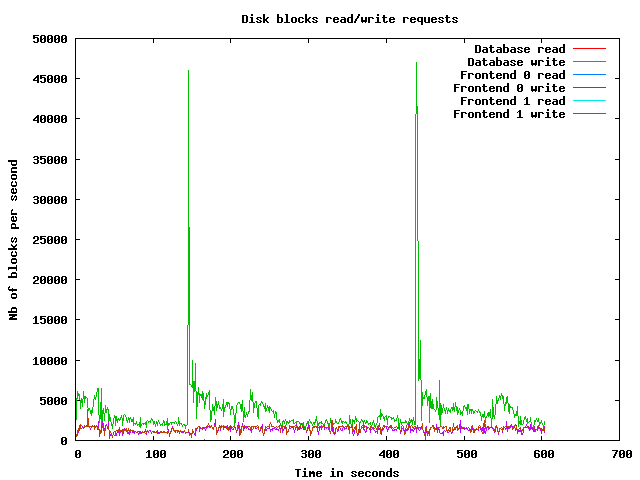
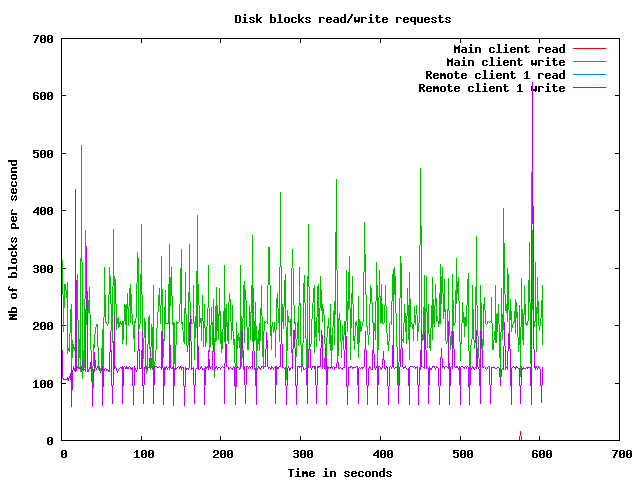
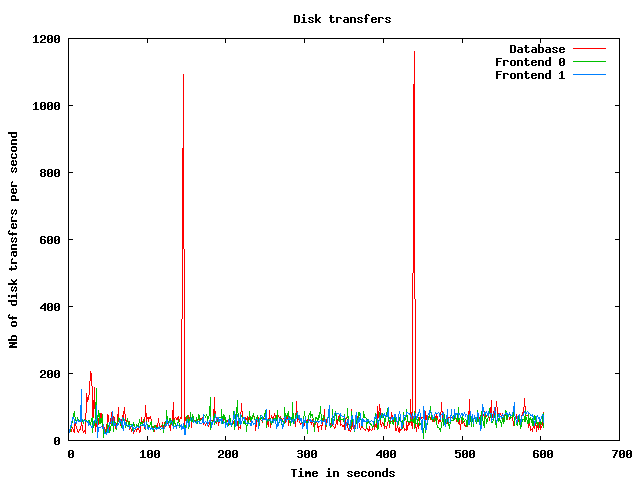
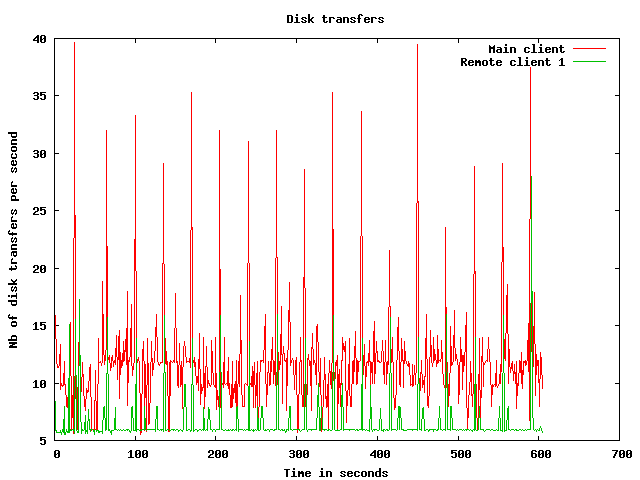
Disk usage graphs
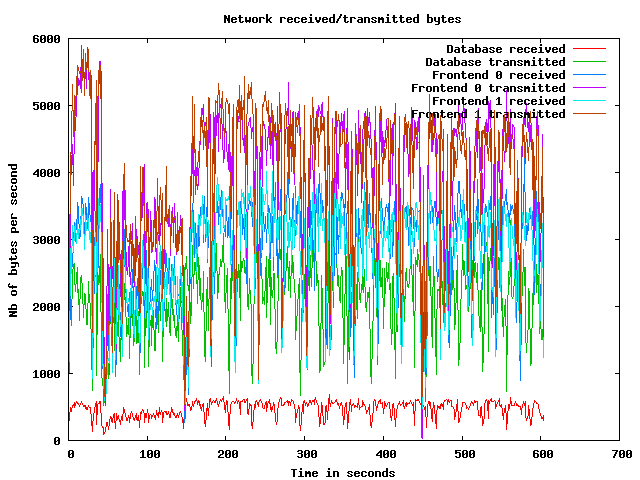
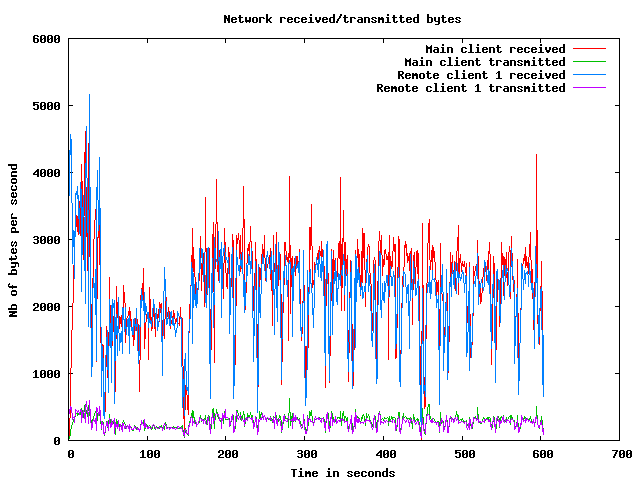
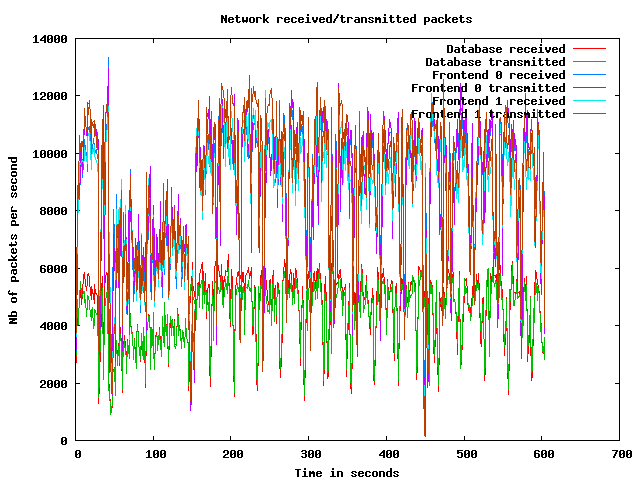
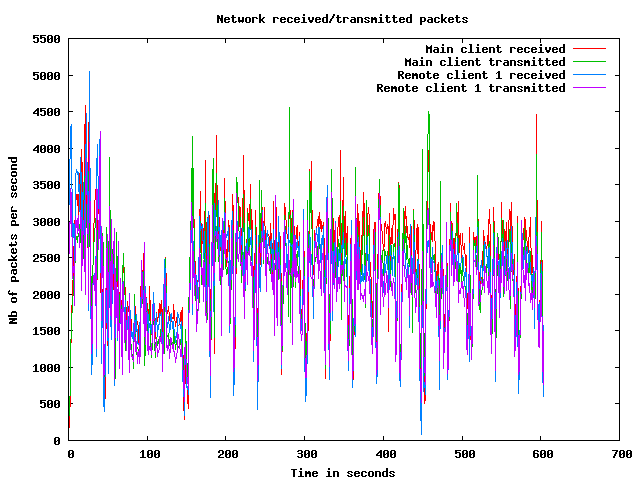
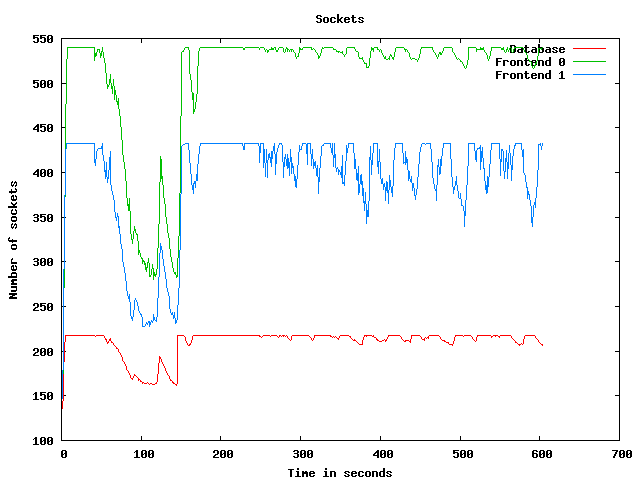
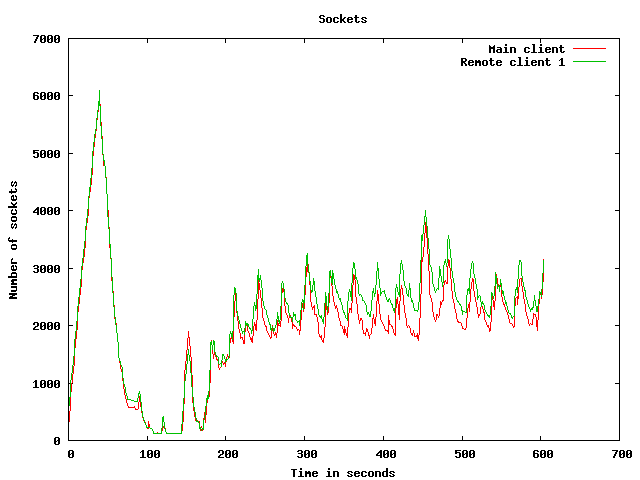
Network usage graphs
| Test start | 2009-3-19 8:16:33 |
| Up ramp start | 2009-3-19 8:17:16 |
| Runtime session start | 2009-3-19 8:19:16 |
| Down ramp start | 2009-3-19 8:26:46 |
| Test end | 2009-3-19 8:29:41 |
| Up ramp length | 2 minutes 1 millisecond (requested 120000 ms) |
| Runtime session length | 7 minutes 30 seconds 30 milliseconds (requested 450000 ms) |
| Down ramp length | 30 seconds 0 millisecond (requested 30000 ms) |
| Total test length | 13 minutes 7 seconds 72 milliseconds |
| State name | % of total | Count | Errors | Minimum Time | Maximum Time | Average Time |
|---|---|---|---|---|---|---|
Home | 9 % | 8896 | 0 | 0 ms | 93229 ms | 8214 ms
|
Register | 1 % | 1283 | 0 | 0 ms | 93244 ms | 3514 ms
|
RegisterUser | 1 % | 1203 | 64 | 4 ms | 93115 ms | 2536 ms
|
Browse | 9 % | 9100 | 0 | 0 ms | 93231 ms | 3240 ms
|
BrowseCategories | 6 % | 6045 | 0 | 3 ms | 93074 ms | 2448 ms
|
SearchItemsInCategory | 14 % | 13661 | 0 | 3 ms | 93248 ms | 1947 ms
|
BrowseRegions | 2 % | 2507 | 0 | 3 ms | 93028 ms | 2430 ms
|
BrowseCategoriesInRegion | 2 % | 2318 | 0 | 3 ms | 93084 ms | 2157 ms
|
SearchItemsInRegion | 5 % | 4680 | 0 | 0 ms | 93073 ms | 1928 ms
|
ViewItem | 12 % | 11670 | 0 | 3 ms | 93105 ms | 1995 ms
|
ViewUserInfo | 2 % | 2056 | 0 | 3 ms | 93071 ms | 1527 ms
|
ViewBidHistory | 1 % | 1130 | 0 | 3 ms | 93329 ms | 2300 ms
|
BuyNowAuth | 1 % | 1016 | 0 | 2 ms | 46392 ms | 1418 ms
|
BuyNow | 0 % | 906 | 106 | 4 ms | 93036 ms | 1445 ms
|
StoreBuyBow | 0 % | 683 | 0 | 5 ms | 93007 ms | 1854 ms
|
PutBidAuth | 4 % | 3972 | 0 | 0 ms | 93008 ms | 1751 ms
|
PutBid | 4 % | 3902 | 405 | 3 ms | 93074 ms | 1712 ms
|
StoreBid | 2 % | 2327 | 1 | 5 ms | 93091 ms | 1936 ms
|
PutCommentAuth | 0 % | 0 | 0 | 0 ms | 0 ms | 0 ms
|
PutComment | 0 % | 370 | 31 | 4 ms | 45128 ms | 1199 ms
|
StoreComment | 0 % | 294 | 1 | 5 ms | 45150 ms | 1535 ms
|
Sell | 0 % | 688 | 0 | 0 ms | 93006 ms | 3474 ms
|
SelectCategoryToSellItem | 0 % | 651 | 0 | 4 ms | 93019 ms | 2146 ms
|
SellItemForm | 0 % | 604 | 0 | 2 ms | 93037 ms | 2561 ms
|
RegisterItem | 0 % | 560 | 0 | 4 ms | 93027 ms | 1523 ms
|
AboutMe (auth form) | 2 % | 1955 | 0 | 0 ms | 93013 ms | 3242 ms
|
AboutMe | 2 % | 2737 | 0 | 4 ms | 93160 ms | 2439 ms
|
Back probability | 7 % | 7311 | 0 | 0 ms | 0 ms | 0 ms
|
End of Session | 1 % | 995 | 0 | 0 ms | 0 ms | 0 ms
|
Total | 100 % | 93520 | 608 | - | - | 2580 ms
|
Average throughput | 784 req/s
| |||||
Completed sessions | 912
| |||||
Total time | 54878 seconds
| |||||
Average session time | 60 seconds
| |||||
| State name | % of total | Count | Errors | Minimum Time | Maximum Time | Average Time |
|---|---|---|---|---|---|---|
Home | 3 % | 11397 | 0 | 0 ms | 384800 ms | 1413 ms
|
Register | 1 % | 3016 | 0 | 0 ms | 199750 ms | 2790 ms
|
RegisterUser | 1 % | 2965 | 208 | 5 ms | 231914 ms | 2555 ms
|
Browse | 6 % | 20307 | 0 | 0 ms | 384794 ms | 2934 ms
|
BrowseCategories | 4 % | 14175 | 0 | 3 ms | 416962 ms | 2791 ms
|
SearchItemsInCategory | 15 % | 44869 | 0 | 3 ms | 380605 ms | 2920 ms
|
BrowseRegions | 2 % | 5880 | 0 | 3 ms | 211944 ms | 2782 ms
|
BrowseCategoriesInRegion | 1 % | 5801 | 0 | 3 ms | 380029 ms | 3010 ms
|
SearchItemsInRegion | 5 % | 15114 | 0 | 0 ms | 380014 ms | 2907 ms
|
ViewItem | 14 % | 41343 | 0 | 3 ms | 384822 ms | 3061 ms
|
ViewUserInfo | 3 % | 9841 | 0 | 3 ms | 239311 ms | 2611 ms
|
ViewBidHistory | 1 % | 5347 | 0 | 4 ms | 206987 ms | 3465 ms
|
BuyNowAuth | 1 % | 3931 | 0 | 2 ms | 236262 ms | 2893 ms
|
BuyNow | 1 % | 3872 | 430 | 4 ms | 201256 ms | 2684 ms
|
StoreBuyBow | 1 % | 3399 | 0 | 5 ms | 380014 ms | 2860 ms
|
PutBidAuth | 4 % | 14435 | 0 | 0 ms | 284630 ms | 3053 ms
|
PutBid | 5 % | 16880 | 1509 | 4 ms | 284393 ms | 2857 ms
|
StoreBid | 3 % | 11378 | 9 | 5 ms | 380016 ms | 3015 ms
|
PutCommentAuth | 0 % | 0 | 0 | 0 ms | 0 ms | 0 ms
|
PutComment | 0 % | 1472 | 96 | 5 ms | 249928 ms | 2846 ms
|
StoreComment | 0 % | 1362 | 0 | 5 ms | 203045 ms | 2404 ms
|
Sell | 0 % | 1600 | 0 | 0 ms | 193569 ms | 2756 ms
|
SelectCategoryToSellItem | 0 % | 1561 | 0 | 4 ms | 222926 ms | 3638 ms
|
SellItemForm | 0 % | 1538 | 0 | 2 ms | 380017 ms | 2861 ms
|
RegisterItem | 0 % | 1507 | 0 | 4 ms | 212018 ms | 3418 ms
|
AboutMe (auth form) | 1 % | 4817 | 0 | 0 ms | 227596 ms | 2578 ms
|
AboutMe | 2 % | 8248 | 0 | 5 ms | 380273 ms | 3133 ms
|
Back probability | 10 % | 31129 | 0 | 0 ms | 0 ms | 0 ms
|
End of Session | 1 % | 4315 | 0 | 0 ms | 0 ms | 0 ms
|
Total | 100 % | 291499 | 2252 | - | - | 2499 ms
|
Average throughput | 652 req/s
| |||||
Completed sessions | 4340
| |||||
Total time | 1189554 seconds
| |||||
Average session time | 274 seconds
| |||||
| State name | % of total | Count | Errors | Minimum Time | Maximum Time | Average Time |
|---|---|---|---|---|---|---|
Home | 3 % | 424 | 0 | 0 ms | 379998 ms | 7979 ms
|
Register | 1 % | 131 | 0 | 0 ms | 380517 ms | 9818 ms
|
RegisterUser | 1 % | 127 | 8 | 5 ms | 380004 ms | 12373 ms
|
Browse | 6 % | 795 | 0 | 0 ms | 380004 ms | 13492 ms
|
BrowseCategories | 4 % | 550 | 0 | 3 ms | 380048 ms | 12097 ms
|
SearchItemsInCategory | 14 % | 1728 | 0 | 3 ms | 425030 ms | 11935 ms
|
BrowseRegions | 2 % | 232 | 0 | 3 ms | 425041 ms | 10514 ms
|
BrowseCategoriesInRegion | 1 % | 230 | 0 | 3 ms | 255105 ms | 10722 ms
|
SearchItemsInRegion | 5 % | 610 | 0 | 0 ms | 425071 ms | 11890 ms
|
ViewItem | 14 % | 1643 | 0 | 3 ms | 445119 ms | 10023 ms
|
ViewUserInfo | 3 % | 387 | 0 | 3 ms | 425028 ms | 12412 ms
|
ViewBidHistory | 1 % | 219 | 0 | 3 ms | 425059 ms | 11917 ms
|
BuyNowAuth | 1 % | 157 | 0 | 2 ms | 238354 ms | 8522 ms
|
BuyNow | 1 % | 155 | 20 | 3 ms | 193551 ms | 14938 ms
|
StoreBuyBow | 1 % | 146 | 0 | 5 ms | 190179 ms | 9702 ms
|
PutBidAuth | 5 % | 601 | 0 | 0 ms | 199129 ms | 10228 ms
|
PutBid | 5 % | 667 | 53 | 4 ms | 425047 ms | 10808 ms
|
StoreBid | 3 % | 431 | 0 | 5 ms | 238374 ms | 11027 ms
|
PutCommentAuth | 0 % | 0 | 0 | 0 ms | 0 ms | 0 ms
|
PutComment | 0 % | 58 | 6 | 4 ms | 190017 ms | 17186 ms
|
StoreComment | 0 % | 48 | 0 | 5 ms | 190025 ms | 7761 ms
|
Sell | 0 % | 59 | 0 | 0 ms | 190095 ms | 17104 ms
|
SelectCategoryToSellItem | 0 % | 62 | 0 | 4 ms | 380012 ms | 14386 ms
|
SellItemForm | 0 % | 57 | 0 | 2 ms | 190023 ms | 8719 ms
|
RegisterItem | 0 % | 66 | 0 | 4 ms | 93003 ms | 6365 ms
|
AboutMe (auth form) | 1 % | 188 | 0 | 0 ms | 190012 ms | 10459 ms
|
AboutMe | 2 % | 324 | 0 | 4 ms | 193565 ms | 10463 ms
|
Back probability | 10 % | 1262 | 0 | 0 ms | 0 ms | 0 ms
|
End of Session | 1 % | 197 | 0 | 0 ms | 0 ms | 0 ms
|
Total | 100 % | 11554 | 87 | - | - | 9707 ms
|
Average throughput | 388 req/s
| |||||
Completed sessions | 166
| |||||
Total time | 67007 seconds
| |||||
Average session time | 403 seconds
| |||||
| State name | % of total | Count | Errors | Minimum Time | Maximum Time | Average Time |
|---|---|---|---|---|---|---|
Home | 5 % | 20724 | 0 | 0 ms | 384800 ms | 4588 ms
|
Register | 1 % | 4438 | 0 | 0 ms | 380517 ms | 3403 ms
|
RegisterUser | 1 % | 4301 | 281 | 4 ms | 380004 ms | 3107 ms
|
Browse | 7 % | 30276 | 0 | 0 ms | 384794 ms | 3565 ms
|
BrowseCategories | 5 % | 20822 | 0 | 3 ms | 416962 ms | 3351 ms
|
SearchItemsInCategory | 15 % | 60713 | 0 | 3 ms | 425030 ms | 3356 ms
|
BrowseRegions | 2 % | 8632 | 0 | 3 ms | 425041 ms | 3209 ms
|
BrowseCategoriesInRegion | 2 % | 8374 | 0 | 3 ms | 380029 ms | 3284 ms
|
SearchItemsInRegion | 5 % | 20532 | 0 | 0 ms | 425071 ms | 3358 ms
|
ViewItem | 13 % | 54937 | 0 | 3 ms | 445119 ms | 3392 ms
|
ViewUserInfo | 3 % | 12354 | 0 | 3 ms | 425028 ms | 3176 ms
|
ViewBidHistory | 1 % | 6731 | 0 | 3 ms | 425059 ms | 3955 ms
|
BuyNowAuth | 1 % | 5123 | 0 | 2 ms | 238354 ms | 3197 ms
|
BuyNow | 1 % | 4952 | 557 | 3 ms | 235182 ms | 3199 ms
|
StoreBuyBow | 1 % | 4244 | 0 | 5 ms | 380014 ms | 3367 ms
|
PutBidAuth | 4 % | 19053 | 0 | 0 ms | 380007 ms | 3383 ms
|
PutBid | 5 % | 21581 | 1972 | 3 ms | 425047 ms | 3222 ms
|
StoreBid | 3 % | 14174 | 10 | 5 ms | 380016 ms | 3499 ms
|
PutCommentAuth | 0 % | 0 | 0 | 0 ms | 0 ms | 0 ms
|
PutComment | 0 % | 1902 | 133 | 4 ms | 283011 ms | 3378 ms
|
StoreComment | 0 % | 1711 | 1 | 5 ms | 203045 ms | 3083 ms
|
Sell | 0 % | 2355 | 0 | 0 ms | 193569 ms | 3555 ms
|
SelectCategoryToSellItem | 0 % | 2279 | 0 | 4 ms | 380012 ms | 3556 ms
|
SellItemForm | 0 % | 2202 | 0 | 2 ms | 380017 ms | 3632 ms
|
RegisterItem | 0 % | 2142 | 0 | 4 ms | 212018 ms | 3478 ms
|
AboutMe (auth form) | 1 % | 6974 | 0 | 0 ms | 379999 ms | 3354 ms
|
AboutMe | 2 % | 11395 | 0 | 4 ms | 380273 ms | 3452 ms
|
Back probability | 9 % | 39812 | 0 | 0 ms | 0 ms | 0 ms
|
End of Session | 1 % | 5528 | 0 | 0 ms | 0 ms | 0 ms
|
Total | 100 % | 398261 | 2954 | - | - | 3035 ms
|
Average throughput | 668 req/s
| |||||
Completed sessions | 5528
| |||||
Total time | 1364005 seconds
| |||||
Average session time | 246 seconds
| |||||
An error occured while waiting for remote processes termination (Skipping waits)
Command is: /usr/bin/scp farm6.csail.mit.edu:/tmp/client1 /home/drkp/sandbox/txcache/src/RUBiS-1.4.3/bench/2009-3-19@8:16:33//client1.bin
Command is: /usr/bin/ssh -x localhost /bin/bash -c 'LANG=en_GB.UTF-8 /usr/bin/sar -n DEV -n SOCK -rubcw 1 605 -f /home/drkp/sandbox/txcache/src/RUBiS-1.4.3/bench/2009-3-19@8:16:33//client1.bin > /home/drkp/sandbox/txcache/src/RUBiS-1.4.3/bench/2009-3-19@8:16:33//client1'
Command is: /usr/bin/scp farm14:/tmp/db_server0 /home/drkp/sandbox/txcache/src/RUBiS-1.4.3/bench/2009-3-19@8:16:33//db_server0.bin
Command is: /usr/bin/ssh -x localhost /bin/bash -c 'LANG=en_GB.UTF-8 /usr/bin/sar -n DEV -n SOCK -rubcw 1 605 -f /home/drkp/sandbox/txcache/src/RUBiS-1.4.3/bench/2009-3-19@8:16:33//db_server0.bin > /home/drkp/sandbox/txcache/src/RUBiS-1.4.3/bench/2009-3-19@8:16:33//db_server0'
Command is: /usr/bin/scp farm12.csail.mit.edu:/tmp/web_server0 /home/drkp/sandbox/txcache/src/RUBiS-1.4.3/bench/2009-3-19@8:16:33//web_server0.bin
Command is: /usr/bin/ssh -x localhost /bin/bash -c 'LANG=en_GB.UTF-8 /usr/bin/sar -n DEV -n SOCK -rubcw 1 605 -f /home/drkp/sandbox/txcache/src/RUBiS-1.4.3/bench/2009-3-19@8:16:33//web_server0.bin > /home/drkp/sandbox/txcache/src/RUBiS-1.4.3/bench/2009-3-19@8:16:33//web_server0'
Command is: /usr/bin/scp farm13.csail.mit.edu:/tmp/web_server1 /home/drkp/sandbox/txcache/src/RUBiS-1.4.3/bench/2009-3-19@8:16:33//web_server1.bin
Command is: /usr/bin/ssh -x localhost /bin/bash -c 'LANG=en_GB.UTF-8 /usr/bin/sar -n DEV -n SOCK -rubcw 1 605 -f /home/drkp/sandbox/txcache/src/RUBiS-1.4.3/bench/2009-3-19@8:16:33//web_server1.bin > /home/drkp/sandbox/txcache/src/RUBiS-1.4.3/bench/2009-3-19@8:16:33//web_server1'
Command is: /usr/bin/scp localhost:/tmp/client0 /home/drkp/sandbox/txcache/src/RUBiS-1.4.3/bench/2009-3-19@8:16:33//client0.bin
Command is: /usr/bin/ssh -x localhost /bin/bash -c 'LANG=en_GB.UTF-8 /usr/bin/sar -n DEV -n SOCK -rubcw 1 605 -f /home/drkp/sandbox/txcache/src/RUBiS-1.4.3/bench/2009-3-19@8:16:33//client0.bin > /home/drkp/sandbox/txcache/src/RUBiS-1.4.3/bench/2009-3-19@8:16:33//client0'
Command is: /usr/bin/scp farm6.csail.mit.edu:/tmp/trace_client1.html /home/drkp/sandbox/txcache/src/RUBiS-1.4.3/bench/2009-3-19@8:16:33//
Command is: /usr/bin/scp farm6.csail.mit.edu:/tmp/stat_client1.html /home/drkp/sandbox/txcache/src/RUBiS-1.4.3/bench/2009-3-19@8:16:33//
|
|
|
|
|
|
 | 
|
 | 
|
 | 
|
 | 
|
 | 
|
 | 
|
 | 
|
 | 
|
 | 
|