Node information
Test timing information
Up ramp statistics
Runtime session statistics
Down ramp statistics
Overall statistics
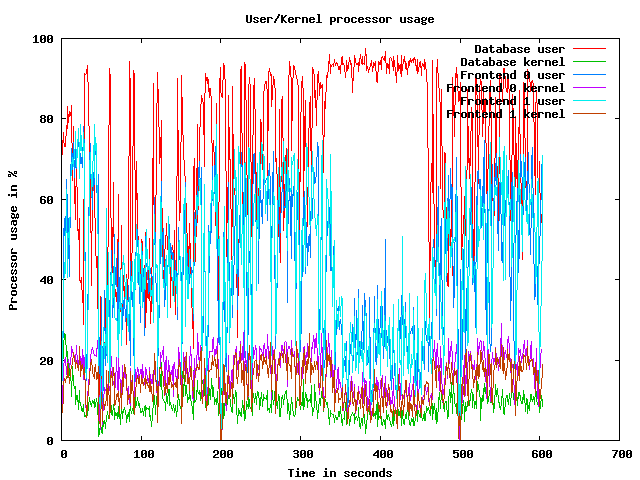
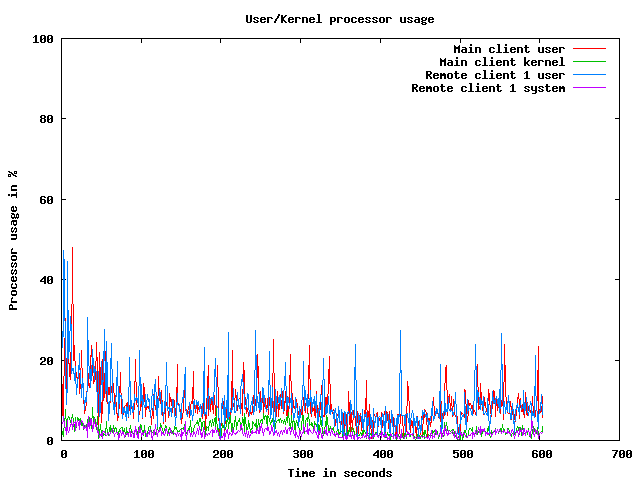
CPU usage graphs
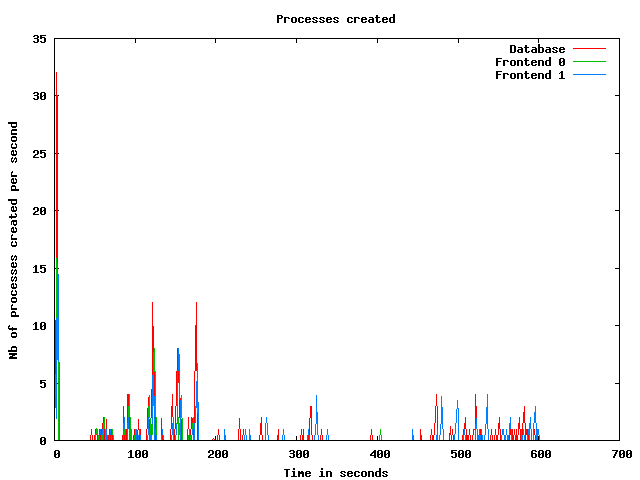
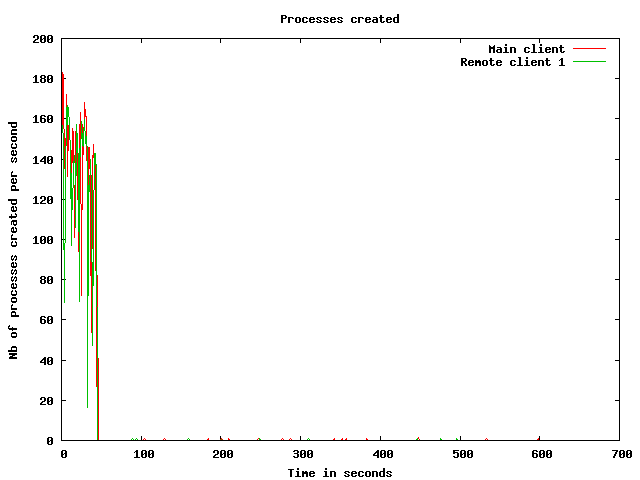
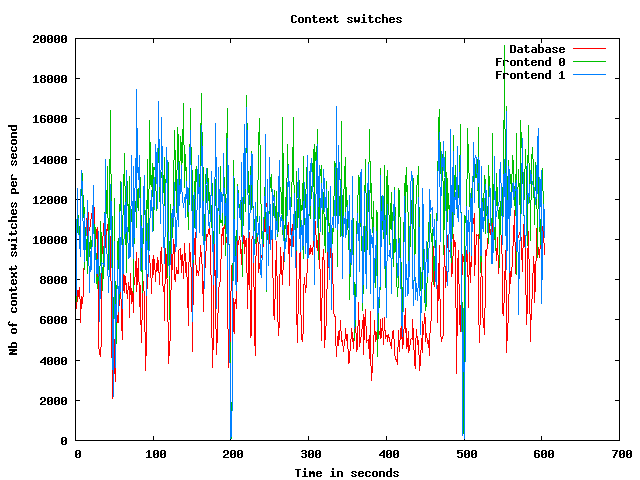
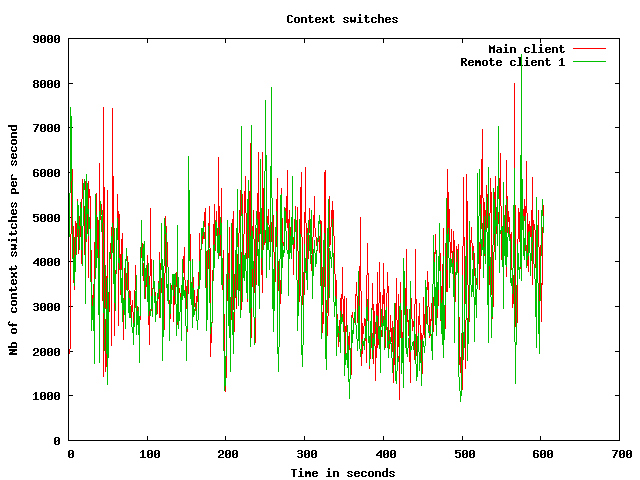
Processes usage graphs
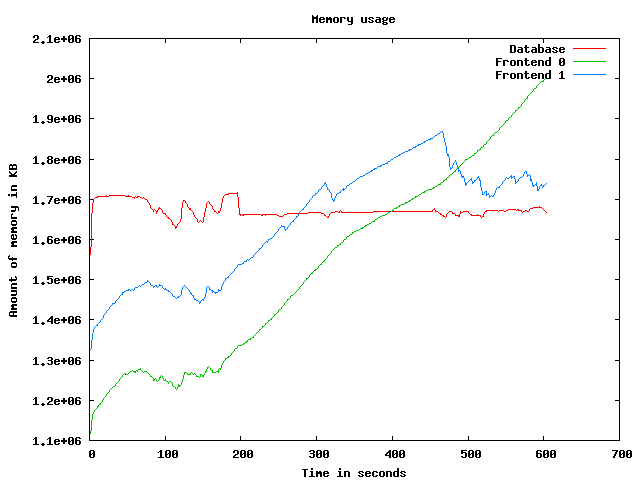
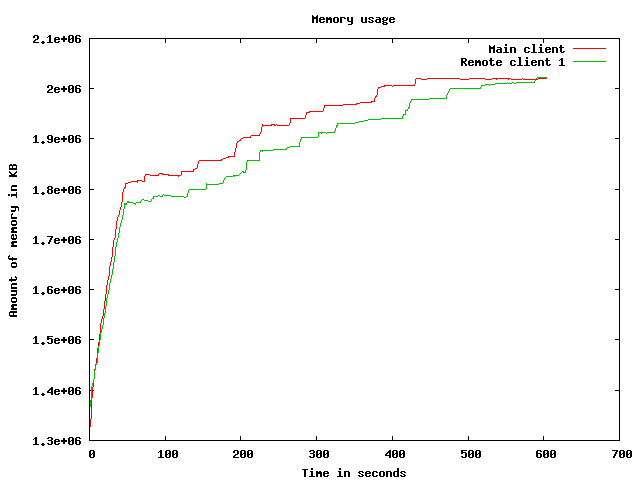
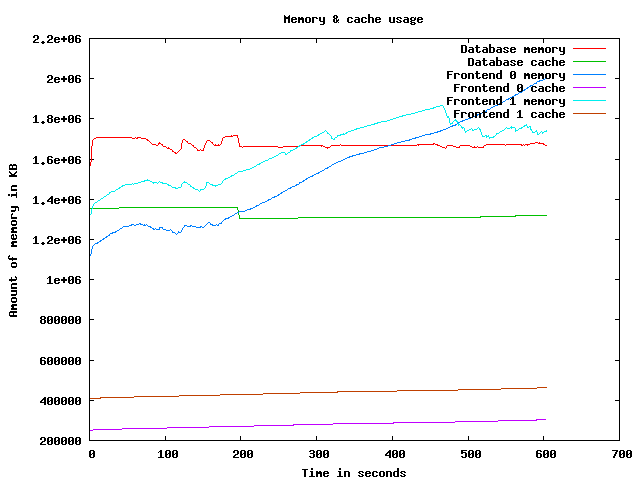
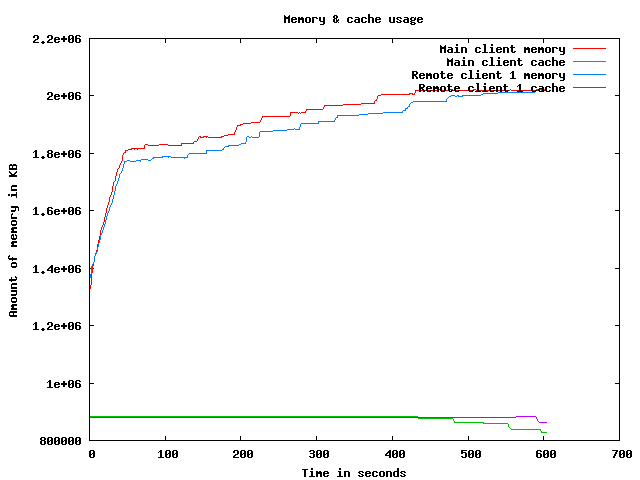
Memory usage graph
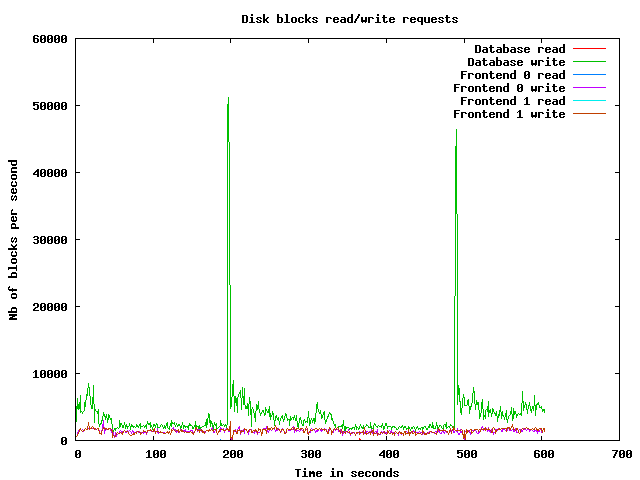
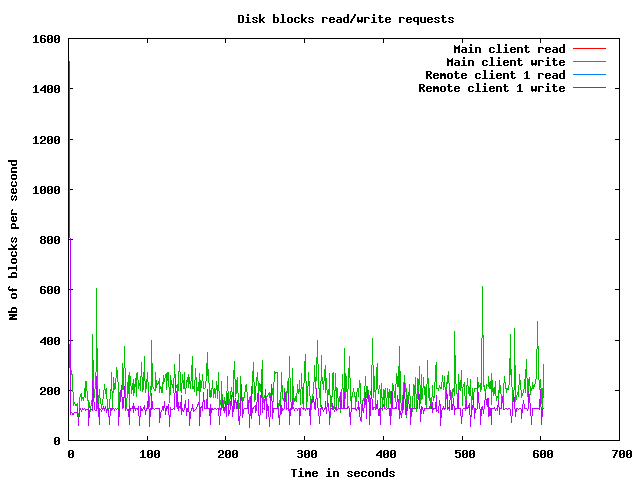
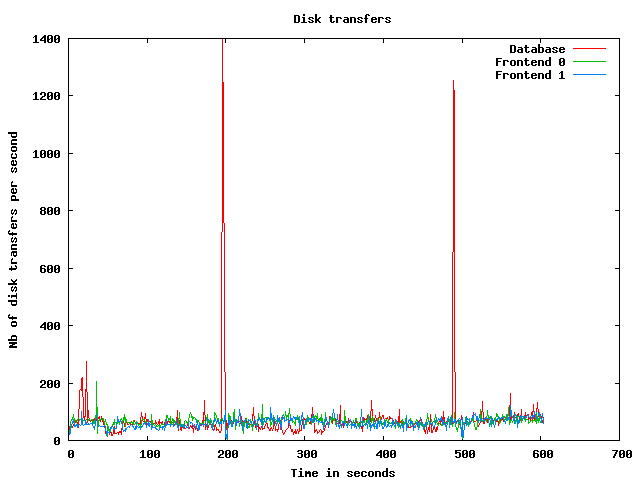
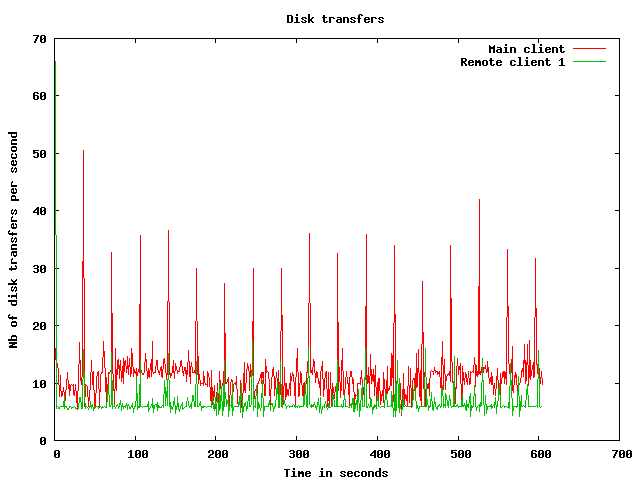
Disk usage graphs
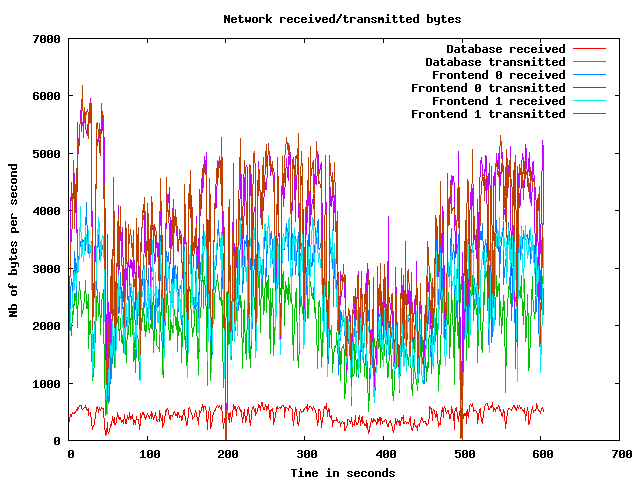
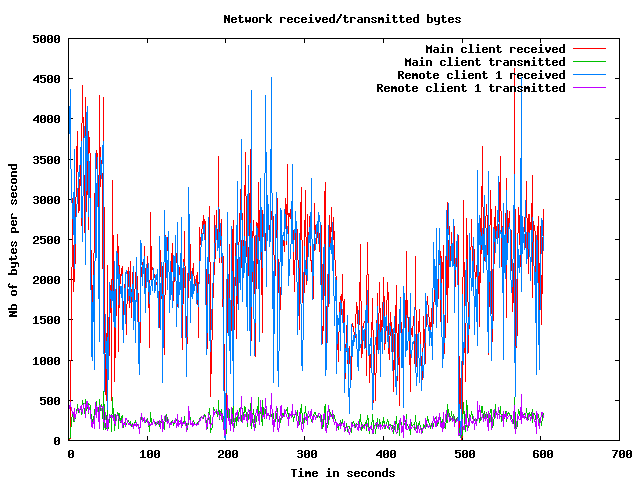
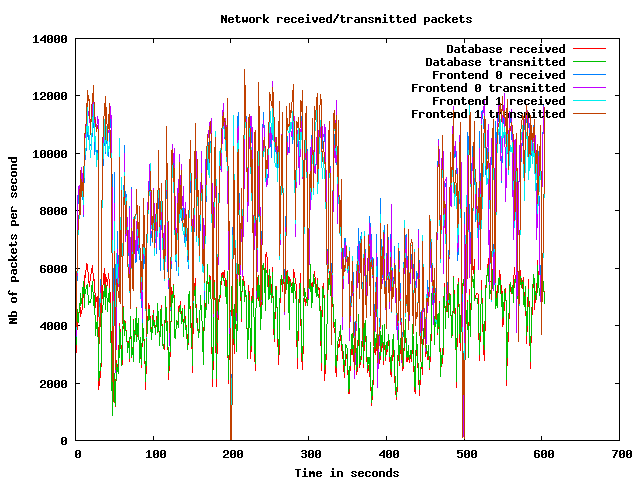
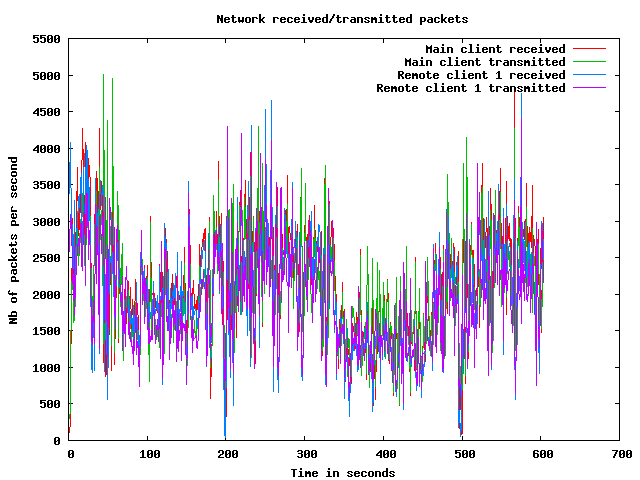
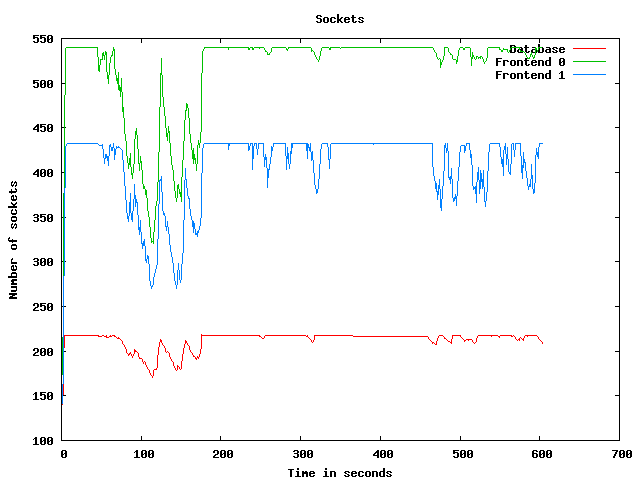
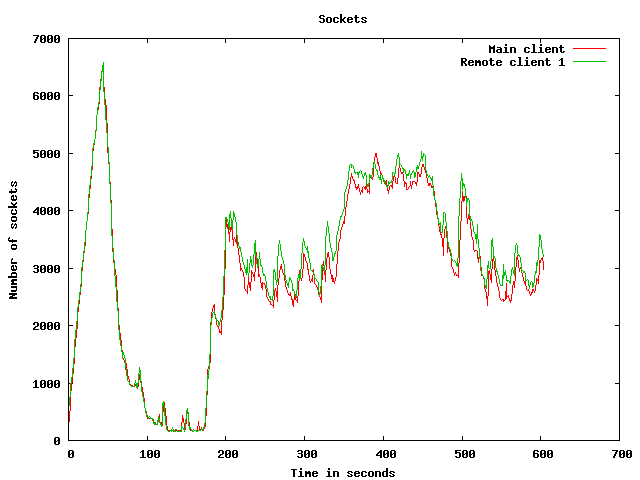
Network usage graphs
| Test start | 2009-3-19 8:30:43 |
| Up ramp start | 2009-3-19 8:31:30 |
| Runtime session start | 2009-3-19 8:33:30 |
| Down ramp start | 2009-3-19 8:41:0 |
| Test end | 2009-3-19 8:44:24 |
| Up ramp length | 2 minutes 230 milliseconds (requested 120000 ms) |
| Runtime session length | 7 minutes 30 seconds 0 millisecond (requested 450000 ms) |
| Down ramp length | 30 seconds 0 millisecond (requested 30000 ms) |
| Total test length | 13 minutes 41 seconds 480 milliseconds |
| State name | % of total | Count | Errors | Minimum Time | Maximum Time | Average Time |
|---|---|---|---|---|---|---|
Home | 9 % | 9593 | 0 | 0 ms | 95957 ms | 9273 ms
|
Register | 1 % | 1366 | 0 | 0 ms | 95289 ms | 3330 ms
|
RegisterUser | 1 % | 1272 | 78 | 5 ms | 95953 ms | 2417 ms
|
Browse | 9 % | 9906 | 0 | 0 ms | 115424 ms | 3428 ms
|
BrowseCategories | 6 % | 6562 | 0 | 3 ms | 93869 ms | 2451 ms
|
SearchItemsInCategory | 14 % | 15255 | 0 | 3 ms | 95310 ms | 1964 ms
|
BrowseRegions | 2 % | 2736 | 0 | 3 ms | 93402 ms | 2472 ms
|
BrowseCategoriesInRegion | 2 % | 2545 | 0 | 3 ms | 95295 ms | 2056 ms
|
SearchItemsInRegion | 5 % | 5161 | 0 | 0 ms | 93532 ms | 1868 ms
|
ViewItem | 12 % | 12985 | 0 | 3 ms | 115442 ms | 1672 ms
|
ViewUserInfo | 2 % | 2321 | 0 | 3 ms | 93459 ms | 1544 ms
|
ViewBidHistory | 1 % | 1273 | 0 | 4 ms | 93380 ms | 1625 ms
|
BuyNowAuth | 1 % | 1152 | 0 | 2 ms | 93008 ms | 1464 ms
|
BuyNow | 0 % | 1026 | 119 | 4 ms | 95666 ms | 1222 ms
|
StoreBuyBow | 0 % | 797 | 0 | 4 ms | 93014 ms | 1418 ms
|
PutBidAuth | 4 % | 4392 | 0 | 0 ms | 95307 ms | 1821 ms
|
PutBid | 4 % | 4318 | 420 | 4 ms | 94559 ms | 1518 ms
|
StoreBid | 2 % | 2629 | 1 | 5 ms | 96012 ms | 1753 ms
|
PutCommentAuth | 0 % | 0 | 0 | 0 ms | 0 ms | 0 ms
|
PutComment | 0 % | 358 | 25 | 4 ms | 47311 ms | 1113 ms
|
StoreComment | 0 % | 285 | 0 | 5 ms | 93029 ms | 1530 ms
|
Sell | 0 % | 705 | 0 | 0 ms | 93139 ms | 3288 ms
|
SelectCategoryToSellItem | 0 % | 651 | 0 | 4 ms | 93233 ms | 2100 ms
|
SellItemForm | 0 % | 604 | 0 | 2 ms | 93268 ms | 2450 ms
|
RegisterItem | 0 % | 555 | 0 | 4 ms | 93021 ms | 2492 ms
|
AboutMe (auth form) | 2 % | 2177 | 0 | 0 ms | 93440 ms | 3557 ms
|
AboutMe | 2 % | 3079 | 0 | 4 ms | 93543 ms | 2445 ms
|
Back probability | 8 % | 8280 | 0 | 0 ms | 0 ms | 0 ms
|
End of Session | 1 % | 1088 | 0 | 0 ms | 0 ms | 0 ms
|
Total | 100 % | 103071 | 643 | - | - | 2617 ms
|
Average throughput | 862 req/s
| |||||
Completed sessions | 974
| |||||
Total time | 59832 seconds
| |||||
Average session time | 61 seconds
| |||||
| State name | % of total | Count | Errors | Minimum Time | Maximum Time | Average Time |
|---|---|---|---|---|---|---|
Home | 3 % | 9312 | 0 | 0 ms | 384349 ms | 2711 ms
|
Register | 1 % | 2474 | 0 | 0 ms | 404814 ms | 6271 ms
|
RegisterUser | 1 % | 2444 | 172 | 5 ms | 380380 ms | 5578 ms
|
Browse | 6 % | 16842 | 0 | 0 ms | 406539 ms | 5969 ms
|
BrowseCategories | 4 % | 11797 | 0 | 3 ms | 395973 ms | 5719 ms
|
SearchItemsInCategory | 15 % | 37349 | 0 | 3 ms | 406614 ms | 5667 ms
|
BrowseRegions | 2 % | 4856 | 0 | 3 ms | 380040 ms | 5788 ms
|
BrowseCategoriesInRegion | 1 % | 4782 | 0 | 3 ms | 380062 ms | 6979 ms
|
SearchItemsInRegion | 5 % | 12626 | 0 | 0 ms | 384222 ms | 6142 ms
|
ViewItem | 14 % | 34323 | 0 | 3 ms | 384999 ms | 5441 ms
|
ViewUserInfo | 3 % | 7893 | 2 | 3 ms | 380091 ms | 4982 ms
|
ViewBidHistory | 1 % | 4241 | 0 | 3 ms | 382794 ms | 6428 ms
|
BuyNowAuth | 1 % | 3237 | 0 | 2 ms | 384170 ms | 4932 ms
|
BuyNow | 1 % | 3194 | 334 | 4 ms | 285594 ms | 5917 ms
|
StoreBuyBow | 1 % | 2823 | 0 | 5 ms | 380050 ms | 6467 ms
|
PutBidAuth | 4 % | 12026 | 0 | 0 ms | 406594 ms | 5456 ms
|
PutBid | 5 % | 14022 | 1194 | 3 ms | 405869 ms | 6176 ms
|
StoreBid | 3 % | 9432 | 7 | 5 ms | 431825 ms | 5661 ms
|
PutCommentAuth | 0 % | 0 | 0 | 0 ms | 0 ms | 0 ms
|
PutComment | 0 % | 1253 | 85 | 4 ms | 283144 ms | 4668 ms
|
StoreComment | 0 % | 1154 | 0 | 5 ms | 380049 ms | 6816 ms
|
Sell | 0 % | 1324 | 0 | 0 ms | 379995 ms | 4907 ms
|
SelectCategoryToSellItem | 0 % | 1313 | 0 | 4 ms | 285463 ms | 5387 ms
|
SellItemForm | 0 % | 1284 | 0 | 2 ms | 283856 ms | 6452 ms
|
RegisterItem | 0 % | 1255 | 0 | 5 ms | 203040 ms | 4541 ms
|
AboutMe (auth form) | 1 % | 4067 | 0 | 0 ms | 405811 ms | 5790 ms
|
AboutMe | 2 % | 6952 | 0 | 4 ms | 384183 ms | 6432 ms
|
Back probability | 10 % | 25686 | 0 | 0 ms | 0 ms | 0 ms
|
End of Session | 1 % | 3592 | 0 | 0 ms | 0 ms | 0 ms
|
Total | 100 % | 241553 | 1794 | - | - | 4909 ms
|
Average throughput | 540 req/s
| |||||
Completed sessions | 3645
| |||||
Total time | 1079278 seconds
| |||||
Average session time | 296 seconds
| |||||
| State name | % of total | Count | Errors | Minimum Time | Maximum Time | Average Time |
|---|---|---|---|---|---|---|
Home | 3 % | 478 | 0 | 0 ms | 286067 ms | 3897 ms
|
Register | 1 % | 133 | 0 | 0 ms | 283012 ms | 6933 ms
|
RegisterUser | 1 % | 145 | 19 | 6 ms | 190000 ms | 4783 ms
|
Browse | 6 % | 884 | 0 | 0 ms | 425099 ms | 10060 ms
|
BrowseCategories | 4 % | 613 | 0 | 3 ms | 396879 ms | 8675 ms
|
SearchItemsInCategory | 15 % | 1961 | 0 | 3 ms | 426214 ms | 11493 ms
|
BrowseRegions | 1 % | 249 | 0 | 3 ms | 391287 ms | 8709 ms
|
BrowseCategoriesInRegion | 1 % | 235 | 0 | 3 ms | 190011 ms | 8181 ms
|
SearchItemsInRegion | 5 % | 659 | 0 | 0 ms | 426134 ms | 12171 ms
|
ViewItem | 14 % | 1828 | 0 | 3 ms | 426225 ms | 10055 ms
|
ViewUserInfo | 3 % | 439 | 0 | 3 ms | 425356 ms | 10379 ms
|
ViewBidHistory | 1 % | 223 | 0 | 4 ms | 426027 ms | 15837 ms
|
BuyNowAuth | 1 % | 166 | 0 | 2 ms | 425056 ms | 15359 ms
|
BuyNow | 1 % | 166 | 15 | 5 ms | 283656 ms | 8455 ms
|
StoreBuyBow | 1 % | 134 | 0 | 5 ms | 380010 ms | 7674 ms
|
PutBidAuth | 4 % | 605 | 0 | 0 ms | 425120 ms | 11614 ms
|
PutBid | 5 % | 745 | 80 | 4 ms | 396910 ms | 12243 ms
|
StoreBid | 4 % | 508 | 0 | 5 ms | 425111 ms | 10333 ms
|
PutCommentAuth | 0 % | 0 | 0 | 0 ms | 0 ms | 0 ms
|
PutComment | 0 % | 60 | 5 | 4 ms | 283633 ms | 8843 ms
|
StoreComment | 0 % | 53 | 0 | 5 ms | 283020 ms | 14053 ms
|
Sell | 0 % | 68 | 0 | 0 ms | 390956 ms | 8457 ms
|
SelectCategoryToSellItem | 0 % | 60 | 0 | 4 ms | 283037 ms | 9992 ms
|
SellItemForm | 0 % | 69 | 0 | 2 ms | 21001 ms | 357 ms
|
RegisterItem | 0 % | 72 | 0 | 5 ms | 390928 ms | 14873 ms
|
AboutMe (auth form) | 1 % | 191 | 0 | 0 ms | 391056 ms | 12068 ms
|
AboutMe | 2 % | 359 | 0 | 5 ms | 391095 ms | 8270 ms
|
Back probability | 11 % | 1405 | 0 | 0 ms | 0 ms | 0 ms
|
End of Session | 1 % | 181 | 0 | 0 ms | 0 ms | 0 ms
|
Total | 100 % | 12689 | 119 | - | - | 8901 ms
|
Average throughput | 426 req/s
| |||||
Completed sessions | 144
| |||||
Total time | 64773 seconds
| |||||
Average session time | 449 seconds
| |||||
| State name | % of total | Count | Errors | Minimum Time | Maximum Time | Average Time |
|---|---|---|---|---|---|---|
Home | 5 % | 19395 | 0 | 0 ms | 457947 ms | 6327 ms
|
Register | 1 % | 3990 | 0 | 0 ms | 404814 ms | 6035 ms
|
RegisterUser | 1 % | 3876 | 270 | 5 ms | 380921 ms | 5340 ms
|
Browse | 7 % | 27738 | 0 | 0 ms | 570003 ms | 5904 ms
|
BrowseCategories | 5 % | 19040 | 0 | 3 ms | 570512 ms | 5466 ms
|
SearchItemsInCategory | 15 % | 55052 | 0 | 3 ms | 570055 ms | 5504 ms
|
BrowseRegions | 2 % | 7869 | 0 | 3 ms | 457946 ms | 5525 ms
|
BrowseCategoriesInRegion | 2 % | 7599 | 0 | 3 ms | 457951 ms | 6035 ms
|
SearchItemsInRegion | 5 % | 18576 | 0 | 0 ms | 426134 ms | 5894 ms
|
ViewItem | 13 % | 49450 | 0 | 3 ms | 570003 ms | 5297 ms
|
ViewUserInfo | 2 % | 10724 | 2 | 3 ms | 425356 ms | 5010 ms
|
ViewBidHistory | 1 % | 5773 | 0 | 3 ms | 426027 ms | 6838 ms
|
BuyNowAuth | 1 % | 4571 | 0 | 2 ms | 425056 ms | 4981 ms
|
BuyNow | 1 % | 4400 | 470 | 4 ms | 380426 ms | 5853 ms
|
StoreBuyBow | 1 % | 3776 | 0 | 4 ms | 380324 ms | 6371 ms
|
PutBidAuth | 4 % | 17097 | 0 | 0 ms | 425120 ms | 5507 ms
|
PutBid | 5 % | 19251 | 1699 | 3 ms | 570040 ms | 6150 ms
|
StoreBid | 3 % | 12637 | 8 | 5 ms | 431825 ms | 5862 ms
|
PutCommentAuth | 0 % | 0 | 0 | 0 ms | 0 ms | 0 ms
|
PutComment | 0 % | 1680 | 115 | 4 ms | 283633 ms | 4384 ms
|
StoreComment | 0 % | 1498 | 0 | 5 ms | 380303 ms | 6674 ms
|
Sell | 0 % | 2104 | 0 | 0 ms | 390956 ms | 4913 ms
|
SelectCategoryToSellItem | 0 % | 2030 | 0 | 4 ms | 380414 ms | 5340 ms
|
SellItemForm | 0 % | 1967 | 0 | 2 ms | 283856 ms | 5562 ms
|
RegisterItem | 0 % | 1888 | 0 | 4 ms | 390928 ms | 4871 ms
|
AboutMe (auth form) | 1 % | 6459 | 0 | 0 ms | 405811 ms | 5871 ms
|
AboutMe | 2 % | 10511 | 0 | 4 ms | 391095 ms | 5787 ms
|
Back probability | 9 % | 35515 | 0 | 0 ms | 0 ms | 0 ms
|
End of Session | 1 % | 4887 | 0 | 0 ms | 0 ms | 0 ms
|
Total | 100 % | 359353 | 2564 | - | - | 4998 ms
|
Average throughput | 602 req/s
| |||||
Completed sessions | 4887
| |||||
Total time | 1267196 seconds
| |||||
Average session time | 259 seconds
| |||||
An error occured while waiting for remote processes termination (Skipping waits)
Command is: /usr/bin/scp farm6.csail.mit.edu:/tmp/client1 /home/drkp/sandbox/txcache/src/RUBiS-1.4.3/bench/2009-3-19@8:30:43//client1.bin
Command is: /usr/bin/ssh -x localhost /bin/bash -c 'LANG=en_GB.UTF-8 /usr/bin/sar -n DEV -n SOCK -rubcw 1 605 -f /home/drkp/sandbox/txcache/src/RUBiS-1.4.3/bench/2009-3-19@8:30:43//client1.bin > /home/drkp/sandbox/txcache/src/RUBiS-1.4.3/bench/2009-3-19@8:30:43//client1'
Command is: /usr/bin/scp farm14:/tmp/db_server0 /home/drkp/sandbox/txcache/src/RUBiS-1.4.3/bench/2009-3-19@8:30:43//db_server0.bin
Command is: /usr/bin/ssh -x localhost /bin/bash -c 'LANG=en_GB.UTF-8 /usr/bin/sar -n DEV -n SOCK -rubcw 1 605 -f /home/drkp/sandbox/txcache/src/RUBiS-1.4.3/bench/2009-3-19@8:30:43//db_server0.bin > /home/drkp/sandbox/txcache/src/RUBiS-1.4.3/bench/2009-3-19@8:30:43//db_server0'
Command is: /usr/bin/scp farm12.csail.mit.edu:/tmp/web_server0 /home/drkp/sandbox/txcache/src/RUBiS-1.4.3/bench/2009-3-19@8:30:43//web_server0.bin
Command is: /usr/bin/ssh -x localhost /bin/bash -c 'LANG=en_GB.UTF-8 /usr/bin/sar -n DEV -n SOCK -rubcw 1 605 -f /home/drkp/sandbox/txcache/src/RUBiS-1.4.3/bench/2009-3-19@8:30:43//web_server0.bin > /home/drkp/sandbox/txcache/src/RUBiS-1.4.3/bench/2009-3-19@8:30:43//web_server0'
Command is: /usr/bin/scp farm13.csail.mit.edu:/tmp/web_server1 /home/drkp/sandbox/txcache/src/RUBiS-1.4.3/bench/2009-3-19@8:30:43//web_server1.bin
Command is: /usr/bin/ssh -x localhost /bin/bash -c 'LANG=en_GB.UTF-8 /usr/bin/sar -n DEV -n SOCK -rubcw 1 605 -f /home/drkp/sandbox/txcache/src/RUBiS-1.4.3/bench/2009-3-19@8:30:43//web_server1.bin > /home/drkp/sandbox/txcache/src/RUBiS-1.4.3/bench/2009-3-19@8:30:43//web_server1'
Command is: /usr/bin/scp localhost:/tmp/client0 /home/drkp/sandbox/txcache/src/RUBiS-1.4.3/bench/2009-3-19@8:30:43//client0.bin
Command is: /usr/bin/ssh -x localhost /bin/bash -c 'LANG=en_GB.UTF-8 /usr/bin/sar -n DEV -n SOCK -rubcw 1 605 -f /home/drkp/sandbox/txcache/src/RUBiS-1.4.3/bench/2009-3-19@8:30:43//client0.bin > /home/drkp/sandbox/txcache/src/RUBiS-1.4.3/bench/2009-3-19@8:30:43//client0'
Command is: /usr/bin/scp farm6.csail.mit.edu:/tmp/trace_client1.html /home/drkp/sandbox/txcache/src/RUBiS-1.4.3/bench/2009-3-19@8:30:43//
Command is: /usr/bin/scp farm6.csail.mit.edu:/tmp/stat_client1.html /home/drkp/sandbox/txcache/src/RUBiS-1.4.3/bench/2009-3-19@8:30:43//
|
|
|
|
|
|
 | 
|
 | 
|
 | 
|
 | 
|
 | 
|
 | 
|
 | 
|
 | 
|
 | 
|