Node information
Test timing information
Up ramp statistics
Runtime session statistics
Down ramp statistics
Overall statistics
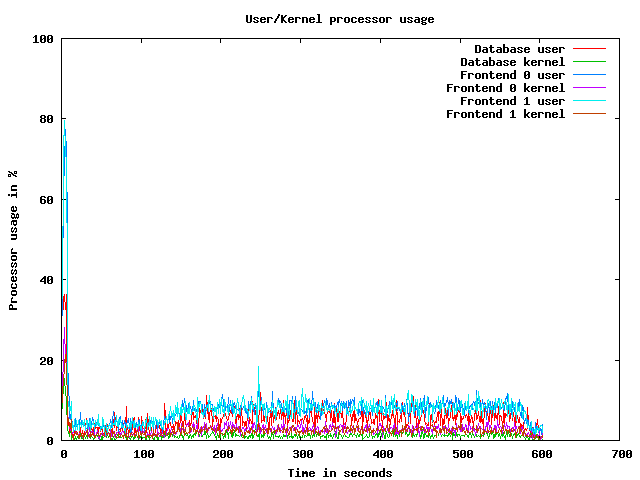
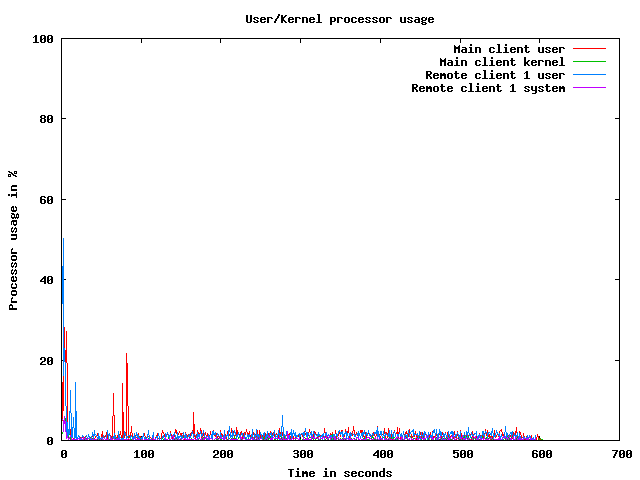
CPU usage graphs
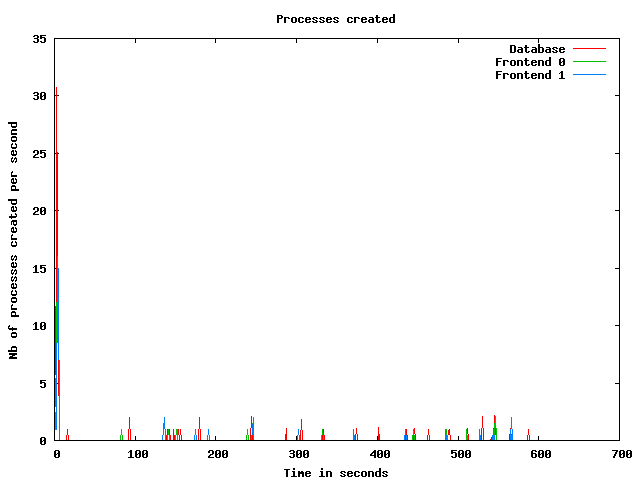
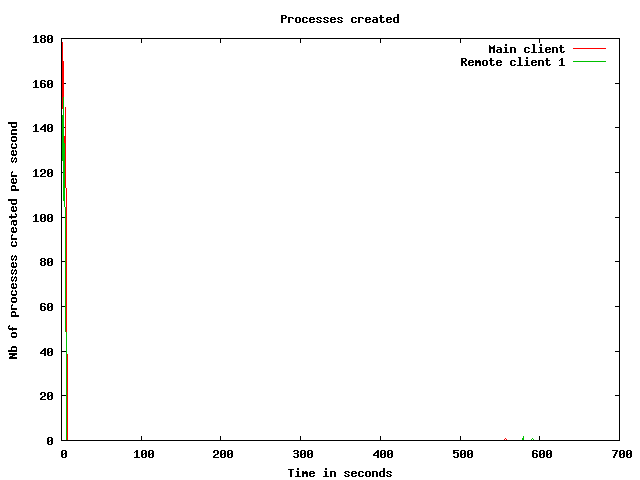
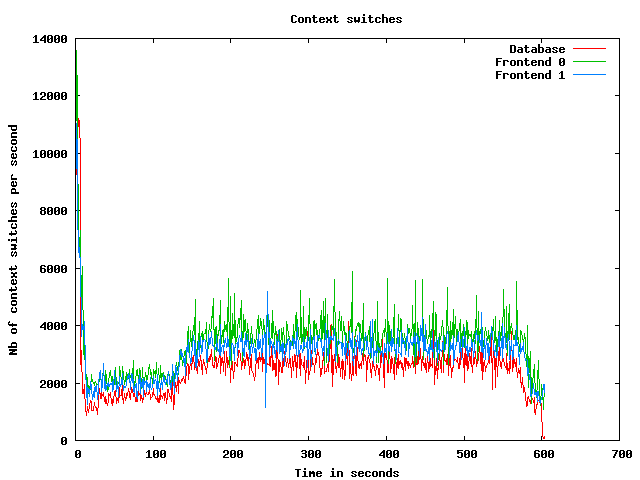
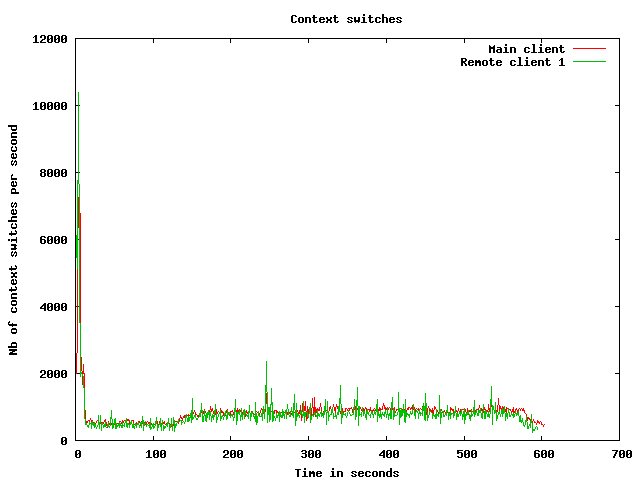
Processes usage graphs
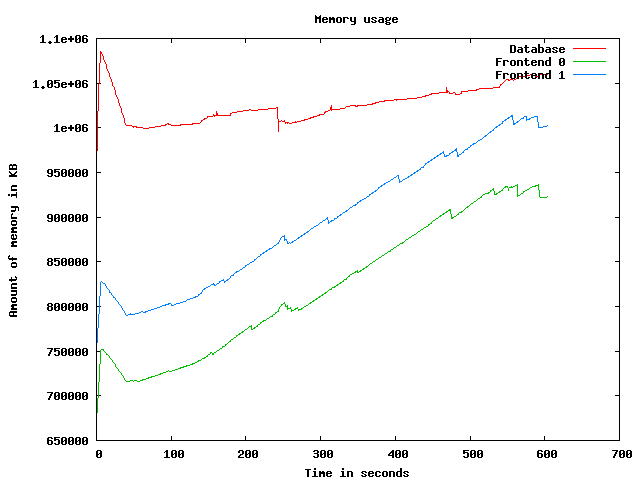
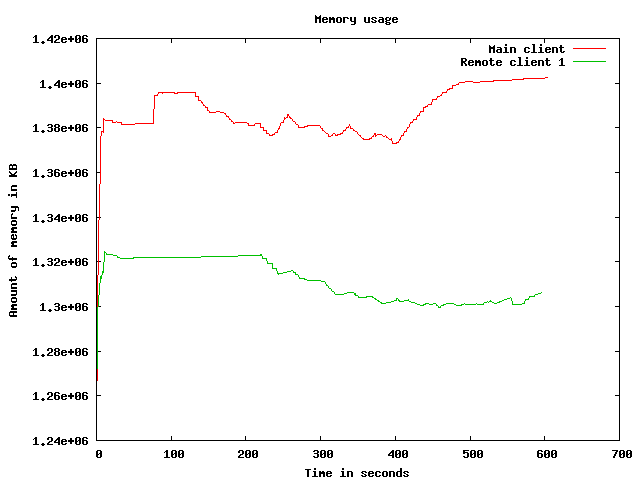
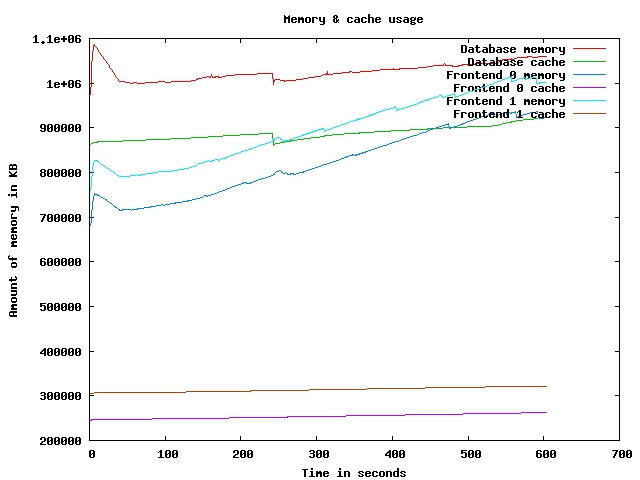
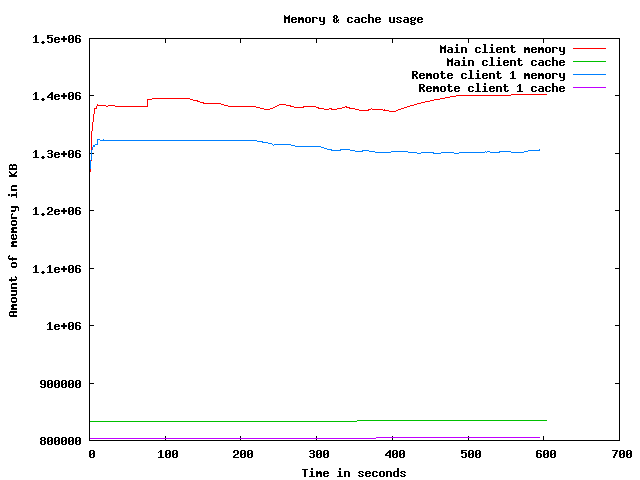
Memory usage graph
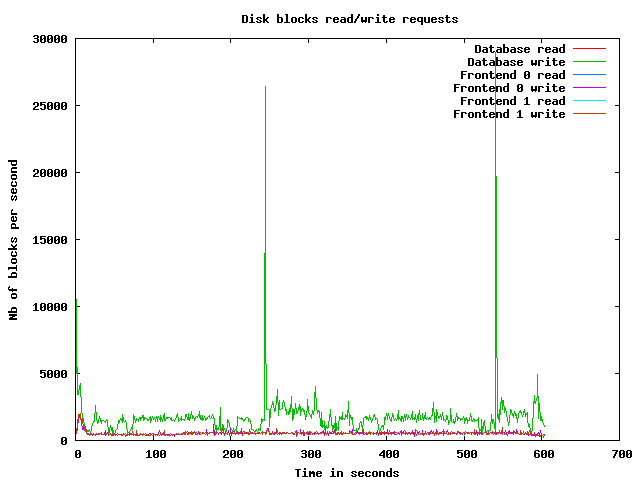
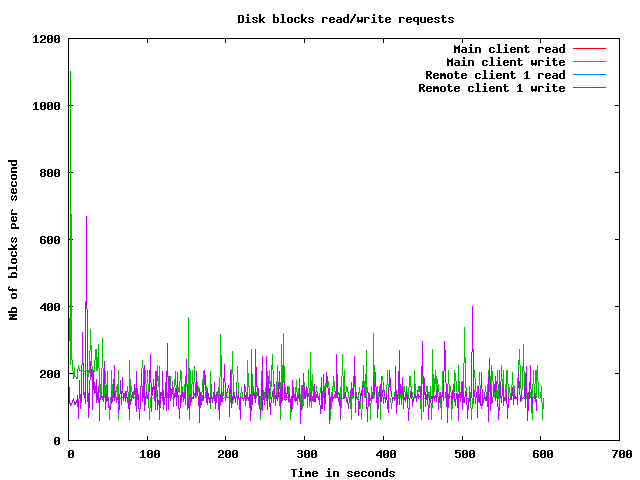
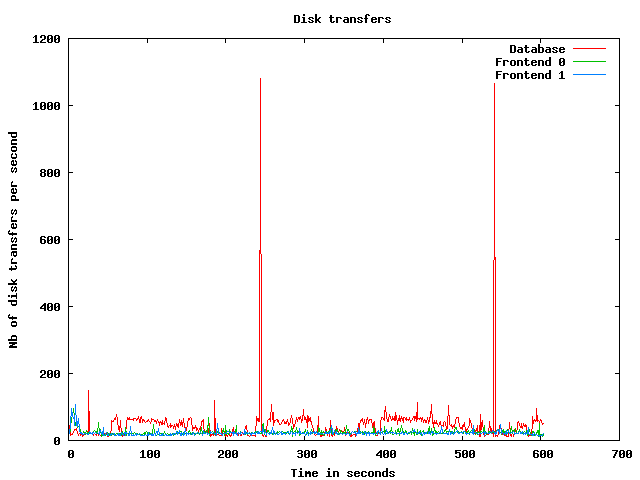
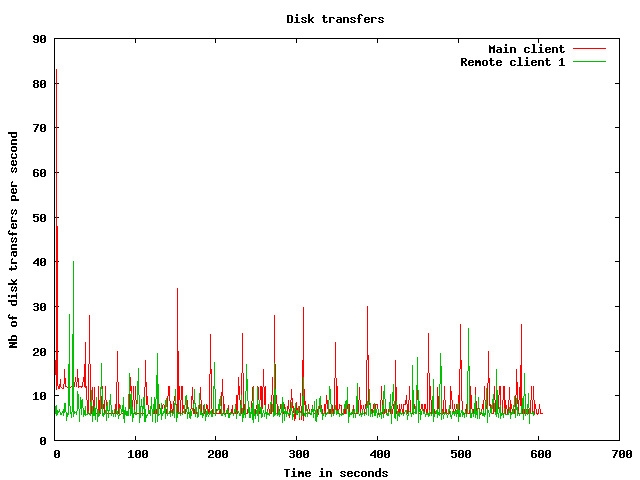
Disk usage graphs
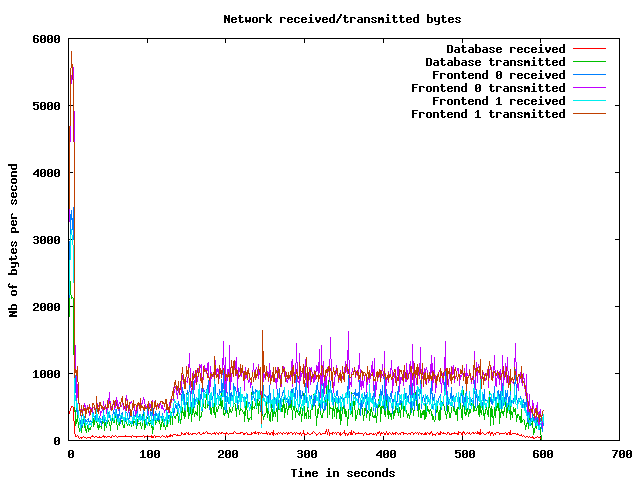
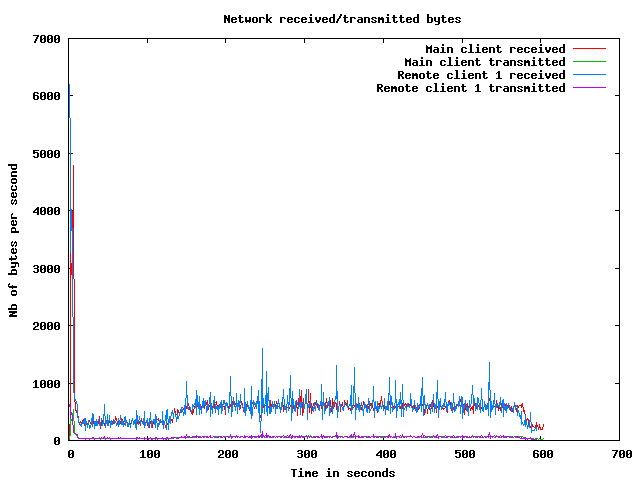
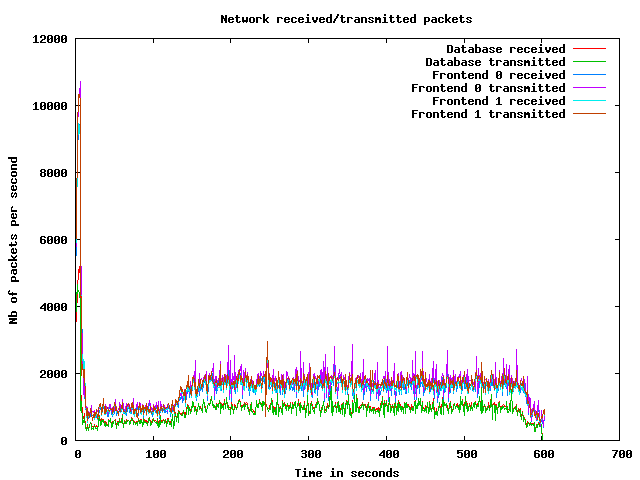
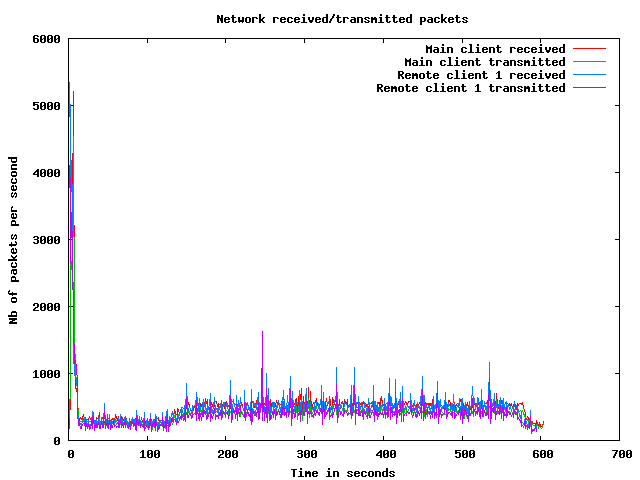
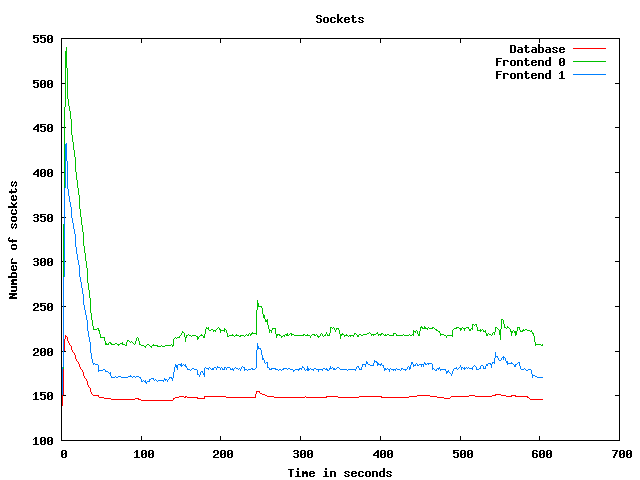
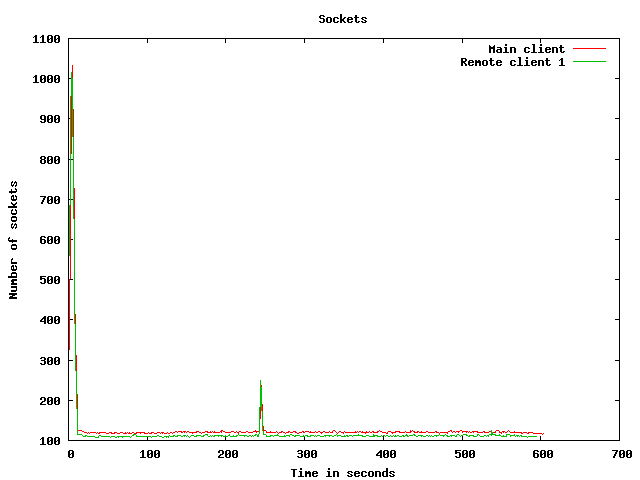
Network usage graphs
| Test start | 2009-3-19 6:4:56 |
| Up ramp start | 2009-3-19 6:5:4 |
| Runtime session start | 2009-3-19 6:7:4 |
| Down ramp start | 2009-3-19 6:14:34 |
| Test end | 2009-3-19 6:16:47 |
| Up ramp length | 2 minutes 1 millisecond (requested 120000 ms) |
| Runtime session length | 7 minutes 30 seconds 0 millisecond (requested 450000 ms) |
| Down ramp length | 30 seconds 1 millisecond (requested 30000 ms) |
| Total test length | 11 minutes 51 seconds 15 milliseconds |
| State name | % of total | Count | Errors | Minimum Time | Maximum Time | Average Time |
|---|---|---|---|---|---|---|
Home | 9 % | 1546 | 0 | 0 ms | 9124 ms | 1886 ms
|
Register | 1 % | 199 | 0 | 0 ms | 9010 ms | 407 ms
|
RegisterUser | 1 % | 176 | 0 | 5 ms | 9013 ms | 299 ms
|
Browse | 9 % | 1559 | 0 | 0 ms | 9011 ms | 311 ms
|
BrowseCategories | 6 % | 1049 | 0 | 3 ms | 9008 ms | 246 ms
|
SearchItemsInCategory | 15 % | 2467 | 0 | 0 ms | 9021 ms | 145 ms
|
BrowseRegions | 2 % | 406 | 0 | 3 ms | 9008 ms | 254 ms
|
BrowseCategoriesInRegion | 2 % | 389 | 0 | 3 ms | 9009 ms | 206 ms
|
SearchItemsInRegion | 5 % | 808 | 0 | 0 ms | 9015 ms | 119 ms
|
ViewItem | 12 % | 1980 | 0 | 3 ms | 9016 ms | 133 ms
|
ViewUserInfo | 2 % | 336 | 0 | 3 ms | 3512 ms | 59 ms
|
ViewBidHistory | 0 % | 135 | 0 | 3 ms | 3014 ms | 107 ms
|
BuyNowAuth | 1 % | 171 | 0 | 2 ms | 8998 ms | 138 ms
|
BuyNow | 0 % | 154 | 23 | 3 ms | 3011 ms | 79 ms
|
StoreBuyBow | 0 % | 118 | 0 | 4 ms | 3008 ms | 54 ms
|
PutBidAuth | 3 % | 611 | 0 | 0 ms | 9012 ms | 122 ms
|
PutBid | 3 % | 580 | 72 | 1 ms | 3268 ms | 96 ms
|
StoreBid | 2 % | 347 | 0 | 4 ms | 9009 ms | 101 ms
|
PutCommentAuth | 0 % | 0 | 0 | 0 ms | 0 ms | 0 ms
|
PutComment | 0 % | 51 | 6 | 4 ms | 3000 ms | 73 ms
|
StoreComment | 0 % | 42 | 0 | 5 ms | 3233 ms | 156 ms
|
Sell | 0 % | 129 | 0 | 0 ms | 9004 ms | 560 ms
|
SelectCategoryToSellItem | 0 % | 124 | 0 | 3 ms | 9012 ms | 220 ms
|
SellItemForm | 0 % | 120 | 0 | 2 ms | 9009 ms | 217 ms
|
RegisterItem | 0 % | 113 | 0 | 4 ms | 3363 ms | 98 ms
|
AboutMe (auth form) | 1 % | 303 | 0 | 0 ms | 9007 ms | 231 ms
|
AboutMe | 2 % | 420 | 0 | 4 ms | 9034 ms | 308 ms
|
Back probability | 7 % | 1216 | 0 | 0 ms | 0 ms | 0 ms
|
End of Session | 0 % | 156 | 0 | 0 ms | 0 ms | 0 ms
|
Total | 100 % | 15705 | 101 | - | - | 334 ms
|
Average throughput | 131 req/s
| |||||
Completed sessions | 138
| |||||
Total time | 7099 seconds
| |||||
Average session time | 51 seconds
| |||||
| State name | % of total | Count | Errors | Minimum Time | Maximum Time | Average Time |
|---|---|---|---|---|---|---|
Home | 4 % | 3328 | 0 | 0 ms | 1642 ms | 1 ms
|
Register | 1 % | 789 | 0 | 0 ms | 3000 ms | 5 ms
|
RegisterUser | 1 % | 764 | 5 | 4 ms | 1904 ms | 26 ms
|
Browse | 7 % | 5280 | 0 | 0 ms | 2997 ms | 3 ms
|
BrowseCategories | 5 % | 3687 | 0 | 3 ms | 1680 ms | 8 ms
|
SearchItemsInCategory | 15 % | 11717 | 0 | 0 ms | 3002 ms | 9 ms
|
BrowseRegions | 2 % | 1517 | 0 | 3 ms | 194 ms | 5 ms
|
BrowseCategoriesInRegion | 2 % | 1479 | 0 | 3 ms | 1812 ms | 12 ms
|
SearchItemsInRegion | 4 % | 3618 | 0 | 0 ms | 3005 ms | 17 ms
|
ViewItem | 14 % | 10432 | 2 | 3 ms | 3007 ms | 12 ms
|
ViewUserInfo | 3 % | 2301 | 0 | 3 ms | 2995 ms | 11 ms
|
ViewBidHistory | 1 % | 1278 | 0 | 3 ms | 1630 ms | 17 ms
|
BuyNowAuth | 1 % | 928 | 0 | 2 ms | 1612 ms | 9 ms
|
BuyNow | 1 % | 921 | 129 | 3 ms | 1769 ms | 13 ms
|
StoreBuyBow | 1 % | 777 | 0 | 4 ms | 3006 ms | 13 ms
|
PutBidAuth | 4 % | 3647 | 0 | 0 ms | 1759 ms | 8 ms
|
PutBid | 5 % | 4181 | 500 | 3 ms | 3002 ms | 12 ms
|
StoreBid | 3 % | 2710 | 1 | 4 ms | 3011 ms | 14 ms
|
PutCommentAuth | 0 % | 0 | 0 | 0 ms | 0 ms | 0 ms
|
PutComment | 0 % | 311 | 28 | 3 ms | 1155 ms | 10 ms
|
StoreComment | 0 % | 274 | 0 | 4 ms | 1325 ms | 17 ms
|
Sell | 0 % | 457 | 0 | 0 ms | 2993 ms | 10 ms
|
SelectCategoryToSellItem | 0 % | 446 | 0 | 3 ms | 125 ms | 6 ms
|
SellItemForm | 0 % | 433 | 0 | 2 ms | 17 ms | 3 ms
|
RegisterItem | 0 % | 424 | 0 | 4 ms | 851 ms | 10 ms
|
AboutMe (auth form) | 1 % | 1200 | 0 | 0 ms | 980 ms | 1 ms
|
AboutMe | 2 % | 2047 | 0 | 3 ms | 3011 ms | 22 ms
|
Back probability | 10 % | 7609 | 0 | 0 ms | 0 ms | 0 ms
|
End of Session | 1 % | 1009 | 0 | 0 ms | 0 ms | 0 ms
|
Total | 100 % | 73564 | 665 | - | - | 9 ms
|
Average throughput | 164 req/s
| |||||
Completed sessions | 1006
| |||||
Total time | 247235 seconds
| |||||
Average session time | 245 seconds
| |||||
| State name | % of total | Count | Errors | Minimum Time | Maximum Time | Average Time |
|---|---|---|---|---|---|---|
Home | 4 % | 122 | 0 | 0 ms | 3 ms | 0 ms
|
Register | 1 % | 27 | 0 | 0 ms | 2 ms | 0 ms
|
RegisterUser | 1 % | 28 | 0 | 5 ms | 15 ms | 5 ms
|
Browse | 7 % | 187 | 0 | 0 ms | 5 ms | 0 ms
|
BrowseCategories | 6 % | 148 | 0 | 3 ms | 16 ms | 3 ms
|
SearchItemsInCategory | 14 % | 359 | 0 | 0 ms | 19 ms | 4 ms
|
BrowseRegions | 1 % | 48 | 0 | 3 ms | 12 ms | 4 ms
|
BrowseCategoriesInRegion | 1 % | 42 | 0 | 3 ms | 10 ms | 4 ms
|
SearchItemsInRegion | 4 % | 108 | 0 | 0 ms | 95 ms | 11 ms
|
ViewItem | 14 % | 354 | 0 | 3 ms | 81 ms | 6 ms
|
ViewUserInfo | 3 % | 79 | 0 | 3 ms | 13 ms | 5 ms
|
ViewBidHistory | 1 % | 40 | 0 | 3 ms | 41 ms | 13 ms
|
BuyNowAuth | 1 % | 31 | 0 | 2 ms | 6 ms | 2 ms
|
BuyNow | 1 % | 29 | 6 | 4 ms | 11 ms | 7 ms
|
StoreBuyBow | 0 % | 24 | 0 | 4 ms | 18 ms | 8 ms
|
PutBidAuth | 5 % | 123 | 0 | 1 ms | 8 ms | 3 ms
|
PutBid | 6 % | 152 | 21 | 3 ms | 26 ms | 7 ms
|
StoreBid | 3 % | 95 | 0 | 4 ms | 16 ms | 5 ms
|
PutCommentAuth | 0 % | 0 | 0 | 0 ms | 0 ms | 0 ms
|
PutComment | 0 % | 8 | 0 | 4 ms | 13 ms | 6 ms
|
StoreComment | 0 % | 8 | 0 | 5 ms | 9 ms | 7 ms
|
Sell | 0 % | 12 | 0 | 0 ms | 2 ms | 0 ms
|
SelectCategoryToSellItem | 0 % | 13 | 0 | 3 ms | 14 ms | 7 ms
|
SellItemForm | 0 % | 18 | 0 | 2 ms | 7 ms | 2 ms
|
RegisterItem | 0 % | 16 | 0 | 4 ms | 7 ms | 4 ms
|
AboutMe (auth form) | 1 % | 40 | 0 | 0 ms | 1 ms | 0 ms
|
AboutMe | 3 % | 74 | 0 | 4 ms | 38 ms | 15 ms
|
Back probability | 9 % | 238 | 0 | 0 ms | 0 ms | 0 ms
|
End of Session | 1 % | 31 | 0 | 0 ms | 0 ms | 0 ms
|
Total | 100 % | 2454 | 27 | - | - | 4 ms
|
Average throughput | 82 req/s
| |||||
Completed sessions | 40
| |||||
Total time | 16207 seconds
| |||||
Average session time | 405 seconds
| |||||
| State name | % of total | Count | Errors | Minimum Time | Maximum Time | Average Time |
|---|---|---|---|---|---|---|
Home | 5 % | 4996 | 0 | 0 ms | 9124 ms | 584 ms
|
Register | 1 % | 1015 | 0 | 0 ms | 9010 ms | 84 ms
|
RegisterUser | 1 % | 968 | 5 | 4 ms | 9013 ms | 75 ms
|
Browse | 7 % | 7026 | 0 | 0 ms | 9011 ms | 72 ms
|
BrowseCategories | 5 % | 4884 | 0 | 3 ms | 9008 ms | 59 ms
|
SearchItemsInCategory | 15 % | 14591 | 0 | 0 ms | 9021 ms | 32 ms
|
BrowseRegions | 2 % | 1971 | 0 | 3 ms | 9008 ms | 56 ms
|
BrowseCategoriesInRegion | 2 % | 1910 | 0 | 3 ms | 9009 ms | 51 ms
|
SearchItemsInRegion | 4 % | 4549 | 0 | 0 ms | 9015 ms | 35 ms
|
ViewItem | 13 % | 12786 | 2 | 3 ms | 9016 ms | 31 ms
|
ViewUserInfo | 2 % | 2720 | 0 | 3 ms | 3512 ms | 17 ms
|
ViewBidHistory | 1 % | 1458 | 0 | 3 ms | 3014 ms | 25 ms
|
BuyNowAuth | 1 % | 1130 | 0 | 2 ms | 8998 ms | 28 ms
|
BuyNow | 1 % | 1104 | 158 | 3 ms | 3011 ms | 22 ms
|
StoreBuyBow | 1 % | 919 | 0 | 4 ms | 3008 ms | 18 ms
|
PutBidAuth | 4 % | 4381 | 0 | 0 ms | 9012 ms | 24 ms
|
PutBid | 5 % | 4927 | 593 | 1 ms | 3268 ms | 21 ms
|
StoreBid | 3 % | 3152 | 1 | 4 ms | 9009 ms | 23 ms
|
PutCommentAuth | 0 % | 0 | 0 | 0 ms | 0 ms | 0 ms
|
PutComment | 0 % | 370 | 34 | 3 ms | 3000 ms | 18 ms
|
StoreComment | 0 % | 324 | 0 | 4 ms | 3233 ms | 34 ms
|
Sell | 0 % | 598 | 0 | 0 ms | 9004 ms | 128 ms
|
SelectCategoryToSellItem | 0 % | 583 | 0 | 3 ms | 9012 ms | 51 ms
|
SellItemForm | 0 % | 571 | 0 | 2 ms | 9009 ms | 48 ms
|
RegisterItem | 0 % | 553 | 0 | 4 ms | 3363 ms | 28 ms
|
AboutMe (auth form) | 1 % | 1543 | 0 | 0 ms | 9007 ms | 46 ms
|
AboutMe | 2 % | 2555 | 0 | 3 ms | 9034 ms | 69 ms
|
Back probability | 9 % | 9064 | 0 | 0 ms | 0 ms | 0 ms
|
End of Session | 1 % | 1196 | 0 | 0 ms | 0 ms | 0 ms
|
Total | 100 % | 91844 | 793 | - | - | 64 ms
|
Average throughput | 154 req/s
| |||||
Completed sessions | 1196
| |||||
Total time | 273520 seconds
| |||||
Average session time | 228 seconds
| |||||
An error occured while waiting for remote processes termination (Skipping waits)
Command is: /usr/bin/scp farm6.csail.mit.edu:/tmp/client1 /home/drkp/sandbox/txcache/src/RUBiS-1.4.3/bench/2009-3-19@6:4:56//client1.bin
Command is: /usr/bin/ssh -x localhost /bin/bash -c 'LANG=en_GB.UTF-8 /usr/bin/sar -n DEV -n SOCK -rubcw 1 605 -f /home/drkp/sandbox/txcache/src/RUBiS-1.4.3/bench/2009-3-19@6:4:56//client1.bin > /home/drkp/sandbox/txcache/src/RUBiS-1.4.3/bench/2009-3-19@6:4:56//client1'
Command is: /usr/bin/scp farm14:/tmp/db_server0 /home/drkp/sandbox/txcache/src/RUBiS-1.4.3/bench/2009-3-19@6:4:56//db_server0.bin
Command is: /usr/bin/ssh -x localhost /bin/bash -c 'LANG=en_GB.UTF-8 /usr/bin/sar -n DEV -n SOCK -rubcw 1 605 -f /home/drkp/sandbox/txcache/src/RUBiS-1.4.3/bench/2009-3-19@6:4:56//db_server0.bin > /home/drkp/sandbox/txcache/src/RUBiS-1.4.3/bench/2009-3-19@6:4:56//db_server0'
Command is: /usr/bin/scp farm12.csail.mit.edu:/tmp/web_server0 /home/drkp/sandbox/txcache/src/RUBiS-1.4.3/bench/2009-3-19@6:4:56//web_server0.bin
Command is: /usr/bin/ssh -x localhost /bin/bash -c 'LANG=en_GB.UTF-8 /usr/bin/sar -n DEV -n SOCK -rubcw 1 605 -f /home/drkp/sandbox/txcache/src/RUBiS-1.4.3/bench/2009-3-19@6:4:56//web_server0.bin > /home/drkp/sandbox/txcache/src/RUBiS-1.4.3/bench/2009-3-19@6:4:56//web_server0'
Command is: /usr/bin/scp farm13.csail.mit.edu:/tmp/web_server1 /home/drkp/sandbox/txcache/src/RUBiS-1.4.3/bench/2009-3-19@6:4:56//web_server1.bin
Command is: /usr/bin/ssh -x localhost /bin/bash -c 'LANG=en_GB.UTF-8 /usr/bin/sar -n DEV -n SOCK -rubcw 1 605 -f /home/drkp/sandbox/txcache/src/RUBiS-1.4.3/bench/2009-3-19@6:4:56//web_server1.bin > /home/drkp/sandbox/txcache/src/RUBiS-1.4.3/bench/2009-3-19@6:4:56//web_server1'
Command is: /usr/bin/scp localhost:/tmp/client0 /home/drkp/sandbox/txcache/src/RUBiS-1.4.3/bench/2009-3-19@6:4:56//client0.bin
Command is: /usr/bin/ssh -x localhost /bin/bash -c 'LANG=en_GB.UTF-8 /usr/bin/sar -n DEV -n SOCK -rubcw 1 605 -f /home/drkp/sandbox/txcache/src/RUBiS-1.4.3/bench/2009-3-19@6:4:56//client0.bin > /home/drkp/sandbox/txcache/src/RUBiS-1.4.3/bench/2009-3-19@6:4:56//client0'
Command is: /usr/bin/scp farm6.csail.mit.edu:/tmp/trace_client1.html /home/drkp/sandbox/txcache/src/RUBiS-1.4.3/bench/2009-3-19@6:4:56//
Command is: /usr/bin/scp farm6.csail.mit.edu:/tmp/stat_client1.html /home/drkp/sandbox/txcache/src/RUBiS-1.4.3/bench/2009-3-19@6:4:56//
|
|
|
|
|
|
 | 
|
 | 
|
 | 
|
 | 
|
 | 
|
 | 
|
 | 
|
 | 
|
 | 
|