Node information
Test timing information
Up ramp statistics
Runtime session statistics
Down ramp statistics
Overall statistics
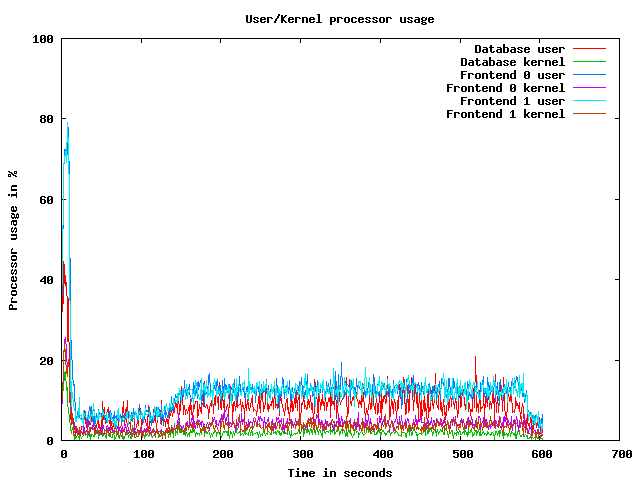
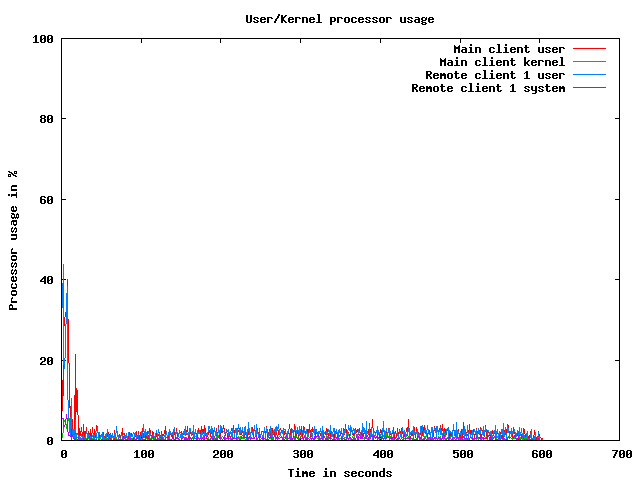
CPU usage graphs
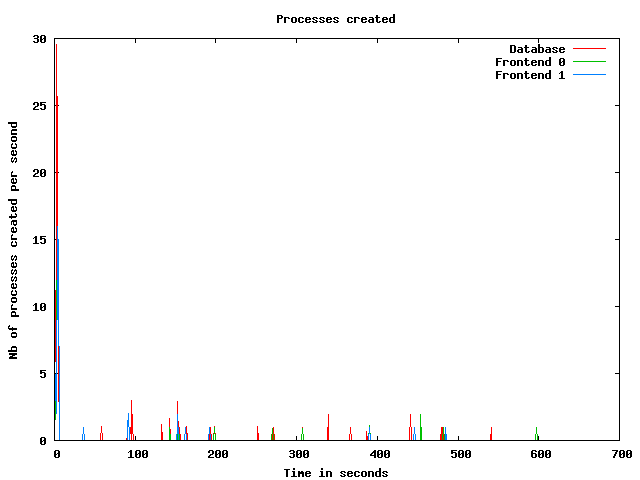
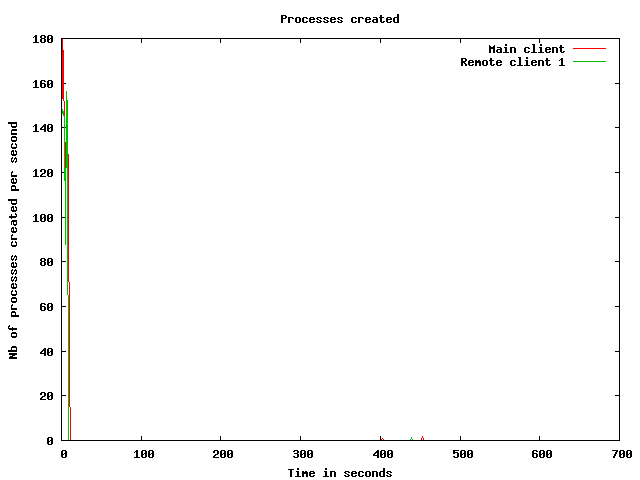
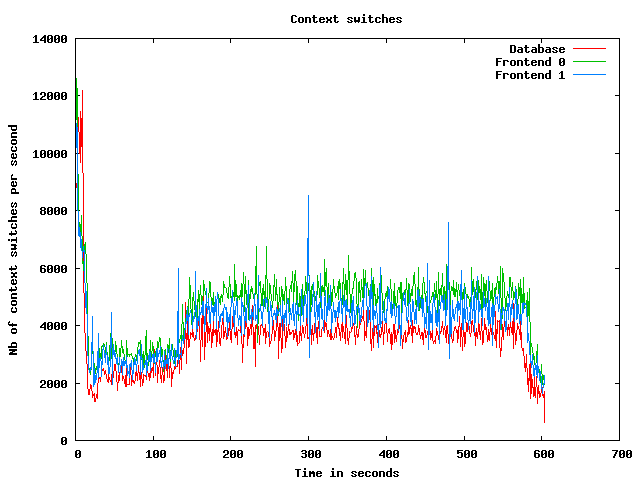
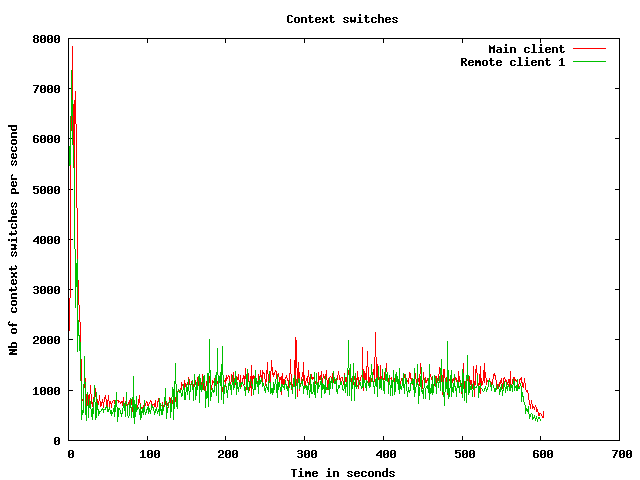
Processes usage graphs
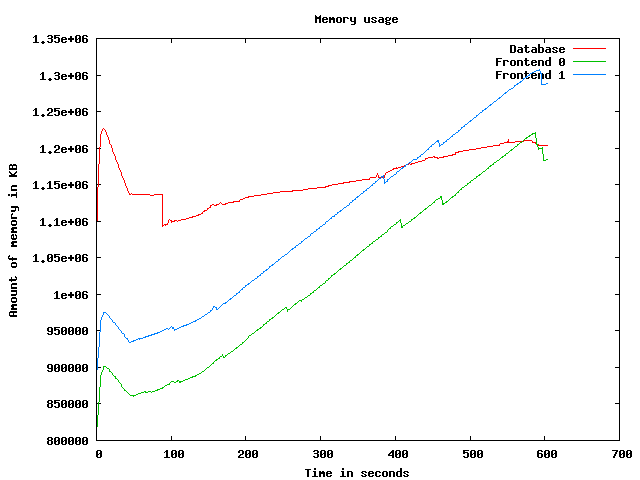
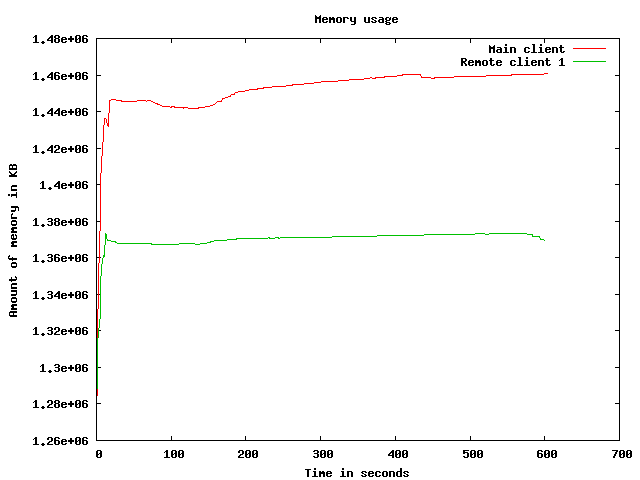
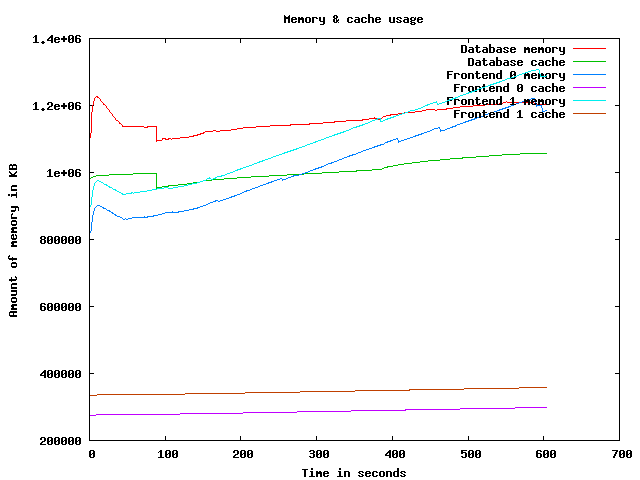
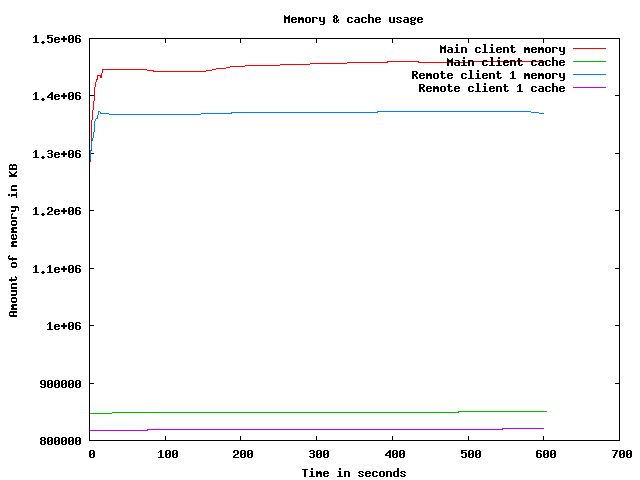
Memory usage graph
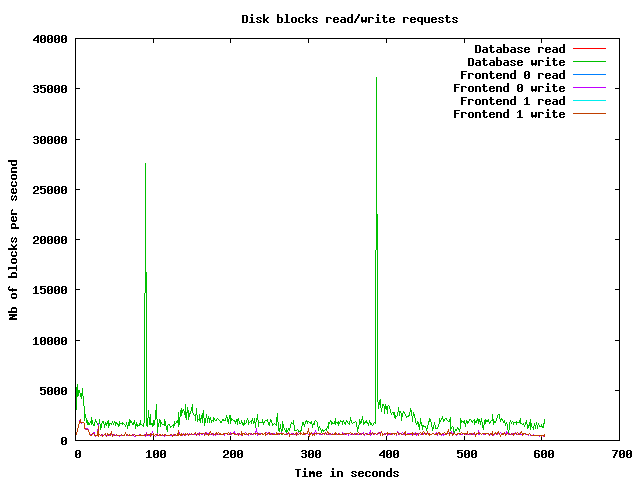
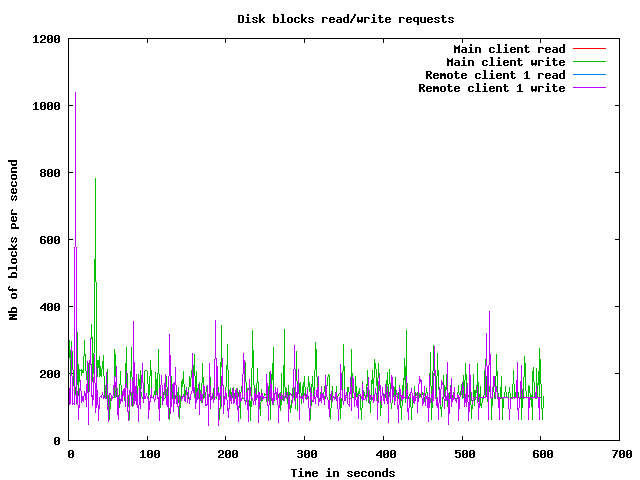
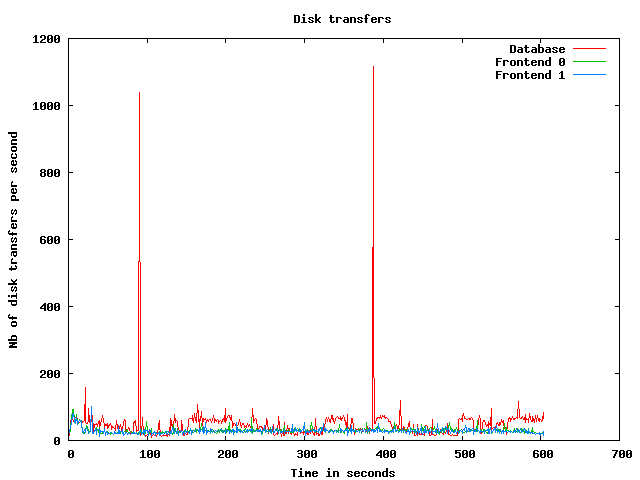
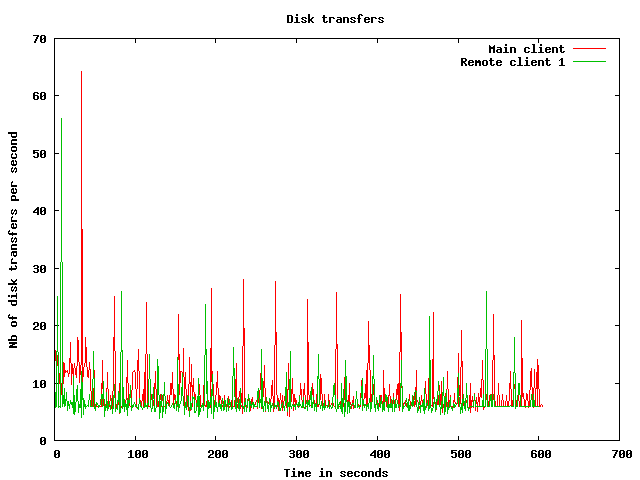
Disk usage graphs
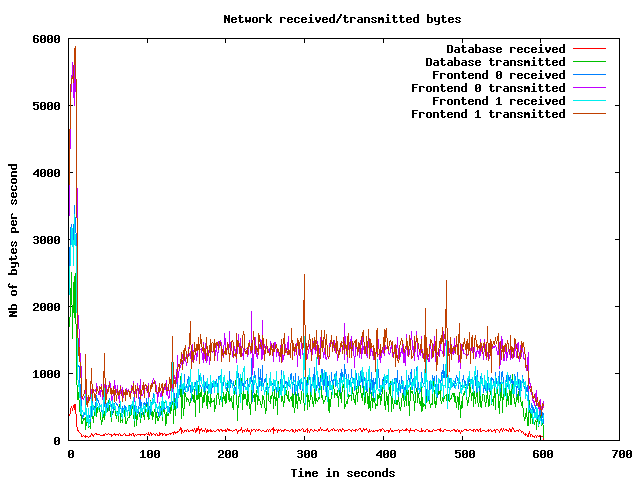
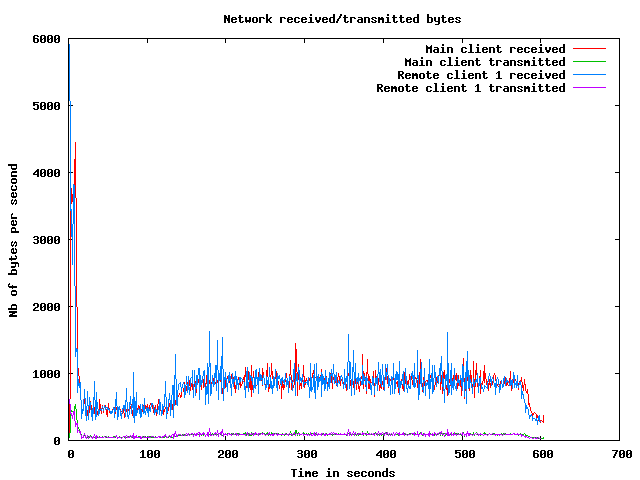
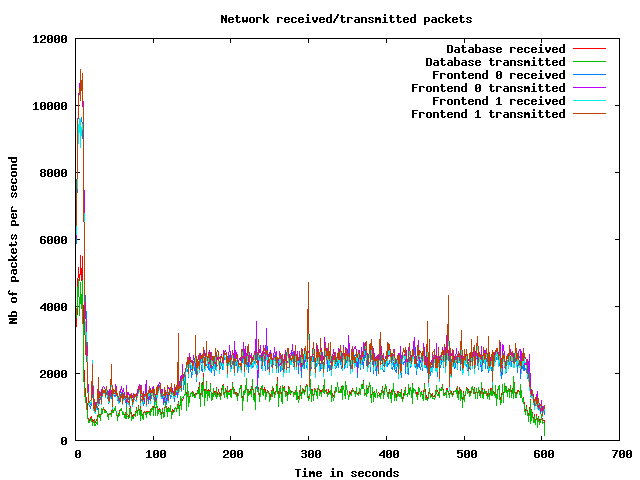
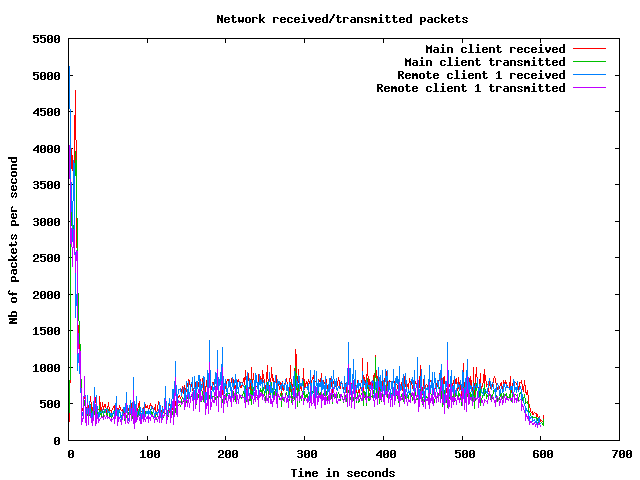
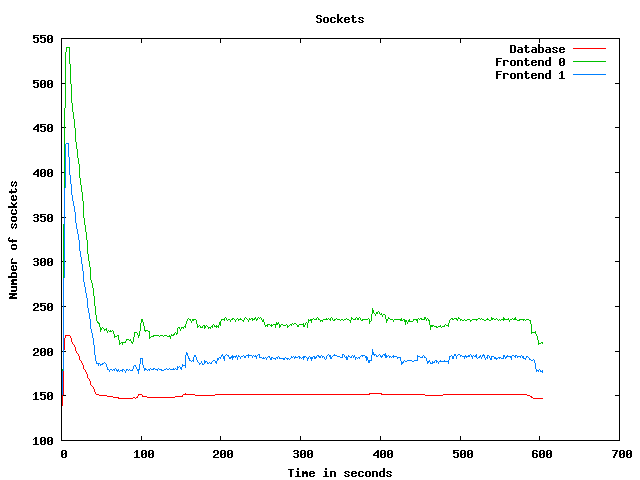
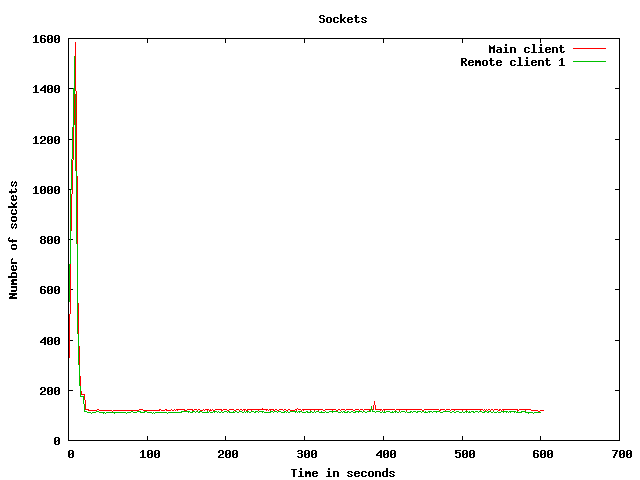
Network usage graphs
| Test start | 2009-3-19 6:17:30 |
| Up ramp start | 2009-3-19 6:17:42 |
| Runtime session start | 2009-3-19 6:19:42 |
| Down ramp start | 2009-3-19 6:27:12 |
| Test end | 2009-3-19 6:29:27 |
| Up ramp length | 2 minutes 1 millisecond (requested 120000 ms) |
| Runtime session length | 7 minutes 30 seconds 0 millisecond (requested 450000 ms) |
| Down ramp length | 30 seconds 1 millisecond (requested 30000 ms) |
| Total test length | 11 minutes 56 seconds 771 milliseconds |
| State name | % of total | Count | Errors | Minimum Time | Maximum Time | Average Time |
|---|---|---|---|---|---|---|
Home | 9 % | 2555 | 0 | 0 ms | 21019 ms | 1784 ms
|
Register | 1 % | 380 | 0 | 0 ms | 9009 ms | 434 ms
|
RegisterUser | 1 % | 357 | 2 | 5 ms | 9114 ms | 514 ms
|
Browse | 9 % | 2516 | 0 | 0 ms | 9827 ms | 470 ms
|
BrowseCategories | 6 % | 1681 | 0 | 3 ms | 9822 ms | 377 ms
|
SearchItemsInCategory | 14 % | 3813 | 0 | 0 ms | 9087 ms | 274 ms
|
BrowseRegions | 2 % | 669 | 0 | 3 ms | 9828 ms | 401 ms
|
BrowseCategoriesInRegion | 2 % | 616 | 0 | 3 ms | 9119 ms | 449 ms
|
SearchItemsInRegion | 4 % | 1256 | 0 | 0 ms | 13872 ms | 263 ms
|
ViewItem | 12 % | 3248 | 0 | 3 ms | 9189 ms | 278 ms
|
ViewUserInfo | 2 % | 580 | 0 | 3 ms | 9016 ms | 310 ms
|
ViewBidHistory | 1 % | 277 | 0 | 3 ms | 9025 ms | 338 ms
|
BuyNowAuth | 1 % | 295 | 0 | 2 ms | 9821 ms | 213 ms
|
BuyNow | 1 % | 280 | 40 | 3 ms | 9017 ms | 212 ms
|
StoreBuyBow | 0 % | 197 | 0 | 4 ms | 9014 ms | 172 ms
|
PutBidAuth | 4 % | 1157 | 0 | 0 ms | 9143 ms | 265 ms
|
PutBid | 4 % | 1123 | 177 | 3 ms | 9167 ms | 266 ms
|
StoreBid | 2 % | 630 | 0 | 4 ms | 9032 ms | 206 ms
|
PutCommentAuth | 0 % | 0 | 0 | 0 ms | 0 ms | 0 ms
|
PutComment | 0 % | 96 | 9 | 4 ms | 9008 ms | 394 ms
|
StoreComment | 0 % | 73 | 0 | 4 ms | 5889 ms | 146 ms
|
Sell | 0 % | 190 | 0 | 0 ms | 9821 ms | 481 ms
|
SelectCategoryToSellItem | 0 % | 173 | 0 | 4 ms | 9007 ms | 119 ms
|
SellItemForm | 0 % | 164 | 0 | 2 ms | 8995 ms | 207 ms
|
RegisterItem | 0 % | 151 | 0 | 4 ms | 9139 ms | 480 ms
|
AboutMe (auth form) | 2 % | 565 | 0 | 0 ms | 9081 ms | 583 ms
|
AboutMe | 3 % | 786 | 0 | 4 ms | 9120 ms | 436 ms
|
Back probability | 7 % | 1940 | 0 | 0 ms | 0 ms | 0 ms
|
End of Session | 1 % | 280 | 0 | 0 ms | 0 ms | 0 ms
|
Total | 100 % | 26048 | 228 | - | - | 443 ms
|
Average throughput | 218 req/s
| |||||
Completed sessions | 254
| |||||
Total time | 13007 seconds
| |||||
Average session time | 51 seconds
| |||||
| State name | % of total | Count | Errors | Minimum Time | Maximum Time | Average Time |
|---|---|---|---|---|---|---|
Home | 4 % | 5161 | 0 | 0 ms | 512 ms | 0 ms
|
Register | 1 % | 1207 | 0 | 0 ms | 296 ms | 1 ms
|
RegisterUser | 1 % | 1190 | 8 | 4 ms | 263 ms | 9 ms
|
Browse | 7 % | 8097 | 0 | 0 ms | 517 ms | 1 ms
|
BrowseCategories | 5 % | 5648 | 0 | 3 ms | 430 ms | 6 ms
|
SearchItemsInCategory | 15 % | 17397 | 0 | 0 ms | 704 ms | 6 ms
|
BrowseRegions | 2 % | 2370 | 0 | 3 ms | 462 ms | 6 ms
|
BrowseCategoriesInRegion | 2 % | 2328 | 0 | 3 ms | 457 ms | 6 ms
|
SearchItemsInRegion | 5 % | 5596 | 0 | 0 ms | 505 ms | 12 ms
|
ViewItem | 14 % | 15816 | 0 | 3 ms | 491 ms | 9 ms
|
ViewUserInfo | 3 % | 3692 | 0 | 3 ms | 429 ms | 8 ms
|
ViewBidHistory | 1 % | 1994 | 0 | 3 ms | 298 ms | 17 ms
|
BuyNowAuth | 1 % | 1408 | 0 | 2 ms | 472 ms | 4 ms
|
BuyNow | 1 % | 1382 | 211 | 3 ms | 336 ms | 9 ms
|
StoreBuyBow | 1 % | 1184 | 0 | 4 ms | 649 ms | 9 ms
|
PutBidAuth | 4 % | 5445 | 0 | 0 ms | 473 ms | 3 ms
|
PutBid | 5 % | 6244 | 741 | 3 ms | 536 ms | 10 ms
|
StoreBid | 3 % | 4067 | 1 | 4 ms | 815 ms | 9 ms
|
PutCommentAuth | 0 % | 0 | 0 | 0 ms | 0 ms | 0 ms
|
PutComment | 0 % | 570 | 50 | 3 ms | 519 ms | 10 ms
|
StoreComment | 0 % | 508 | 0 | 4 ms | 38 ms | 8 ms
|
Sell | 0 % | 615 | 0 | 0 ms | 6 ms | 0 ms
|
SelectCategoryToSellItem | 0 % | 599 | 0 | 3 ms | 30 ms | 7 ms
|
SellItemForm | 0 % | 589 | 0 | 2 ms | 360 ms | 4 ms
|
RegisterItem | 0 % | 576 | 0 | 4 ms | 829 ms | 11 ms
|
AboutMe (auth form) | 1 % | 1840 | 0 | 0 ms | 425 ms | 1 ms
|
AboutMe | 2 % | 3089 | 0 | 4 ms | 491 ms | 21 ms
|
Back probability | 10 % | 11512 | 0 | 0 ms | 0 ms | 0 ms
|
End of Session | 1 % | 1607 | 0 | 0 ms | 0 ms | 0 ms
|
Total | 100 % | 111731 | 1011 | - | - | 6 ms
|
Average throughput | 250 req/s
| |||||
Completed sessions | 1608
| |||||
Total time | 394004 seconds
| |||||
Average session time | 245 seconds
| |||||
| State name | % of total | Count | Errors | Minimum Time | Maximum Time | Average Time |
|---|---|---|---|---|---|---|
Home | 3 % | 134 | 0 | 0 ms | 3 ms | 0 ms
|
Register | 1 % | 50 | 0 | 0 ms | 3 ms | 0 ms
|
RegisterUser | 1 % | 39 | 0 | 5 ms | 13 ms | 8 ms
|
Browse | 6 % | 244 | 0 | 0 ms | 4 ms | 0 ms
|
BrowseCategories | 4 % | 173 | 0 | 3 ms | 32 ms | 5 ms
|
SearchItemsInCategory | 16 % | 600 | 0 | 0 ms | 30 ms | 5 ms
|
BrowseRegions | 2 % | 75 | 0 | 3 ms | 13 ms | 4 ms
|
BrowseCategoriesInRegion | 1 % | 71 | 0 | 3 ms | 9 ms | 4 ms
|
SearchItemsInRegion | 4 % | 159 | 0 | 0 ms | 99 ms | 9 ms
|
ViewItem | 14 % | 543 | 0 | 3 ms | 78 ms | 8 ms
|
ViewUserInfo | 3 % | 122 | 0 | 3 ms | 13 ms | 5 ms
|
ViewBidHistory | 1 % | 72 | 0 | 2 ms | 60 ms | 12 ms
|
BuyNowAuth | 1 % | 58 | 0 | 2 ms | 7 ms | 2 ms
|
BuyNow | 1 % | 54 | 4 | 5 ms | 14 ms | 4 ms
|
StoreBuyBow | 0 % | 32 | 0 | 4 ms | 12 ms | 5 ms
|
PutBidAuth | 5 % | 184 | 0 | 0 ms | 23 ms | 2 ms
|
PutBid | 5 % | 205 | 17 | 3 ms | 37 ms | 7 ms
|
StoreBid | 3 % | 124 | 0 | 4 ms | 32 ms | 7 ms
|
PutCommentAuth | 0 % | 0 | 0 | 0 ms | 0 ms | 0 ms
|
PutComment | 0 % | 14 | 0 | 3 ms | 10 ms | 9 ms
|
StoreComment | 0 % | 20 | 0 | 5 ms | 14 ms | 6 ms
|
Sell | 0 % | 13 | 0 | 0 ms | 3 ms | 1 ms
|
SelectCategoryToSellItem | 0 % | 20 | 0 | 4 ms | 11 ms | 5 ms
|
SellItemForm | 0 % | 20 | 0 | 2 ms | 6 ms | 3 ms
|
RegisterItem | 0 % | 20 | 0 | 4 ms | 16 ms | 5 ms
|
AboutMe (auth form) | 1 % | 61 | 0 | 0 ms | 4 ms | 0 ms
|
AboutMe | 2 % | 101 | 0 | 4 ms | 47 ms | 18 ms
|
Back probability | 10 % | 383 | 0 | 0 ms | 0 ms | 0 ms
|
End of Session | 1 % | 41 | 0 | 0 ms | 0 ms | 0 ms
|
Total | 100 % | 3632 | 21 | - | - | 5 ms
|
Average throughput | 121 req/s
| |||||
Completed sessions | 46
| |||||
Total time | 12969 seconds
| |||||
Average session time | 281 seconds
| |||||
| State name | % of total | Count | Errors | Minimum Time | Maximum Time | Average Time |
|---|---|---|---|---|---|---|
Home | 5 % | 7850 | 0 | 0 ms | 21019 ms | 581 ms
|
Register | 1 % | 1637 | 0 | 0 ms | 9009 ms | 101 ms
|
RegisterUser | 1 % | 1586 | 10 | 4 ms | 9114 ms | 123 ms
|
Browse | 7 % | 10857 | 0 | 0 ms | 9827 ms | 110 ms
|
BrowseCategories | 5 % | 7502 | 0 | 3 ms | 9822 ms | 89 ms
|
SearchItemsInCategory | 15 % | 21889 | 0 | 0 ms | 9087 ms | 53 ms
|
BrowseRegions | 2 % | 3114 | 0 | 3 ms | 9828 ms | 91 ms
|
BrowseCategoriesInRegion | 2 % | 3015 | 0 | 3 ms | 9119 ms | 96 ms
|
SearchItemsInRegion | 4 % | 7028 | 0 | 0 ms | 13872 ms | 57 ms
|
ViewItem | 13 % | 19641 | 0 | 3 ms | 9189 ms | 54 ms
|
ViewUserInfo | 3 % | 4406 | 0 | 3 ms | 9016 ms | 47 ms
|
ViewBidHistory | 1 % | 2346 | 0 | 2 ms | 9025 ms | 55 ms
|
BuyNowAuth | 1 % | 1761 | 0 | 2 ms | 9821 ms | 39 ms
|
BuyNow | 1 % | 1716 | 255 | 3 ms | 9017 ms | 42 ms
|
StoreBuyBow | 0 % | 1413 | 0 | 4 ms | 9014 ms | 32 ms
|
PutBidAuth | 4 % | 6786 | 0 | 0 ms | 9143 ms | 48 ms
|
PutBid | 5 % | 7586 | 935 | 3 ms | 9167 ms | 48 ms
|
StoreBid | 3 % | 4821 | 1 | 4 ms | 9032 ms | 35 ms
|
PutCommentAuth | 0 % | 0 | 0 | 0 ms | 0 ms | 0 ms
|
PutComment | 0 % | 680 | 59 | 3 ms | 9008 ms | 64 ms
|
StoreComment | 0 % | 601 | 0 | 4 ms | 5889 ms | 25 ms
|
Sell | 0 % | 818 | 0 | 0 ms | 9821 ms | 112 ms
|
SelectCategoryToSellItem | 0 % | 792 | 0 | 3 ms | 9007 ms | 31 ms
|
SellItemForm | 0 % | 773 | 0 | 2 ms | 8995 ms | 47 ms
|
RegisterItem | 0 % | 747 | 0 | 4 ms | 9139 ms | 105 ms
|
AboutMe (auth form) | 1 % | 2466 | 0 | 0 ms | 9081 ms | 134 ms
|
AboutMe | 2 % | 4003 | 0 | 4 ms | 9120 ms | 102 ms
|
Back probability | 9 % | 13835 | 0 | 0 ms | 0 ms | 0 ms
|
End of Session | 1 % | 1928 | 0 | 0 ms | 0 ms | 0 ms
|
Total | 100 % | 141597 | 1260 | - | - | 87 ms
|
Average throughput | 238 req/s
| |||||
Completed sessions | 1927
| |||||
Total time | 426587 seconds
| |||||
Average session time | 221 seconds
| |||||
An error occured while waiting for remote processes termination (Skipping waits)
Command is: /usr/bin/scp farm6.csail.mit.edu:/tmp/client1 /home/drkp/sandbox/txcache/src/RUBiS-1.4.3/bench/2009-3-19@6:17:30//client1.bin
Command is: /usr/bin/ssh -x localhost /bin/bash -c 'LANG=en_GB.UTF-8 /usr/bin/sar -n DEV -n SOCK -rubcw 1 605 -f /home/drkp/sandbox/txcache/src/RUBiS-1.4.3/bench/2009-3-19@6:17:30//client1.bin > /home/drkp/sandbox/txcache/src/RUBiS-1.4.3/bench/2009-3-19@6:17:30//client1'
Command is: /usr/bin/scp farm14:/tmp/db_server0 /home/drkp/sandbox/txcache/src/RUBiS-1.4.3/bench/2009-3-19@6:17:30//db_server0.bin
Command is: /usr/bin/ssh -x localhost /bin/bash -c 'LANG=en_GB.UTF-8 /usr/bin/sar -n DEV -n SOCK -rubcw 1 605 -f /home/drkp/sandbox/txcache/src/RUBiS-1.4.3/bench/2009-3-19@6:17:30//db_server0.bin > /home/drkp/sandbox/txcache/src/RUBiS-1.4.3/bench/2009-3-19@6:17:30//db_server0'
Command is: /usr/bin/scp farm12.csail.mit.edu:/tmp/web_server0 /home/drkp/sandbox/txcache/src/RUBiS-1.4.3/bench/2009-3-19@6:17:30//web_server0.bin
Command is: /usr/bin/ssh -x localhost /bin/bash -c 'LANG=en_GB.UTF-8 /usr/bin/sar -n DEV -n SOCK -rubcw 1 605 -f /home/drkp/sandbox/txcache/src/RUBiS-1.4.3/bench/2009-3-19@6:17:30//web_server0.bin > /home/drkp/sandbox/txcache/src/RUBiS-1.4.3/bench/2009-3-19@6:17:30//web_server0'
Command is: /usr/bin/scp farm13.csail.mit.edu:/tmp/web_server1 /home/drkp/sandbox/txcache/src/RUBiS-1.4.3/bench/2009-3-19@6:17:30//web_server1.bin
Command is: /usr/bin/ssh -x localhost /bin/bash -c 'LANG=en_GB.UTF-8 /usr/bin/sar -n DEV -n SOCK -rubcw 1 605 -f /home/drkp/sandbox/txcache/src/RUBiS-1.4.3/bench/2009-3-19@6:17:30//web_server1.bin > /home/drkp/sandbox/txcache/src/RUBiS-1.4.3/bench/2009-3-19@6:17:30//web_server1'
Command is: /usr/bin/scp localhost:/tmp/client0 /home/drkp/sandbox/txcache/src/RUBiS-1.4.3/bench/2009-3-19@6:17:30//client0.bin
Command is: /usr/bin/ssh -x localhost /bin/bash -c 'LANG=en_GB.UTF-8 /usr/bin/sar -n DEV -n SOCK -rubcw 1 605 -f /home/drkp/sandbox/txcache/src/RUBiS-1.4.3/bench/2009-3-19@6:17:30//client0.bin > /home/drkp/sandbox/txcache/src/RUBiS-1.4.3/bench/2009-3-19@6:17:30//client0'
Command is: /usr/bin/scp farm6.csail.mit.edu:/tmp/trace_client1.html /home/drkp/sandbox/txcache/src/RUBiS-1.4.3/bench/2009-3-19@6:17:30//
Command is: /usr/bin/scp farm6.csail.mit.edu:/tmp/stat_client1.html /home/drkp/sandbox/txcache/src/RUBiS-1.4.3/bench/2009-3-19@6:17:30//
|
|
|
|
|
|
 | 
|
 | 
|
 | 
|
 | 
|
 | 
|
 | 
|
 | 
|
 | 
|
 | 
|