Node information
Test timing information
Up ramp statistics
Runtime session statistics
Down ramp statistics
Overall statistics
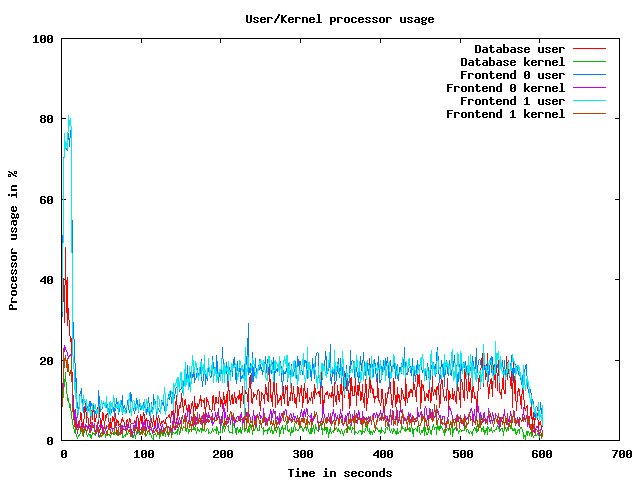
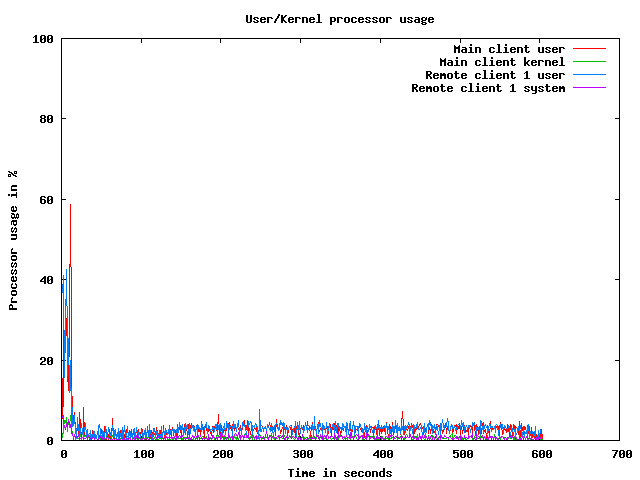
CPU usage graphs
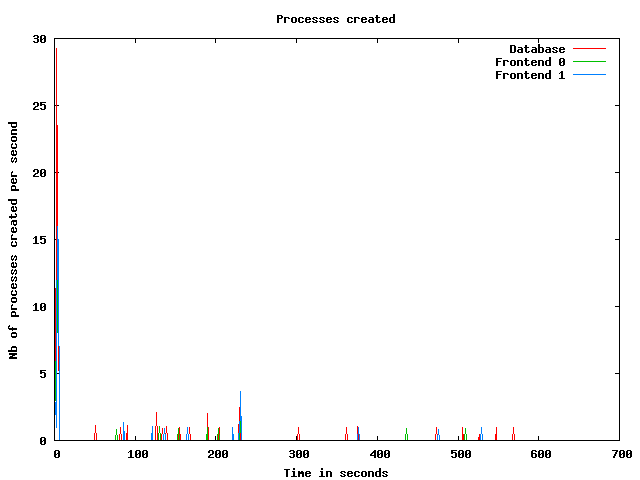
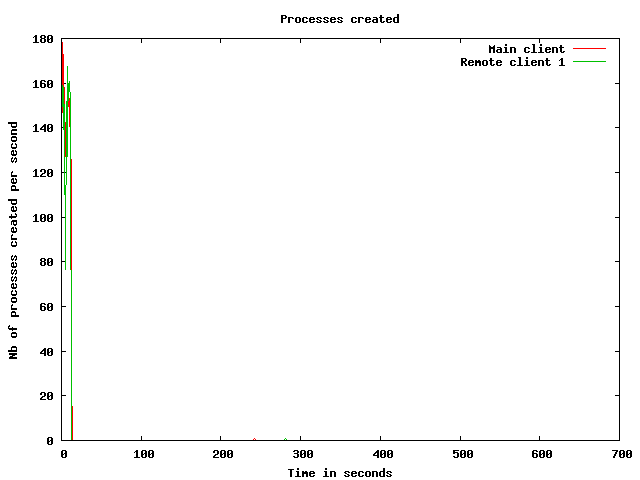
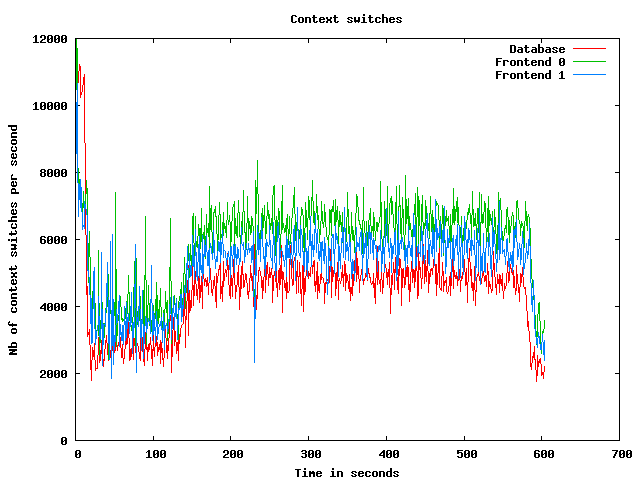
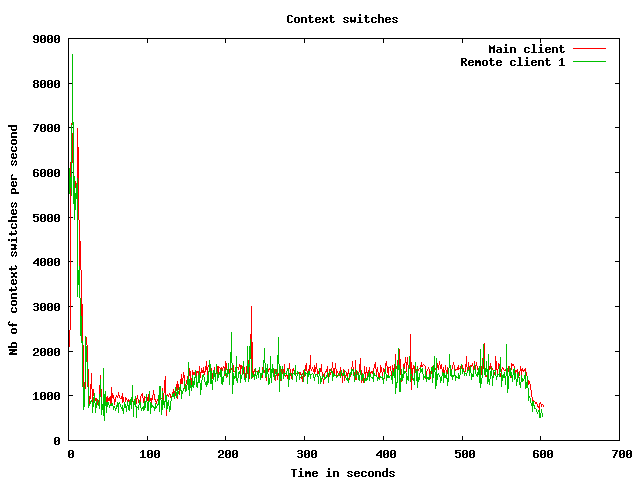
Processes usage graphs
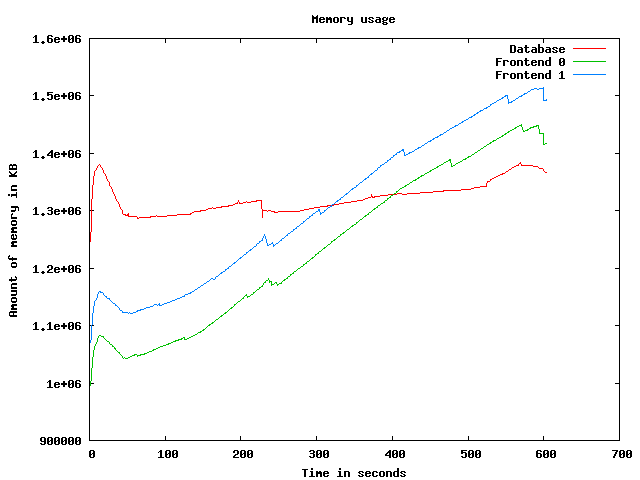
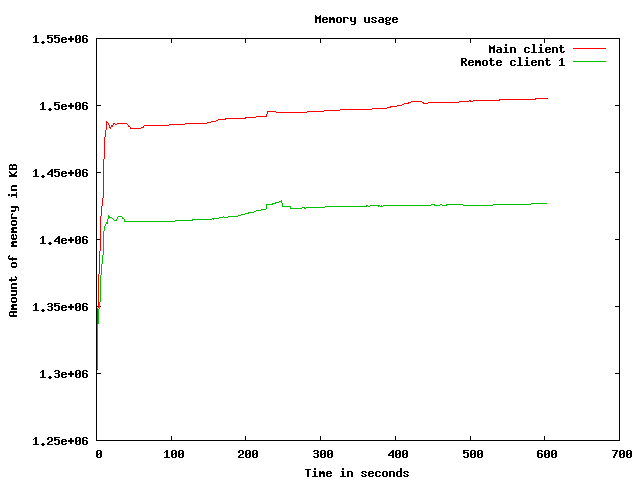
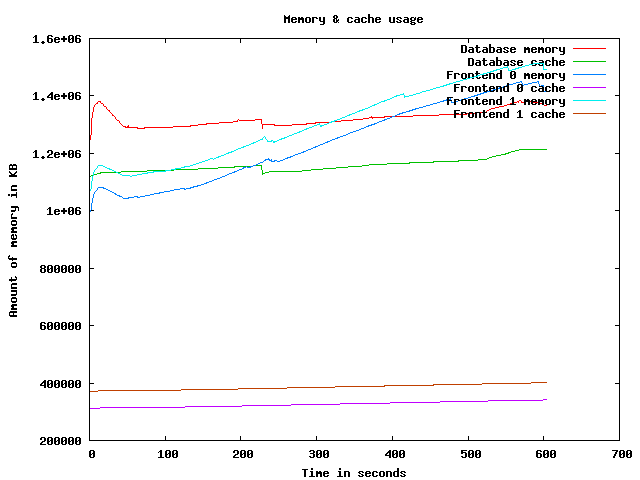
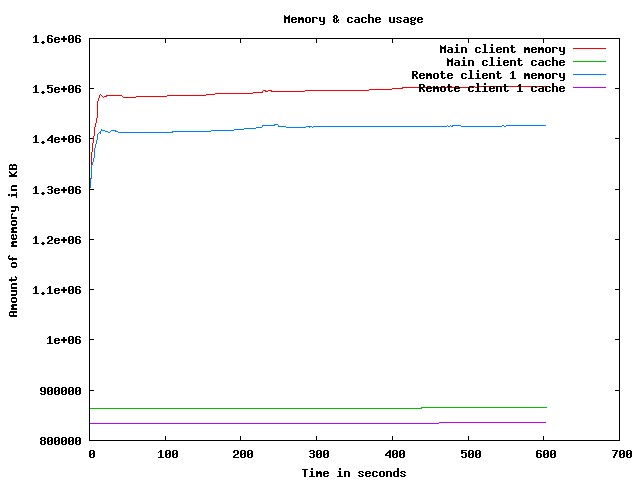
Memory usage graph
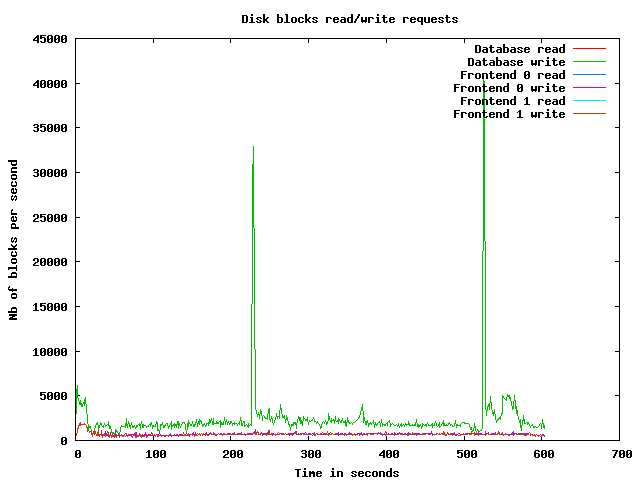
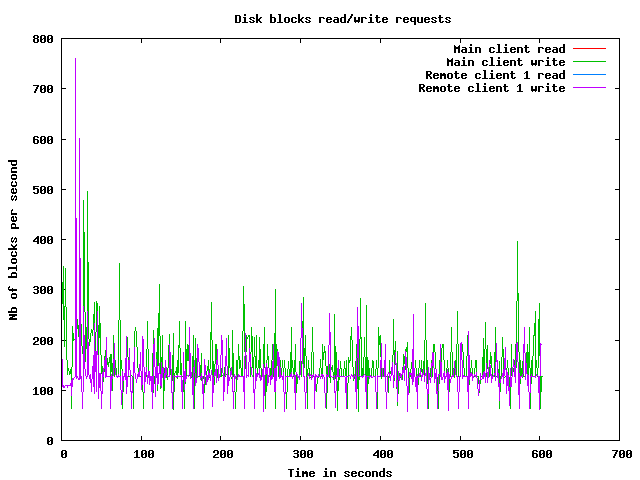
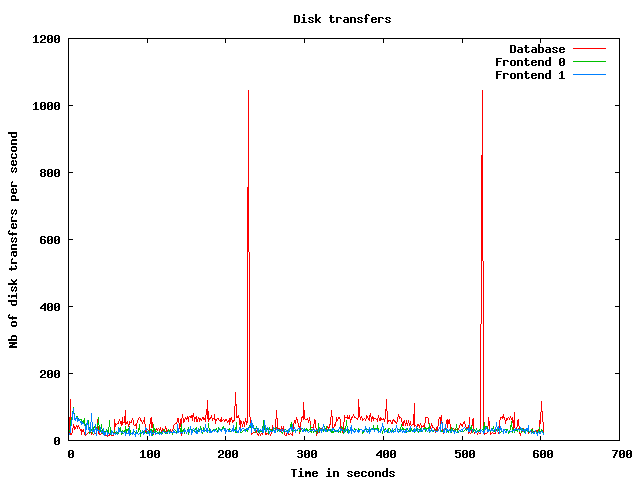
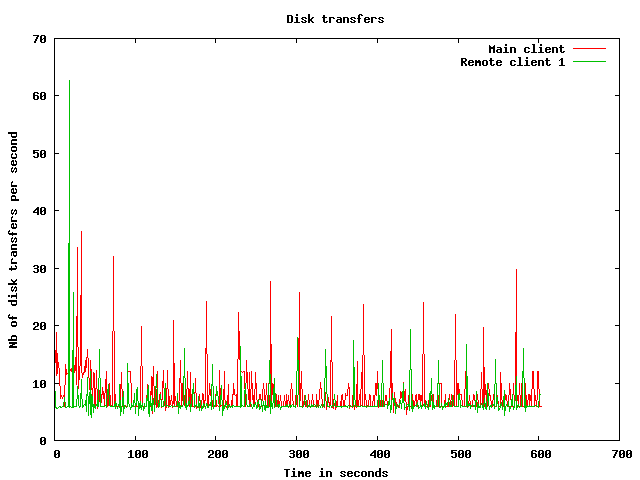
Disk usage graphs
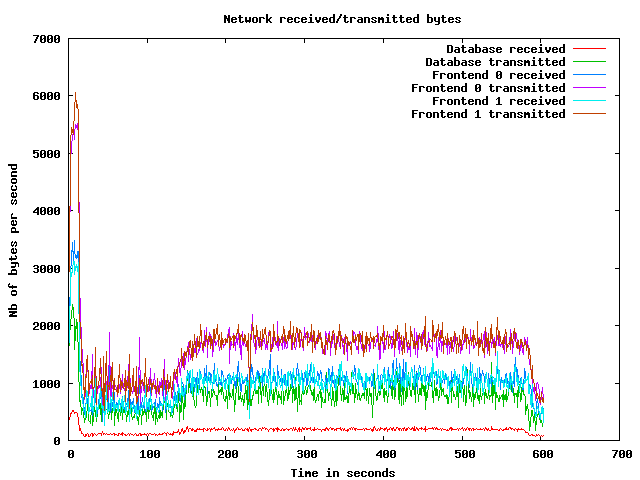
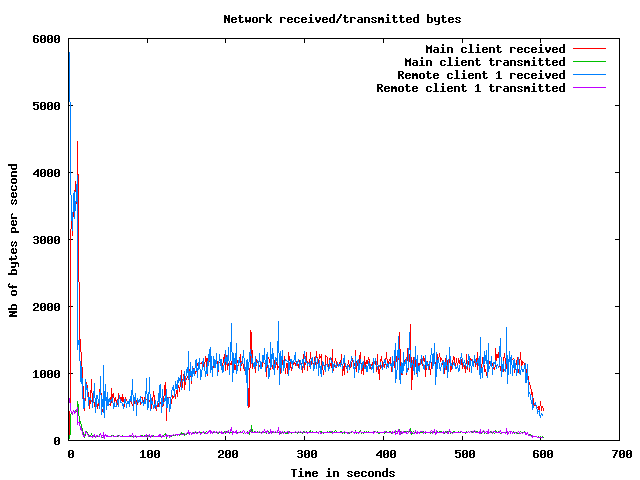
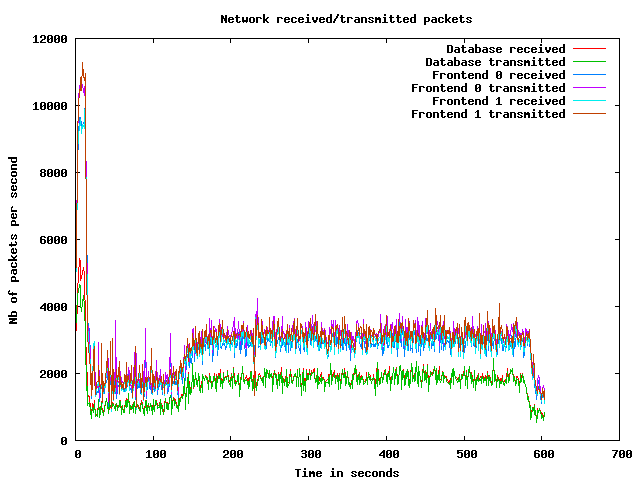
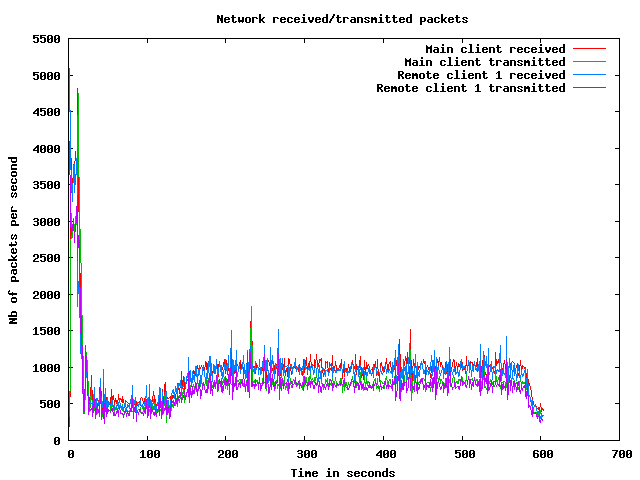
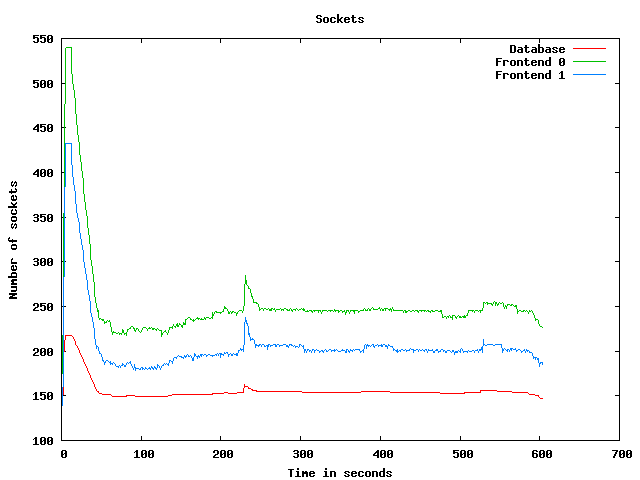
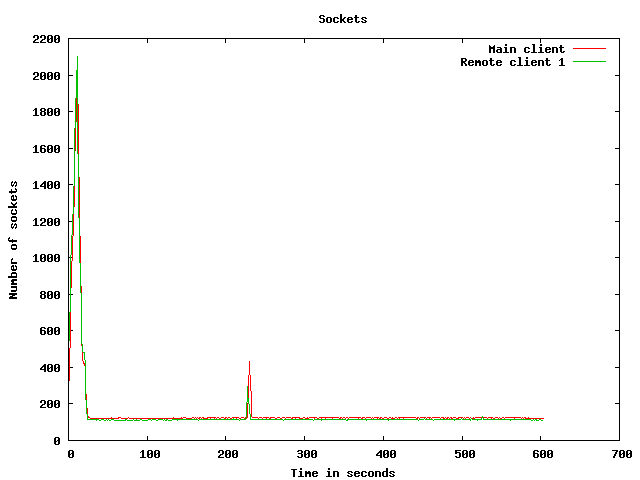
Network usage graphs
| Test start | 2009-3-19 6:30:11 |
| Up ramp start | 2009-3-19 6:30:25 |
| Runtime session start | 2009-3-19 6:32:25 |
| Down ramp start | 2009-3-19 6:39:55 |
| Test end | 2009-3-19 6:42:20 |
| Up ramp length | 2 minutes 1 millisecond (requested 120000 ms) |
| Runtime session length | 7 minutes 30 seconds 0 millisecond (requested 450000 ms) |
| Down ramp length | 30 seconds 0 millisecond (requested 30000 ms) |
| Total test length | 12 minutes 9 seconds 328 milliseconds |
| State name | % of total | Count | Errors | Minimum Time | Maximum Time | Average Time |
|---|---|---|---|---|---|---|
Home | 9 % | 3362 | 0 | 0 ms | 21169 ms | 2355 ms
|
Register | 1 % | 495 | 0 | 0 ms | 21146 ms | 392 ms
|
RegisterUser | 1 % | 463 | 8 | 4 ms | 21007 ms | 573 ms
|
Browse | 9 % | 3316 | 0 | 0 ms | 21165 ms | 725 ms
|
BrowseCategories | 6 % | 2270 | 0 | 3 ms | 21117 ms | 500 ms
|
SearchItemsInCategory | 14 % | 5192 | 0 | 0 ms | 21014 ms | 370 ms
|
BrowseRegions | 2 % | 869 | 0 | 3 ms | 21141 ms | 431 ms
|
BrowseCategoriesInRegion | 2 % | 800 | 0 | 3 ms | 21016 ms | 383 ms
|
SearchItemsInRegion | 4 % | 1542 | 0 | 0 ms | 21011 ms | 394 ms
|
ViewItem | 12 % | 4370 | 0 | 3 ms | 21138 ms | 336 ms
|
ViewUserInfo | 2 % | 809 | 0 | 3 ms | 21011 ms | 283 ms
|
ViewBidHistory | 1 % | 430 | 0 | 3 ms | 21014 ms | 342 ms
|
BuyNowAuth | 1 % | 394 | 0 | 2 ms | 9813 ms | 276 ms
|
BuyNow | 1 % | 354 | 66 | 3 ms | 21005 ms | 384 ms
|
StoreBuyBow | 0 % | 250 | 0 | 4 ms | 9227 ms | 337 ms
|
PutBidAuth | 4 % | 1498 | 0 | 0 ms | 21004 ms | 279 ms
|
PutBid | 4 % | 1492 | 214 | 3 ms | 21020 ms | 306 ms
|
StoreBid | 2 % | 845 | 0 | 4 ms | 21005 ms | 280 ms
|
PutCommentAuth | 0 % | 0 | 0 | 0 ms | 0 ms | 0 ms
|
PutComment | 0 % | 126 | 11 | 4 ms | 9029 ms | 360 ms
|
StoreComment | 0 % | 93 | 0 | 4 ms | 10054 ms | 399 ms
|
Sell | 0 % | 252 | 0 | 0 ms | 13892 ms | 608 ms
|
SelectCategoryToSellItem | 0 % | 232 | 0 | 3 ms | 21009 ms | 426 ms
|
SellItemForm | 0 % | 218 | 0 | 2 ms | 21008 ms | 527 ms
|
RegisterItem | 0 % | 194 | 0 | 4 ms | 21003 ms | 682 ms
|
AboutMe (auth form) | 2 % | 790 | 0 | 0 ms | 21139 ms | 696 ms
|
AboutMe | 3 % | 1119 | 0 | 4 ms | 21042 ms | 499 ms
|
Back probability | 7 % | 2696 | 0 | 0 ms | 0 ms | 0 ms
|
End of Session | 1 % | 391 | 0 | 0 ms | 0 ms | 0 ms
|
Total | 100 % | 34862 | 299 | - | - | 572 ms
|
Average throughput | 293 req/s
| |||||
Completed sessions | 358
| |||||
Total time | 17331 seconds
| |||||
Average session time | 48 seconds
| |||||
| State name | % of total | Count | Errors | Minimum Time | Maximum Time | Average Time |
|---|---|---|---|---|---|---|
Home | 4 % | 6919 | 0 | 0 ms | 3004 ms | 2 ms
|
Register | 1 % | 1563 | 0 | 0 ms | 2998 ms | 7 ms
|
RegisterUser | 1 % | 1537 | 17 | 4 ms | 3009 ms | 19 ms
|
Browse | 7 % | 10576 | 0 | 0 ms | 3009 ms | 5 ms
|
BrowseCategories | 4 % | 7410 | 0 | 3 ms | 3027 ms | 10 ms
|
SearchItemsInCategory | 15 % | 23177 | 0 | 0 ms | 3024 ms | 14 ms
|
BrowseRegions | 2 % | 3041 | 0 | 3 ms | 3001 ms | 10 ms
|
BrowseCategoriesInRegion | 2 % | 3006 | 0 | 3 ms | 3011 ms | 13 ms
|
SearchItemsInRegion | 4 % | 7318 | 0 | 0 ms | 3035 ms | 18 ms
|
ViewItem | 14 % | 21235 | 0 | 3 ms | 3037 ms | 15 ms
|
ViewUserInfo | 3 % | 4926 | 0 | 3 ms | 3031 ms | 17 ms
|
ViewBidHistory | 1 % | 2421 | 0 | 3 ms | 3010 ms | 23 ms
|
BuyNowAuth | 1 % | 1904 | 0 | 2 ms | 3016 ms | 11 ms
|
BuyNow | 1 % | 1874 | 292 | 3 ms | 3014 ms | 17 ms
|
StoreBuyBow | 1 % | 1553 | 0 | 4 ms | 3000 ms | 13 ms
|
PutBidAuth | 4 % | 7323 | 0 | 0 ms | 3019 ms | 7 ms
|
PutBid | 5 % | 8220 | 1072 | 3 ms | 3022 ms | 17 ms
|
StoreBid | 3 % | 5299 | 1 | 4 ms | 3022 ms | 18 ms
|
PutCommentAuth | 0 % | 0 | 0 | 0 ms | 0 ms | 0 ms
|
PutComment | 0 % | 731 | 57 | 3 ms | 3016 ms | 22 ms
|
StoreComment | 0 % | 665 | 0 | 4 ms | 3006 ms | 17 ms
|
Sell | 0 % | 841 | 0 | 0 ms | 2998 ms | 7 ms
|
SelectCategoryToSellItem | 0 % | 834 | 0 | 3 ms | 3009 ms | 15 ms
|
SellItemForm | 0 % | 817 | 0 | 2 ms | 33 ms | 4 ms
|
RegisterItem | 0 % | 811 | 0 | 4 ms | 3007 ms | 17 ms
|
AboutMe (auth form) | 1 % | 2571 | 0 | 0 ms | 3007 ms | 6 ms
|
AboutMe | 2 % | 4395 | 0 | 4 ms | 3049 ms | 28 ms
|
Back probability | 10 % | 15445 | 0 | 0 ms | 0 ms | 0 ms
|
End of Session | 1 % | 2102 | 0 | 0 ms | 0 ms | 0 ms
|
Total | 100 % | 148514 | 1439 | - | - | 11 ms
|
Average throughput | 333 req/s
| |||||
Completed sessions | 2103
| |||||
Total time | 519100 seconds
| |||||
Average session time | 246 seconds
| |||||
| State name | % of total | Count | Errors | Minimum Time | Maximum Time | Average Time |
|---|---|---|---|---|---|---|
Home | 5 % | 244 | 0 | 0 ms | 27 ms | 0 ms
|
Register | 1 % | 62 | 0 | 0 ms | 4 ms | 0 ms
|
RegisterUser | 1 % | 53 | 2 | 5 ms | 21 ms | 8 ms
|
Browse | 6 % | 338 | 0 | 0 ms | 27 ms | 0 ms
|
BrowseCategories | 4 % | 220 | 0 | 3 ms | 32 ms | 5 ms
|
SearchItemsInCategory | 14 % | 717 | 0 | 2 ms | 53 ms | 6 ms
|
BrowseRegions | 1 % | 93 | 0 | 3 ms | 31 ms | 5 ms
|
BrowseCategoriesInRegion | 1 % | 92 | 0 | 3 ms | 17 ms | 5 ms
|
SearchItemsInRegion | 4 % | 231 | 0 | 0 ms | 57 ms | 10 ms
|
ViewItem | 14 % | 688 | 0 | 3 ms | 48 ms | 8 ms
|
ViewUserInfo | 3 % | 180 | 0 | 3 ms | 41 ms | 7 ms
|
ViewBidHistory | 1 % | 87 | 0 | 3 ms | 67 ms | 16 ms
|
BuyNowAuth | 1 % | 69 | 0 | 2 ms | 32 ms | 4 ms
|
BuyNow | 1 % | 69 | 12 | 3 ms | 27 ms | 9 ms
|
StoreBuyBow | 1 % | 64 | 0 | 4 ms | 20 ms | 5 ms
|
PutBidAuth | 4 % | 234 | 0 | 0 ms | 33 ms | 3 ms
|
PutBid | 6 % | 313 | 41 | 3 ms | 47 ms | 8 ms
|
StoreBid | 3 % | 166 | 0 | 4 ms | 25 ms | 7 ms
|
PutCommentAuth | 0 % | 0 | 0 | 0 ms | 0 ms | 0 ms
|
PutComment | 0 % | 22 | 0 | 4 ms | 23 ms | 7 ms
|
StoreComment | 0 % | 21 | 0 | 4 ms | 22 ms | 9 ms
|
Sell | 0 % | 25 | 0 | 0 ms | 3 ms | 0 ms
|
SelectCategoryToSellItem | 0 % | 17 | 0 | 3 ms | 21 ms | 9 ms
|
SellItemForm | 0 % | 23 | 0 | 2 ms | 7 ms | 2 ms
|
RegisterItem | 0 % | 20 | 0 | 4 ms | 30 ms | 8 ms
|
AboutMe (auth form) | 1 % | 96 | 0 | 0 ms | 11 ms | 0 ms
|
AboutMe | 2 % | 140 | 0 | 4 ms | 59 ms | 18 ms
|
Back probability | 10 % | 509 | 0 | 0 ms | 0 ms | 0 ms
|
End of Session | 1 % | 69 | 0 | 0 ms | 0 ms | 0 ms
|
Total | 100 % | 4862 | 55 | - | - | 5 ms
|
Average throughput | 163 req/s
| |||||
Completed sessions | 73
| |||||
Total time | 25267 seconds
| |||||
Average session time | 346 seconds
| |||||
| State name | % of total | Count | Errors | Minimum Time | Maximum Time | Average Time |
|---|---|---|---|---|---|---|
Home | 5 % | 10525 | 0 | 0 ms | 21169 ms | 753 ms
|
Register | 1 % | 2120 | 0 | 0 ms | 21146 ms | 96 ms
|
RegisterUser | 1 % | 2053 | 27 | 4 ms | 21007 ms | 144 ms
|
Browse | 7 % | 14230 | 0 | 0 ms | 21165 ms | 173 ms
|
BrowseCategories | 5 % | 9900 | 0 | 3 ms | 21117 ms | 122 ms
|
SearchItemsInCategory | 15 % | 29182 | 0 | 0 ms | 21014 ms | 77 ms
|
BrowseRegions | 2 % | 4003 | 0 | 3 ms | 21141 ms | 101 ms
|
BrowseCategoriesInRegion | 2 % | 3898 | 0 | 3 ms | 21016 ms | 89 ms
|
SearchItemsInRegion | 4 % | 9112 | 0 | 0 ms | 21011 ms | 82 ms
|
ViewItem | 13 % | 26337 | 0 | 3 ms | 21138 ms | 68 ms
|
ViewUserInfo | 3 % | 5931 | 0 | 3 ms | 21011 ms | 53 ms
|
ViewBidHistory | 1 % | 2951 | 0 | 3 ms | 21014 ms | 69 ms
|
BuyNowAuth | 1 % | 2367 | 0 | 2 ms | 9813 ms | 55 ms
|
BuyNow | 1 % | 2297 | 370 | 3 ms | 21005 ms | 74 ms
|
StoreBuyBow | 0 % | 1867 | 0 | 4 ms | 9227 ms | 56 ms
|
PutBidAuth | 4 % | 9055 | 0 | 0 ms | 21004 ms | 52 ms
|
PutBid | 5 % | 10052 | 1327 | 3 ms | 21020 ms | 60 ms
|
StoreBid | 3 % | 6310 | 1 | 4 ms | 21005 ms | 53 ms
|
PutCommentAuth | 0 % | 0 | 0 | 0 ms | 0 ms | 0 ms
|
PutComment | 0 % | 879 | 68 | 3 ms | 9029 ms | 70 ms
|
StoreComment | 0 % | 779 | 0 | 4 ms | 10054 ms | 63 ms
|
Sell | 0 % | 1118 | 0 | 0 ms | 13892 ms | 143 ms
|
SelectCategoryToSellItem | 0 % | 1083 | 0 | 3 ms | 21009 ms | 103 ms
|
SellItemForm | 0 % | 1058 | 0 | 2 ms | 21008 ms | 111 ms
|
RegisterItem | 0 % | 1025 | 0 | 4 ms | 21003 ms | 143 ms
|
AboutMe (auth form) | 1 % | 3457 | 0 | 0 ms | 21139 ms | 163 ms
|
AboutMe | 3 % | 5686 | 0 | 4 ms | 21042 ms | 120 ms
|
Back probability | 9 % | 18650 | 0 | 0 ms | 0 ms | 0 ms
|
End of Session | 1 % | 2562 | 0 | 0 ms | 0 ms | 0 ms
|
Total | 100 % | 188487 | 1793 | - | - | 115 ms
|
Average throughput | 317 req/s
| |||||
Completed sessions | 2562
| |||||
Total time | 572874 seconds
| |||||
Average session time | 223 seconds
| |||||
An error occured while waiting for remote processes termination (Skipping waits)
Command is: /usr/bin/scp farm6.csail.mit.edu:/tmp/client1 /home/drkp/sandbox/txcache/src/RUBiS-1.4.3/bench/2009-3-19@6:30:11//client1.bin
Command is: /usr/bin/ssh -x localhost /bin/bash -c 'LANG=en_GB.UTF-8 /usr/bin/sar -n DEV -n SOCK -rubcw 1 605 -f /home/drkp/sandbox/txcache/src/RUBiS-1.4.3/bench/2009-3-19@6:30:11//client1.bin > /home/drkp/sandbox/txcache/src/RUBiS-1.4.3/bench/2009-3-19@6:30:11//client1'
Command is: /usr/bin/scp farm14:/tmp/db_server0 /home/drkp/sandbox/txcache/src/RUBiS-1.4.3/bench/2009-3-19@6:30:11//db_server0.bin
Command is: /usr/bin/ssh -x localhost /bin/bash -c 'LANG=en_GB.UTF-8 /usr/bin/sar -n DEV -n SOCK -rubcw 1 605 -f /home/drkp/sandbox/txcache/src/RUBiS-1.4.3/bench/2009-3-19@6:30:11//db_server0.bin > /home/drkp/sandbox/txcache/src/RUBiS-1.4.3/bench/2009-3-19@6:30:11//db_server0'
Command is: /usr/bin/scp farm12.csail.mit.edu:/tmp/web_server0 /home/drkp/sandbox/txcache/src/RUBiS-1.4.3/bench/2009-3-19@6:30:11//web_server0.bin
Command is: /usr/bin/ssh -x localhost /bin/bash -c 'LANG=en_GB.UTF-8 /usr/bin/sar -n DEV -n SOCK -rubcw 1 605 -f /home/drkp/sandbox/txcache/src/RUBiS-1.4.3/bench/2009-3-19@6:30:11//web_server0.bin > /home/drkp/sandbox/txcache/src/RUBiS-1.4.3/bench/2009-3-19@6:30:11//web_server0'
Command is: /usr/bin/scp farm13.csail.mit.edu:/tmp/web_server1 /home/drkp/sandbox/txcache/src/RUBiS-1.4.3/bench/2009-3-19@6:30:11//web_server1.bin
Command is: /usr/bin/ssh -x localhost /bin/bash -c 'LANG=en_GB.UTF-8 /usr/bin/sar -n DEV -n SOCK -rubcw 1 605 -f /home/drkp/sandbox/txcache/src/RUBiS-1.4.3/bench/2009-3-19@6:30:11//web_server1.bin > /home/drkp/sandbox/txcache/src/RUBiS-1.4.3/bench/2009-3-19@6:30:11//web_server1'
Command is: /usr/bin/scp localhost:/tmp/client0 /home/drkp/sandbox/txcache/src/RUBiS-1.4.3/bench/2009-3-19@6:30:11//client0.bin
Command is: /usr/bin/ssh -x localhost /bin/bash -c 'LANG=en_GB.UTF-8 /usr/bin/sar -n DEV -n SOCK -rubcw 1 605 -f /home/drkp/sandbox/txcache/src/RUBiS-1.4.3/bench/2009-3-19@6:30:11//client0.bin > /home/drkp/sandbox/txcache/src/RUBiS-1.4.3/bench/2009-3-19@6:30:11//client0'
Command is: /usr/bin/scp farm6.csail.mit.edu:/tmp/trace_client1.html /home/drkp/sandbox/txcache/src/RUBiS-1.4.3/bench/2009-3-19@6:30:11//
Command is: /usr/bin/scp farm6.csail.mit.edu:/tmp/stat_client1.html /home/drkp/sandbox/txcache/src/RUBiS-1.4.3/bench/2009-3-19@6:30:11//
|
|
|
|
|
|
 | 
|
 | 
|
 | 
|
 | 
|
 | 
|
 | 
|
 | 
|
 | 
|
 | 
|