Node information
Test timing information
Up ramp statistics
Runtime session statistics
Down ramp statistics
Overall statistics
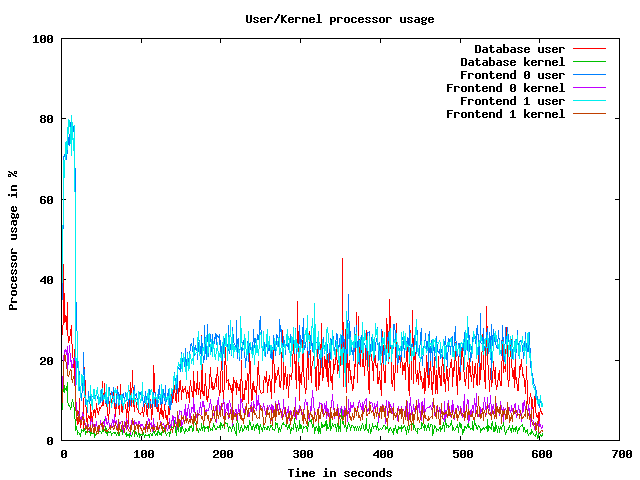
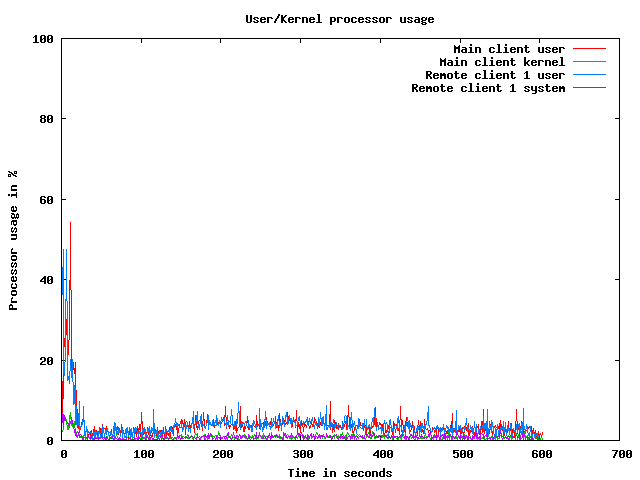
CPU usage graphs
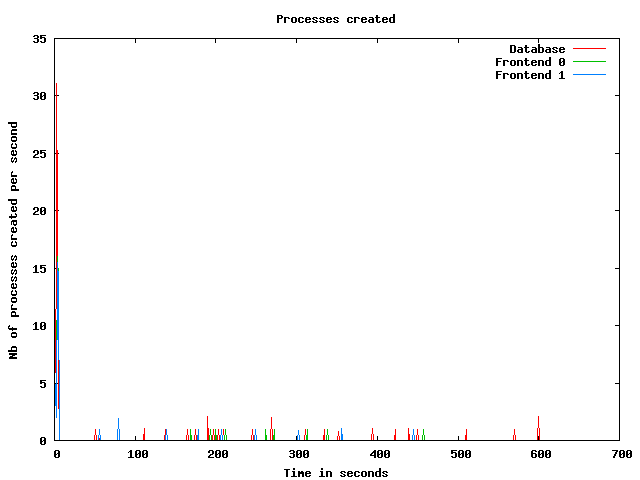
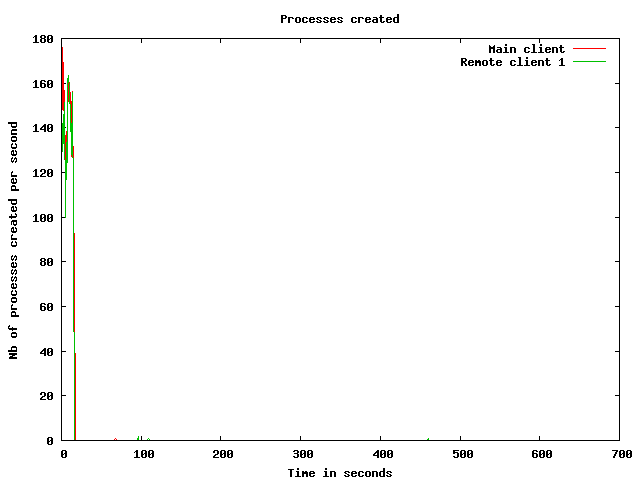
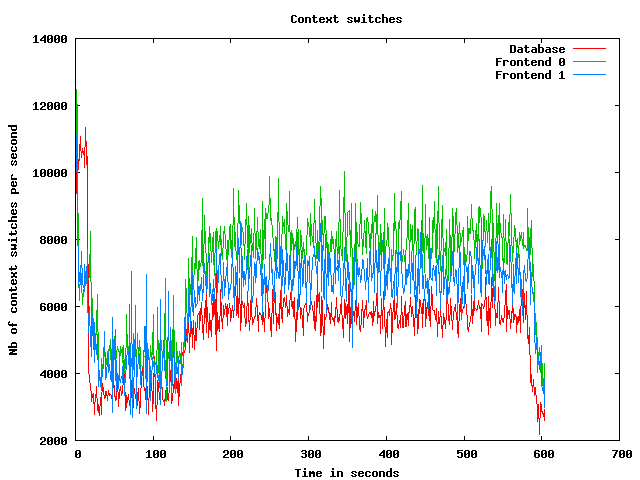
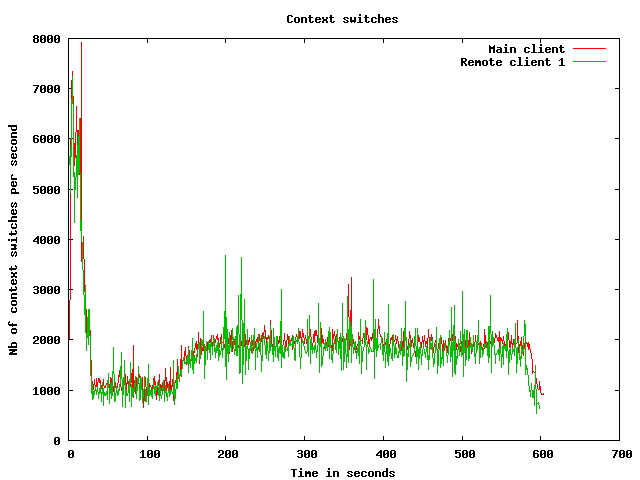
Processes usage graphs
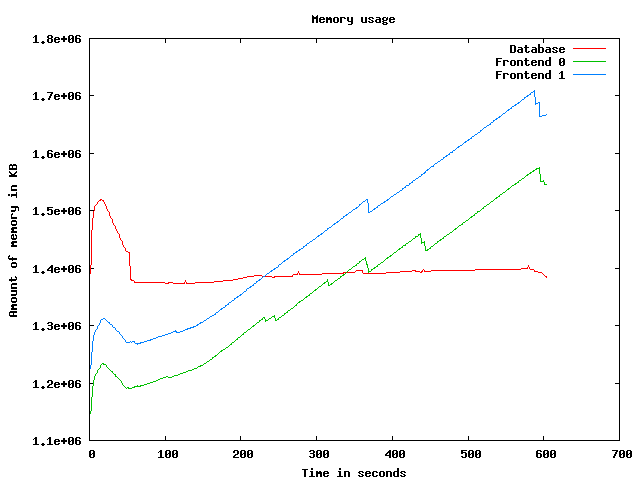
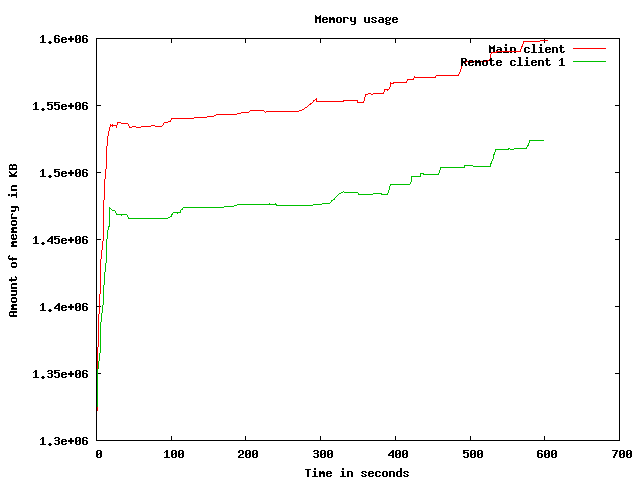
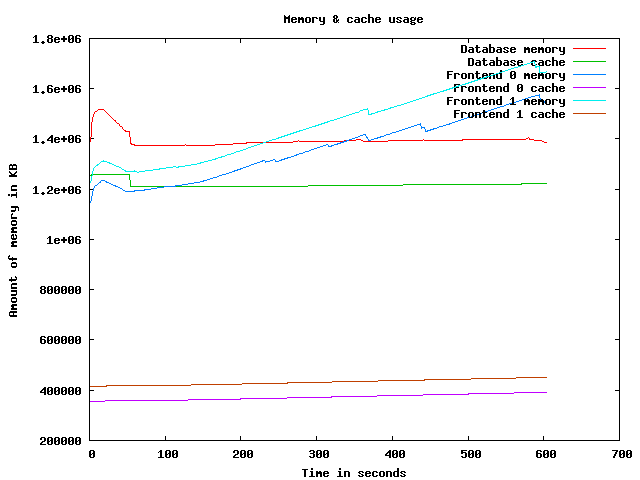
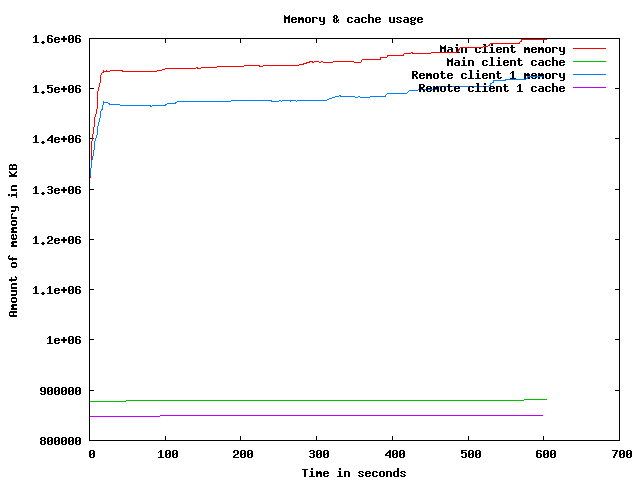
Memory usage graph
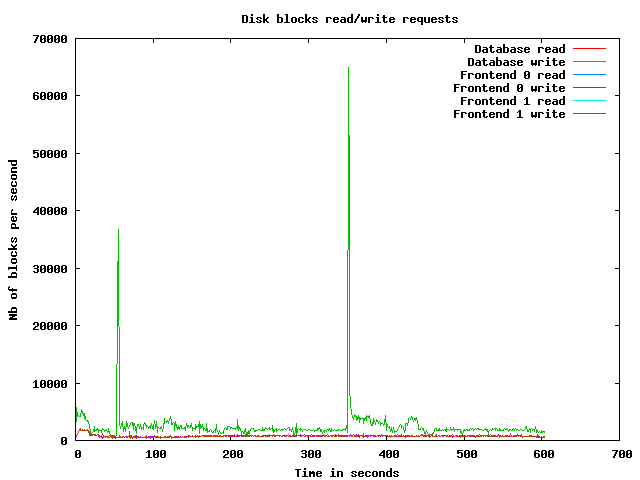
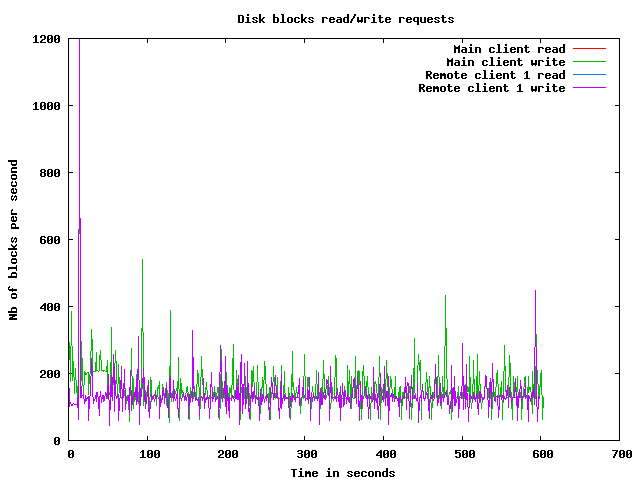
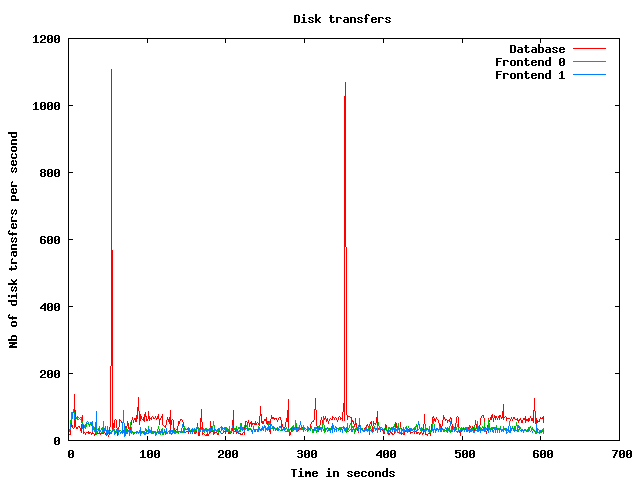
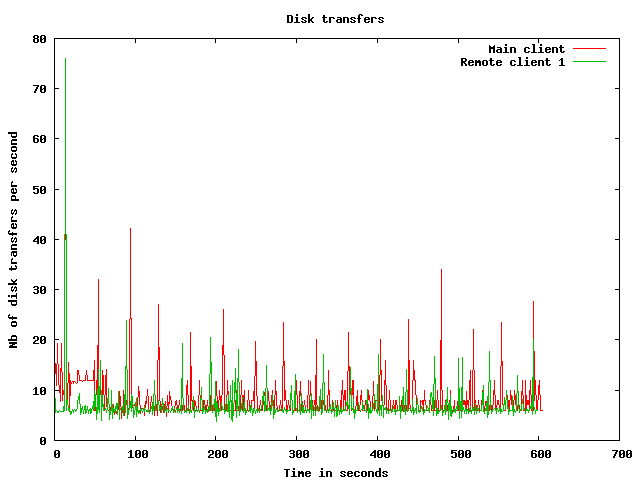
Disk usage graphs
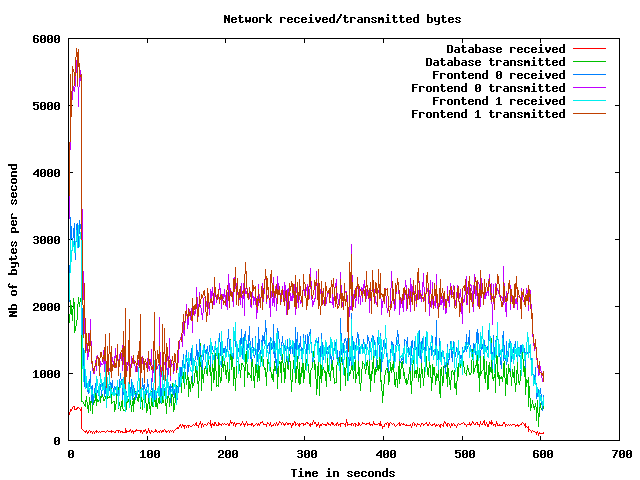
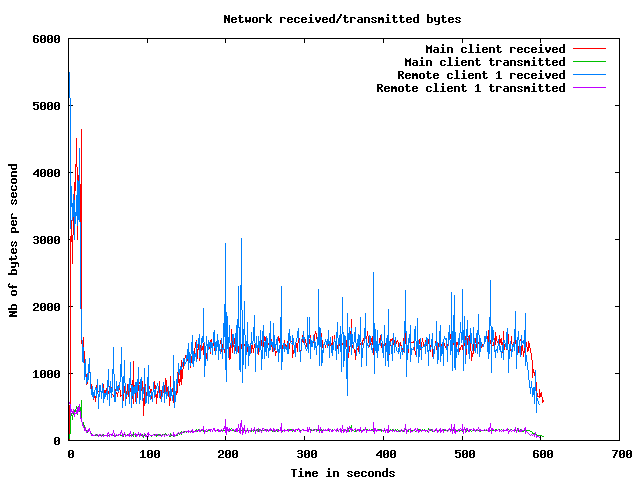
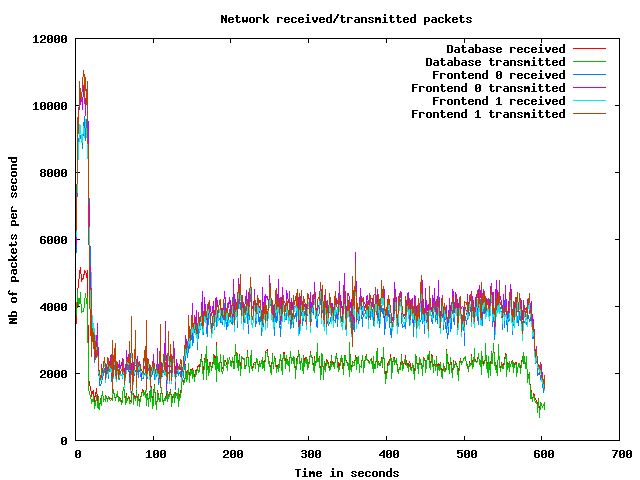
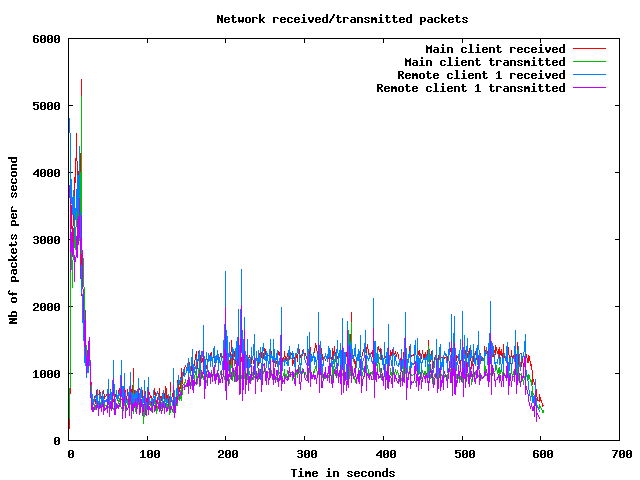
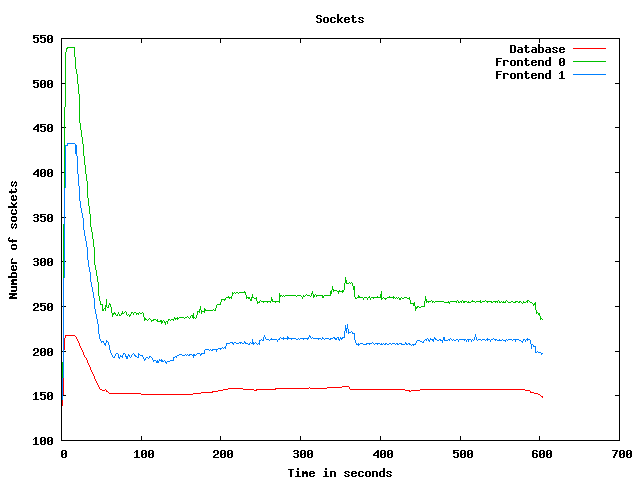
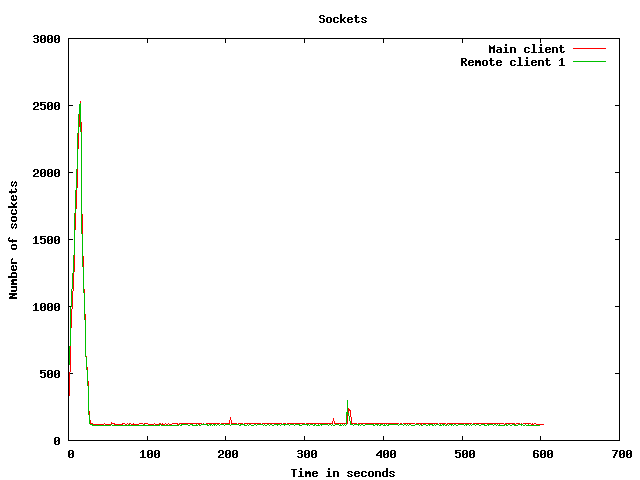
Network usage graphs
| Test start | 2009-3-19 6:43:4 |
| Up ramp start | 2009-3-19 6:43:23 |
| Runtime session start | 2009-3-19 6:45:23 |
| Down ramp start | 2009-3-19 6:52:53 |
| Test end | 2009-3-19 6:55:3 |
| Up ramp length | 2 minutes 1 millisecond (requested 120000 ms) |
| Runtime session length | 7 minutes 30 seconds 0 millisecond (requested 450000 ms) |
| Down ramp length | 30 seconds 0 millisecond (requested 30000 ms) |
| Total test length | 11 minutes 58 seconds 861 milliseconds |
| State name | % of total | Count | Errors | Minimum Time | Maximum Time | Average Time |
|---|---|---|---|---|---|---|
Home | 9 % | 4135 | 0 | 0 ms | 22858 ms | 2428 ms
|
Register | 1 % | 601 | 0 | 0 ms | 21073 ms | 667 ms
|
RegisterUser | 1 % | 559 | 7 | 4 ms | 21235 ms | 474 ms
|
Browse | 9 % | 4246 | 0 | 0 ms | 21174 ms | 888 ms
|
BrowseCategories | 6 % | 2803 | 0 | 3 ms | 21221 ms | 699 ms
|
SearchItemsInCategory | 14 % | 6512 | 0 | 1 ms | 21198 ms | 584 ms
|
BrowseRegions | 2 % | 1183 | 0 | 3 ms | 21213 ms | 846 ms
|
BrowseCategoriesInRegion | 2 % | 1113 | 0 | 3 ms | 21014 ms | 524 ms
|
SearchItemsInRegion | 4 % | 2197 | 0 | 0 ms | 21018 ms | 454 ms
|
ViewItem | 12 % | 5595 | 0 | 3 ms | 21098 ms | 484 ms
|
ViewUserInfo | 2 % | 1037 | 0 | 3 ms | 21020 ms | 474 ms
|
ViewBidHistory | 1 % | 521 | 0 | 3 ms | 21031 ms | 398 ms
|
BuyNowAuth | 1 % | 466 | 0 | 2 ms | 21008 ms | 545 ms
|
BuyNow | 0 % | 416 | 71 | 3 ms | 21011 ms | 277 ms
|
StoreBuyBow | 0 % | 306 | 0 | 4 ms | 9538 ms | 255 ms
|
PutBidAuth | 4 % | 1897 | 0 | 0 ms | 21011 ms | 454 ms
|
PutBid | 4 % | 1878 | 248 | 1 ms | 21016 ms | 391 ms
|
StoreBid | 2 % | 1133 | 0 | 4 ms | 21047 ms | 347 ms
|
PutCommentAuth | 0 % | 0 | 0 | 0 ms | 0 ms | 0 ms
|
PutComment | 0 % | 148 | 13 | 3 ms | 21010 ms | 393 ms
|
StoreComment | 0 % | 117 | 0 | 4 ms | 21004 ms | 392 ms
|
Sell | 0 % | 325 | 0 | 0 ms | 21002 ms | 610 ms
|
SelectCategoryToSellItem | 0 % | 299 | 0 | 3 ms | 21013 ms | 735 ms
|
SellItemForm | 0 % | 278 | 0 | 2 ms | 21005 ms | 486 ms
|
RegisterItem | 0 % | 256 | 0 | 4 ms | 21017 ms | 481 ms
|
AboutMe (auth form) | 1 % | 881 | 0 | 0 ms | 21019 ms | 741 ms
|
AboutMe | 2 % | 1269 | 0 | 4 ms | 21205 ms | 651 ms
|
Back probability | 7 % | 3507 | 0 | 0 ms | 0 ms | 0 ms
|
End of Session | 1 % | 460 | 0 | 0 ms | 0 ms | 0 ms
|
Total | 100 % | 44138 | 339 | - | - | 695 ms
|
Average throughput | 370 req/s
| |||||
Completed sessions | 410
| |||||
Total time | 20686 seconds
| |||||
Average session time | 50 seconds
| |||||
| State name | % of total | Count | Errors | Minimum Time | Maximum Time | Average Time |
|---|---|---|---|---|---|---|
Home | 4 % | 8464 | 0 | 0 ms | 3062 ms | 1 ms
|
Register | 1 % | 1900 | 0 | 0 ms | 3186 ms | 3 ms
|
RegisterUser | 0 % | 1854 | 31 | 4 ms | 3050 ms | 14 ms
|
Browse | 7 % | 13234 | 0 | 0 ms | 3214 ms | 4 ms
|
BrowseCategories | 4 % | 9254 | 0 | 3 ms | 3215 ms | 11 ms
|
SearchItemsInCategory | 15 % | 29186 | 0 | 0 ms | 3312 ms | 11 ms
|
BrowseRegions | 2 % | 3833 | 0 | 3 ms | 741 ms | 8 ms
|
BrowseCategoriesInRegion | 2 % | 3759 | 0 | 3 ms | 3219 ms | 12 ms
|
SearchItemsInRegion | 5 % | 9425 | 0 | 0 ms | 3053 ms | 17 ms
|
ViewItem | 14 % | 26448 | 0 | 3 ms | 3209 ms | 12 ms
|
ViewUserInfo | 3 % | 5781 | 0 | 3 ms | 3227 ms | 12 ms
|
ViewBidHistory | 1 % | 3163 | 0 | 3 ms | 3246 ms | 27 ms
|
BuyNowAuth | 1 % | 2351 | 0 | 2 ms | 3180 ms | 6 ms
|
BuyNow | 1 % | 2324 | 368 | 3 ms | 3016 ms | 13 ms
|
StoreBuyBow | 1 % | 1917 | 0 | 4 ms | 3010 ms | 14 ms
|
PutBidAuth | 4 % | 9185 | 0 | 0 ms | 3109 ms | 6 ms
|
PutBid | 5 % | 10529 | 1315 | 3 ms | 3208 ms | 15 ms
|
StoreBid | 3 % | 6776 | 2 | 4 ms | 3244 ms | 15 ms
|
PutCommentAuth | 0 % | 0 | 0 | 0 ms | 0 ms | 0 ms
|
PutComment | 0 % | 920 | 75 | 3 ms | 3052 ms | 18 ms
|
StoreComment | 0 % | 831 | 0 | 4 ms | 3030 ms | 13 ms
|
Sell | 0 % | 1048 | 0 | 0 ms | 3020 ms | 5 ms
|
SelectCategoryToSellItem | 0 % | 1022 | 0 | 3 ms | 48 ms | 9 ms
|
SellItemForm | 0 % | 1014 | 0 | 2 ms | 3221 ms | 11 ms
|
RegisterItem | 0 % | 991 | 0 | 4 ms | 3004 ms | 18 ms
|
AboutMe (auth form) | 1 % | 3144 | 0 | 0 ms | 3221 ms | 3 ms
|
AboutMe | 2 % | 5336 | 0 | 4 ms | 3249 ms | 28 ms
|
Back probability | 10 % | 19253 | 0 | 0 ms | 0 ms | 0 ms
|
End of Session | 1 % | 2588 | 0 | 0 ms | 0 ms | 0 ms
|
Total | 100 % | 185530 | 1791 | - | - | 10 ms
|
Average throughput | 416 req/s
| |||||
Completed sessions | 2601
| |||||
Total time | 649261 seconds
| |||||
Average session time | 249 seconds
| |||||
| State name | % of total | Count | Errors | Minimum Time | Maximum Time | Average Time |
|---|---|---|---|---|---|---|
Home | 4 % | 279 | 0 | 0 ms | 13 ms | 0 ms
|
Register | 1 % | 71 | 0 | 0 ms | 6 ms | 0 ms
|
RegisterUser | 1 % | 67 | 1 | 5 ms | 33 ms | 8 ms
|
Browse | 7 % | 436 | 0 | 0 ms | 8 ms | 0 ms
|
BrowseCategories | 5 % | 315 | 0 | 3 ms | 26 ms | 5 ms
|
SearchItemsInCategory | 16 % | 977 | 0 | 1 ms | 74 ms | 7 ms
|
BrowseRegions | 1 % | 114 | 0 | 3 ms | 22 ms | 6 ms
|
BrowseCategoriesInRegion | 1 % | 114 | 0 | 3 ms | 15 ms | 5 ms
|
SearchItemsInRegion | 4 % | 296 | 0 | 0 ms | 55 ms | 11 ms
|
ViewItem | 14 % | 859 | 0 | 3 ms | 50 ms | 8 ms
|
ViewUserInfo | 3 % | 197 | 0 | 3 ms | 30 ms | 7 ms
|
ViewBidHistory | 1 % | 104 | 0 | 3 ms | 130 ms | 24 ms
|
BuyNowAuth | 1 % | 79 | 0 | 2 ms | 21 ms | 3 ms
|
BuyNow | 1 % | 73 | 9 | 4 ms | 21 ms | 7 ms
|
StoreBuyBow | 0 % | 55 | 0 | 5 ms | 28 ms | 9 ms
|
PutBidAuth | 5 % | 307 | 0 | 0 ms | 26 ms | 3 ms
|
PutBid | 6 % | 376 | 49 | 4 ms | 31 ms | 9 ms
|
StoreBid | 3 % | 240 | 0 | 4 ms | 31 ms | 7 ms
|
PutCommentAuth | 0 % | 0 | 0 | 0 ms | 0 ms | 0 ms
|
PutComment | 0 % | 32 | 3 | 4 ms | 17 ms | 7 ms
|
StoreComment | 0 % | 27 | 0 | 5 ms | 28 ms | 7 ms
|
Sell | 0 % | 38 | 0 | 0 ms | 3 ms | 0 ms
|
SelectCategoryToSellItem | 0 % | 28 | 0 | 3 ms | 13 ms | 5 ms
|
SellItemForm | 0 % | 24 | 0 | 2 ms | 12 ms | 4 ms
|
RegisterItem | 0 % | 28 | 0 | 4 ms | 18 ms | 9 ms
|
AboutMe (auth form) | 1 % | 113 | 0 | 0 ms | 7 ms | 0 ms
|
AboutMe | 2 % | 173 | 0 | 4 ms | 63 ms | 22 ms
|
Back probability | 9 % | 605 | 0 | 0 ms | 0 ms | 0 ms
|
End of Session | 1 % | 77 | 0 | 0 ms | 0 ms | 0 ms
|
Total | 100 % | 6104 | 62 | - | - | 6 ms
|
Average throughput | 205 req/s
| |||||
Completed sessions | 81
| |||||
Total time | 30300 seconds
| |||||
Average session time | 374 seconds
| |||||
| State name | % of total | Count | Errors | Minimum Time | Maximum Time | Average Time |
|---|---|---|---|---|---|---|
Home | 5 % | 12878 | 0 | 0 ms | 22858 ms | 780 ms
|
Register | 1 % | 2572 | 0 | 0 ms | 21073 ms | 158 ms
|
RegisterUser | 1 % | 2480 | 39 | 4 ms | 21235 ms | 117 ms
|
Browse | 7 % | 17916 | 0 | 0 ms | 21174 ms | 213 ms
|
BrowseCategories | 5 % | 12372 | 0 | 3 ms | 21221 ms | 166 ms
|
SearchItemsInCategory | 15 % | 36813 | 0 | 0 ms | 21198 ms | 112 ms
|
BrowseRegions | 2 % | 5130 | 0 | 3 ms | 21213 ms | 201 ms
|
BrowseCategoriesInRegion | 2 % | 4986 | 0 | 3 ms | 21014 ms | 126 ms
|
SearchItemsInRegion | 5 % | 11945 | 0 | 0 ms | 21018 ms | 97 ms
|
ViewItem | 13 % | 32953 | 0 | 3 ms | 21098 ms | 92 ms
|
ViewUserInfo | 2 % | 7030 | 0 | 3 ms | 21020 ms | 80 ms
|
ViewBidHistory | 1 % | 3795 | 0 | 3 ms | 21031 ms | 77 ms
|
BuyNowAuth | 1 % | 2896 | 0 | 2 ms | 21008 ms | 93 ms
|
BuyNow | 1 % | 2813 | 448 | 3 ms | 21011 ms | 52 ms
|
StoreBuyBow | 0 % | 2278 | 0 | 4 ms | 9538 ms | 46 ms
|
PutBidAuth | 4 % | 11389 | 0 | 0 ms | 21011 ms | 81 ms
|
PutBid | 5 % | 12818 | 1612 | 1 ms | 21016 ms | 70 ms
|
StoreBid | 3 % | 8149 | 2 | 4 ms | 21047 ms | 61 ms
|
PutCommentAuth | 0 % | 0 | 0 | 0 ms | 0 ms | 0 ms
|
PutComment | 0 % | 1100 | 91 | 3 ms | 21010 ms | 68 ms
|
StoreComment | 0 % | 975 | 0 | 4 ms | 21004 ms | 59 ms
|
Sell | 0 % | 1411 | 0 | 0 ms | 21002 ms | 144 ms
|
SelectCategoryToSellItem | 0 % | 1349 | 0 | 3 ms | 21013 ms | 170 ms
|
SellItemForm | 0 % | 1316 | 0 | 2 ms | 21005 ms | 111 ms
|
RegisterItem | 0 % | 1275 | 0 | 4 ms | 21017 ms | 111 ms
|
AboutMe (auth form) | 1 % | 4138 | 0 | 0 ms | 21019 ms | 160 ms
|
AboutMe | 2 % | 6809 | 0 | 4 ms | 21205 ms | 144 ms
|
Back probability | 9 % | 23365 | 0 | 0 ms | 0 ms | 0 ms
|
End of Session | 1 % | 3125 | 0 | 0 ms | 0 ms | 0 ms
|
Total | 100 % | 236076 | 2192 | - | - | 138 ms
|
Average throughput | 397 req/s
| |||||
Completed sessions | 3125
| |||||
Total time | 713709 seconds
| |||||
Average session time | 228 seconds
| |||||
An error occured while waiting for remote processes termination (Skipping waits)
Command is: /usr/bin/scp farm6.csail.mit.edu:/tmp/client1 /home/drkp/sandbox/txcache/src/RUBiS-1.4.3/bench/2009-3-19@6:43:4//client1.bin
Command is: /usr/bin/ssh -x localhost /bin/bash -c 'LANG=en_GB.UTF-8 /usr/bin/sar -n DEV -n SOCK -rubcw 1 605 -f /home/drkp/sandbox/txcache/src/RUBiS-1.4.3/bench/2009-3-19@6:43:4//client1.bin > /home/drkp/sandbox/txcache/src/RUBiS-1.4.3/bench/2009-3-19@6:43:4//client1'
Command is: /usr/bin/scp farm14:/tmp/db_server0 /home/drkp/sandbox/txcache/src/RUBiS-1.4.3/bench/2009-3-19@6:43:4//db_server0.bin
Command is: /usr/bin/ssh -x localhost /bin/bash -c 'LANG=en_GB.UTF-8 /usr/bin/sar -n DEV -n SOCK -rubcw 1 605 -f /home/drkp/sandbox/txcache/src/RUBiS-1.4.3/bench/2009-3-19@6:43:4//db_server0.bin > /home/drkp/sandbox/txcache/src/RUBiS-1.4.3/bench/2009-3-19@6:43:4//db_server0'
Command is: /usr/bin/scp farm12.csail.mit.edu:/tmp/web_server0 /home/drkp/sandbox/txcache/src/RUBiS-1.4.3/bench/2009-3-19@6:43:4//web_server0.bin
Command is: /usr/bin/ssh -x localhost /bin/bash -c 'LANG=en_GB.UTF-8 /usr/bin/sar -n DEV -n SOCK -rubcw 1 605 -f /home/drkp/sandbox/txcache/src/RUBiS-1.4.3/bench/2009-3-19@6:43:4//web_server0.bin > /home/drkp/sandbox/txcache/src/RUBiS-1.4.3/bench/2009-3-19@6:43:4//web_server0'
Command is: /usr/bin/scp farm13.csail.mit.edu:/tmp/web_server1 /home/drkp/sandbox/txcache/src/RUBiS-1.4.3/bench/2009-3-19@6:43:4//web_server1.bin
Command is: /usr/bin/ssh -x localhost /bin/bash -c 'LANG=en_GB.UTF-8 /usr/bin/sar -n DEV -n SOCK -rubcw 1 605 -f /home/drkp/sandbox/txcache/src/RUBiS-1.4.3/bench/2009-3-19@6:43:4//web_server1.bin > /home/drkp/sandbox/txcache/src/RUBiS-1.4.3/bench/2009-3-19@6:43:4//web_server1'
Command is: /usr/bin/scp localhost:/tmp/client0 /home/drkp/sandbox/txcache/src/RUBiS-1.4.3/bench/2009-3-19@6:43:4//client0.bin
Command is: /usr/bin/ssh -x localhost /bin/bash -c 'LANG=en_GB.UTF-8 /usr/bin/sar -n DEV -n SOCK -rubcw 1 605 -f /home/drkp/sandbox/txcache/src/RUBiS-1.4.3/bench/2009-3-19@6:43:4//client0.bin > /home/drkp/sandbox/txcache/src/RUBiS-1.4.3/bench/2009-3-19@6:43:4//client0'
Command is: /usr/bin/scp farm6.csail.mit.edu:/tmp/trace_client1.html /home/drkp/sandbox/txcache/src/RUBiS-1.4.3/bench/2009-3-19@6:43:4//
Command is: /usr/bin/scp farm6.csail.mit.edu:/tmp/stat_client1.html /home/drkp/sandbox/txcache/src/RUBiS-1.4.3/bench/2009-3-19@6:43:4//
|
|
|
|
|
|
 | 
|
 | 
|
 | 
|
 | 
|
 | 
|
 | 
|
 | 
|
 | 
|
 | 
|