Node information
Test timing information
Up ramp statistics
Runtime session statistics
Down ramp statistics
Overall statistics
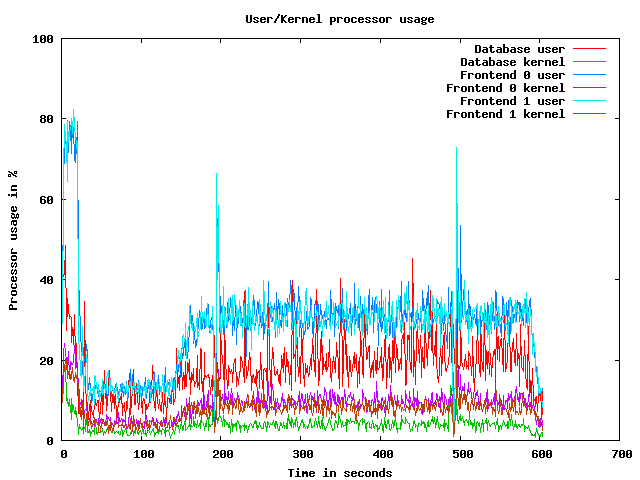
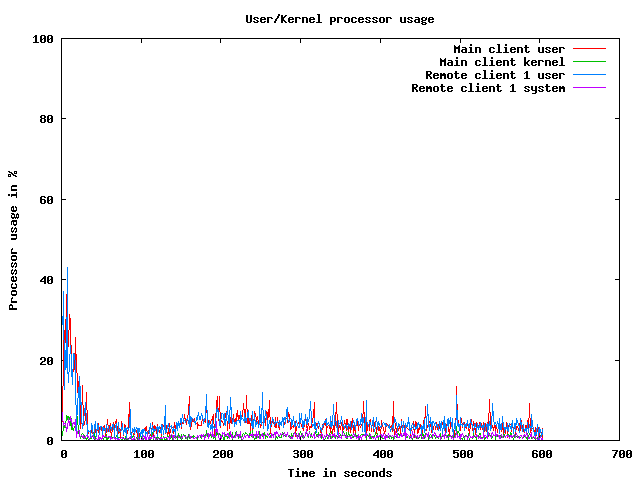
CPU usage graphs
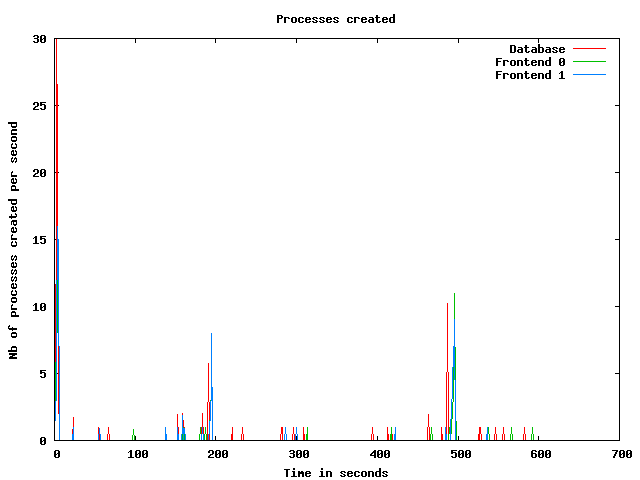
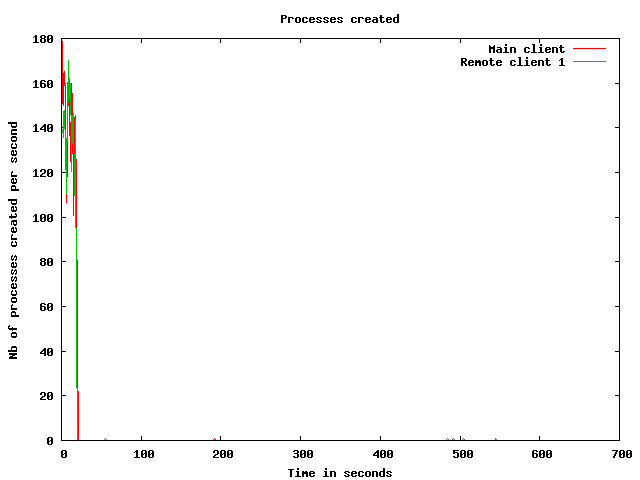
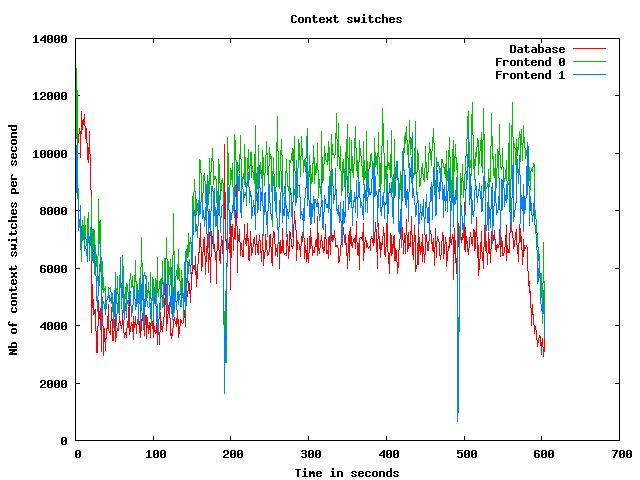
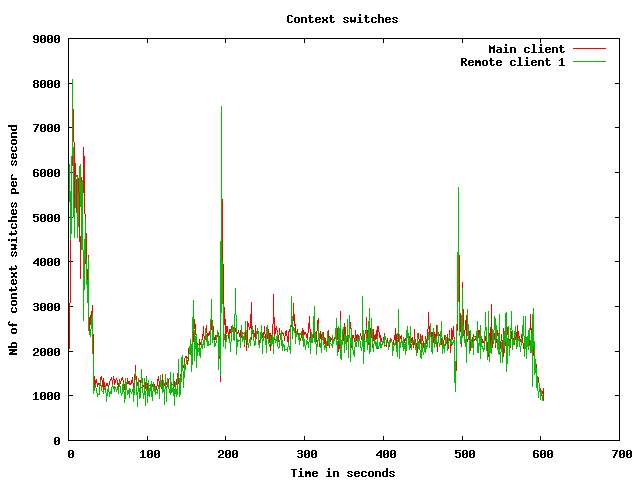
Processes usage graphs
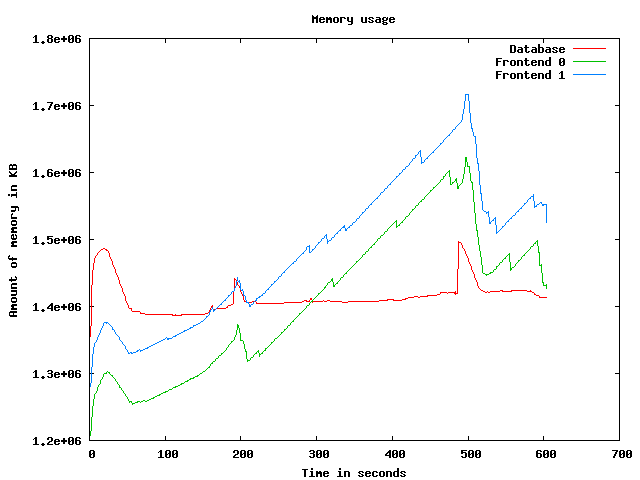
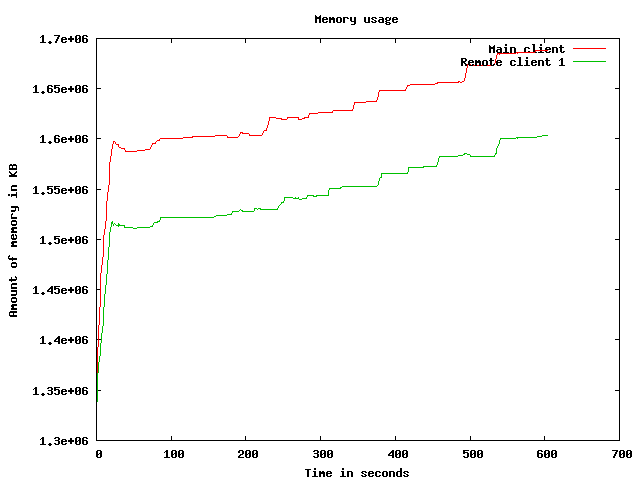
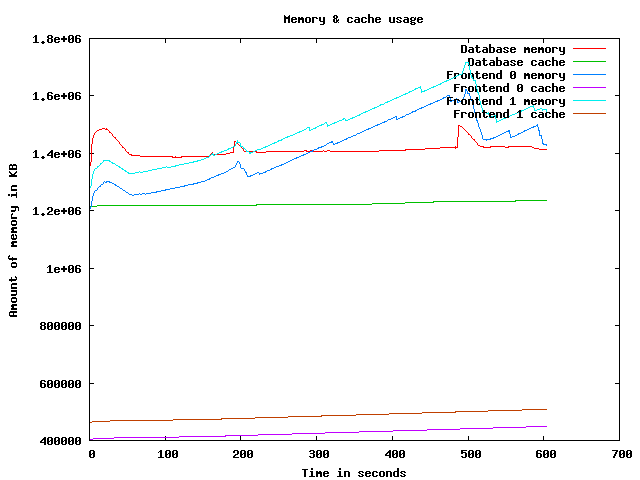
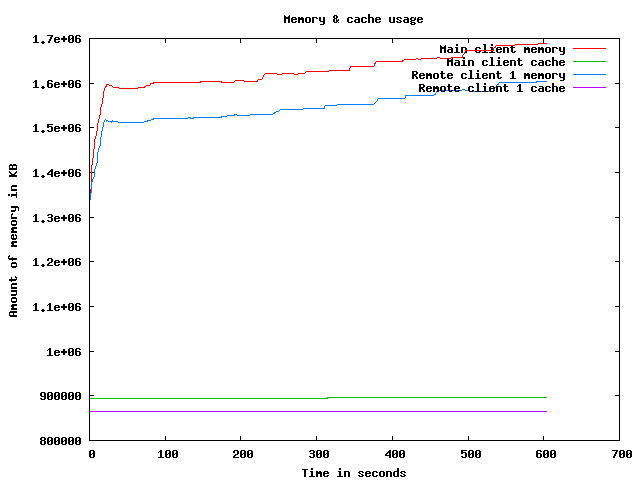
Memory usage graph
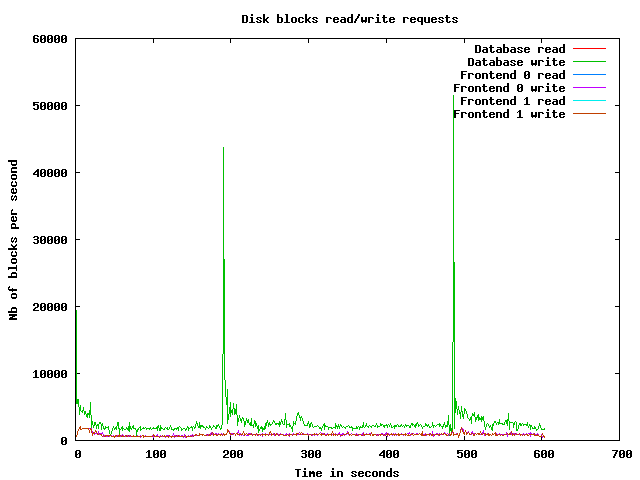
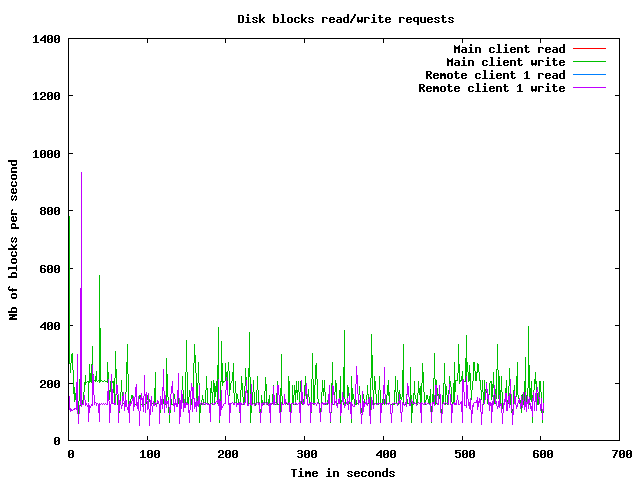
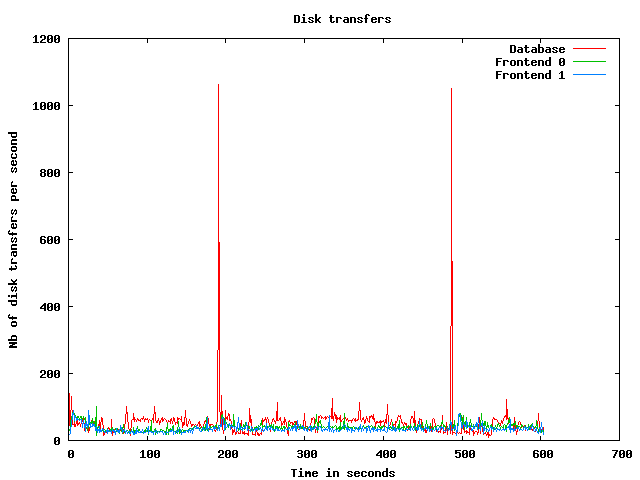
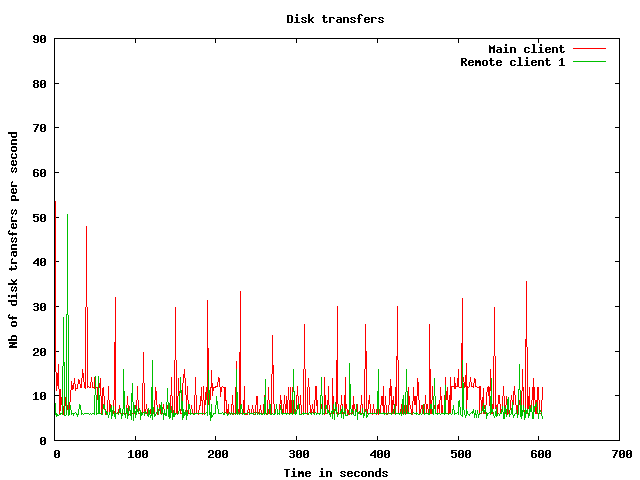
Disk usage graphs
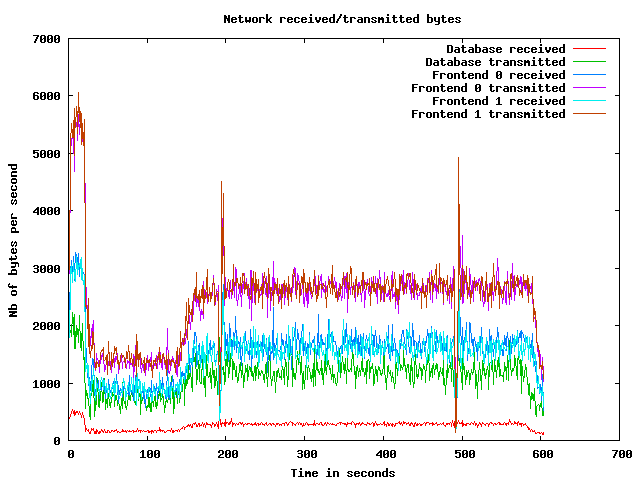
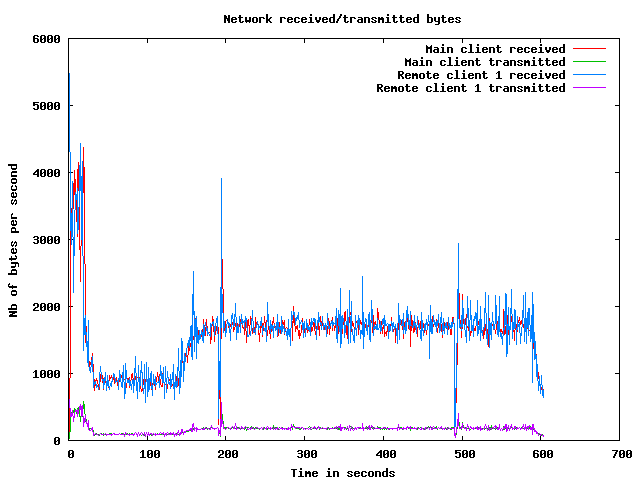
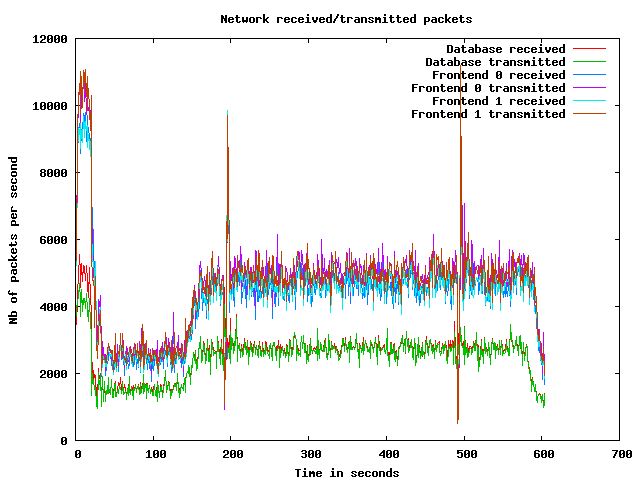
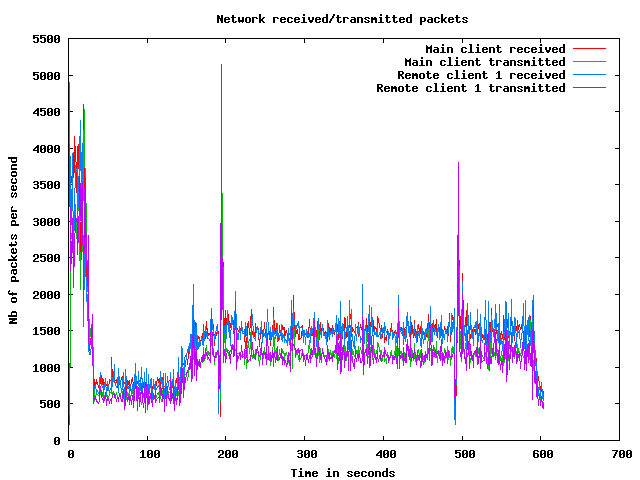
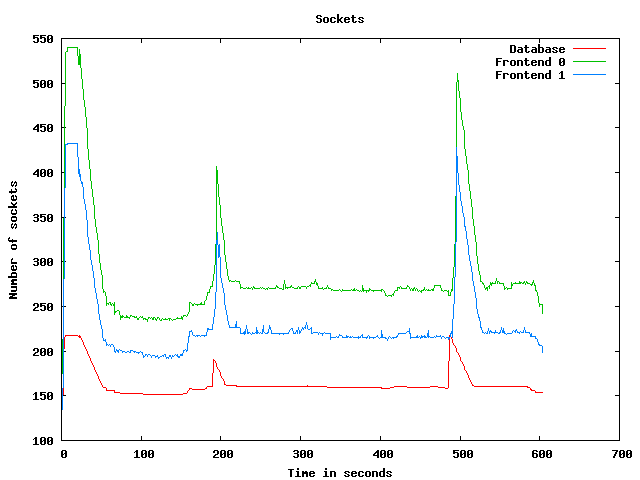
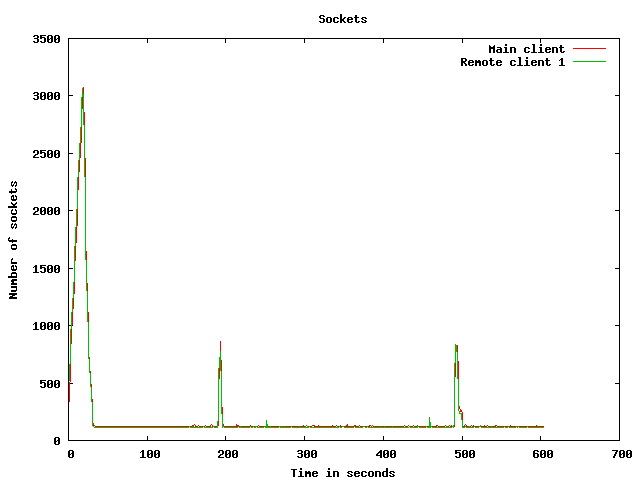
Network usage graphs
| Test start | 2009-3-19 6:55:48 |
| Up ramp start | 2009-3-19 6:56:10 |
| Runtime session start | 2009-3-19 6:58:10 |
| Down ramp start | 2009-3-19 7:5:40 |
| Test end | 2009-3-19 7:8:12 |
| Up ramp length | 2 minutes 0 millisecond (requested 120000 ms) |
| Runtime session length | 7 minutes 30 seconds 1 millisecond (requested 450000 ms) |
| Down ramp length | 30 seconds 0 millisecond (requested 30000 ms) |
| Total test length | 12 minutes 24 seconds 14 milliseconds |
| State name | % of total | Count | Errors | Minimum Time | Maximum Time | Average Time |
|---|---|---|---|---|---|---|
Home | 9 % | 4970 | 0 | 0 ms | 44995 ms | 2662 ms
|
Register | 1 % | 757 | 0 | 0 ms | 21095 ms | 867 ms
|
RegisterUser | 1 % | 712 | 16 | 4 ms | 21117 ms | 946 ms
|
Browse | 9 % | 5097 | 0 | 0 ms | 30939 ms | 919 ms
|
BrowseCategories | 6 % | 3432 | 0 | 3 ms | 21440 ms | 919 ms
|
SearchItemsInCategory | 15 % | 8378 | 0 | 1 ms | 30954 ms | 654 ms
|
BrowseRegions | 2 % | 1368 | 0 | 3 ms | 21144 ms | 577 ms
|
BrowseCategoriesInRegion | 2 % | 1270 | 0 | 3 ms | 21201 ms | 699 ms
|
SearchItemsInRegion | 4 % | 2579 | 0 | 0 ms | 21431 ms | 606 ms
|
ViewItem | 12 % | 6999 | 0 | 3 ms | 30959 ms | 666 ms
|
ViewUserInfo | 2 % | 1323 | 0 | 3 ms | 21137 ms | 453 ms
|
ViewBidHistory | 1 % | 609 | 0 | 3 ms | 21046 ms | 568 ms
|
BuyNowAuth | 1 % | 578 | 0 | 2 ms | 21270 ms | 449 ms
|
BuyNow | 0 % | 529 | 88 | 3 ms | 21072 ms | 453 ms
|
StoreBuyBow | 0 % | 390 | 0 | 4 ms | 21005 ms | 241 ms
|
PutBidAuth | 4 % | 2328 | 0 | 0 ms | 27952 ms | 552 ms
|
PutBid | 4 % | 2290 | 297 | 3 ms | 21325 ms | 451 ms
|
StoreBid | 2 % | 1366 | 0 | 4 ms | 21385 ms | 658 ms
|
PutCommentAuth | 0 % | 0 | 0 | 0 ms | 0 ms | 0 ms
|
PutComment | 0 % | 211 | 22 | 3 ms | 21012 ms | 613 ms
|
StoreComment | 0 % | 171 | 0 | 4 ms | 21028 ms | 735 ms
|
Sell | 0 % | 353 | 0 | 0 ms | 21110 ms | 880 ms
|
SelectCategoryToSellItem | 0 % | 320 | 0 | 3 ms | 21008 ms | 415 ms
|
SellItemForm | 0 % | 300 | 0 | 2 ms | 21014 ms | 456 ms
|
RegisterItem | 0 % | 268 | 0 | 4 ms | 21073 ms | 678 ms
|
AboutMe (auth form) | 2 % | 1122 | 0 | 0 ms | 21461 ms | 962 ms
|
AboutMe | 2 % | 1568 | 0 | 4 ms | 21425 ms | 867 ms
|
Back probability | 8 % | 4480 | 0 | 0 ms | 0 ms | 0 ms
|
End of Session | 1 % | 582 | 0 | 0 ms | 0 ms | 0 ms
|
Total | 100 % | 54350 | 423 | - | - | 803 ms
|
Average throughput | 456 req/s
| |||||
Completed sessions | 525
| |||||
Total time | 25891 seconds
| |||||
Average session time | 49 seconds
| |||||
| State name | % of total | Count | Errors | Minimum Time | Maximum Time | Average Time |
|---|---|---|---|---|---|---|
Home | 4 % | 9875 | 0 | 0 ms | 9017 ms | 11 ms
|
Register | 1 % | 2367 | 0 | 0 ms | 9050 ms | 33 ms
|
RegisterUser | 1 % | 2322 | 54 | 5 ms | 9050 ms | 52 ms
|
Browse | 7 % | 15706 | 0 | 0 ms | 9080 ms | 35 ms
|
BrowseCategories | 4 % | 10965 | 0 | 3 ms | 9086 ms | 40 ms
|
SearchItemsInCategory | 15 % | 34444 | 0 | 0 ms | 9113 ms | 38 ms
|
BrowseRegions | 2 % | 4536 | 0 | 3 ms | 9117 ms | 43 ms
|
BrowseCategoriesInRegion | 2 % | 4457 | 0 | 3 ms | 9026 ms | 41 ms
|
SearchItemsInRegion | 5 % | 11160 | 0 | 0 ms | 9194 ms | 41 ms
|
ViewItem | 14 % | 31301 | 0 | 3 ms | 9146 ms | 42 ms
|
ViewUserInfo | 3 % | 7380 | 0 | 3 ms | 9072 ms | 38 ms
|
ViewBidHistory | 1 % | 3843 | 0 | 3 ms | 9358 ms | 63 ms
|
BuyNowAuth | 1 % | 2930 | 0 | 2 ms | 9045 ms | 38 ms
|
BuyNow | 1 % | 2876 | 430 | 3 ms | 9136 ms | 46 ms
|
StoreBuyBow | 1 % | 2406 | 1 | 4 ms | 3536 ms | 38 ms
|
PutBidAuth | 4 % | 10903 | 0 | 0 ms | 9068 ms | 40 ms
|
PutBid | 5 % | 12521 | 1480 | 3 ms | 9130 ms | 41 ms
|
StoreBid | 3 % | 8203 | 1 | 4 ms | 9148 ms | 38 ms
|
PutCommentAuth | 0 % | 0 | 0 | 0 ms | 0 ms | 0 ms
|
PutComment | 0 % | 1024 | 69 | 3 ms | 9088 ms | 35 ms
|
StoreComment | 0 % | 940 | 0 | 4 ms | 3609 ms | 28 ms
|
Sell | 0 % | 1203 | 0 | 0 ms | 9013 ms | 44 ms
|
SelectCategoryToSellItem | 0 % | 1192 | 0 | 3 ms | 3257 ms | 22 ms
|
SellItemForm | 0 % | 1165 | 0 | 2 ms | 9179 ms | 58 ms
|
RegisterItem | 0 % | 1155 | 0 | 4 ms | 9077 ms | 51 ms
|
AboutMe (auth form) | 1 % | 3597 | 0 | 0 ms | 9057 ms | 27 ms
|
AboutMe | 2 % | 6208 | 0 | 4 ms | 9202 ms | 62 ms
|
Back probability | 10 % | 23201 | 0 | 0 ms | 0 ms | 0 ms
|
End of Session | 1 % | 3208 | 0 | 0 ms | 0 ms | 0 ms
|
Total | 100 % | 221088 | 2035 | - | - | 34 ms
|
Average throughput | 495 req/s
| |||||
Completed sessions | 3213
| |||||
Total time | 803686 seconds
| |||||
Average session time | 250 seconds
| |||||
| State name | % of total | Count | Errors | Minimum Time | Maximum Time | Average Time |
|---|---|---|---|---|---|---|
Home | 4 % | 335 | 0 | 0 ms | 79 ms | 0 ms
|
Register | 1 % | 84 | 0 | 0 ms | 5 ms | 0 ms
|
RegisterUser | 1 % | 77 | 2 | 5 ms | 29 ms | 11 ms
|
Browse | 6 % | 508 | 0 | 0 ms | 130 ms | 1 ms
|
BrowseCategories | 4 % | 349 | 0 | 3 ms | 25 ms | 6 ms
|
SearchItemsInCategory | 15 % | 1146 | 0 | 3 ms | 184 ms | 8 ms
|
BrowseRegions | 2 % | 156 | 0 | 3 ms | 15 ms | 5 ms
|
BrowseCategoriesInRegion | 2 % | 148 | 0 | 3 ms | 34 ms | 6 ms
|
SearchItemsInRegion | 4 % | 364 | 0 | 0 ms | 129 ms | 13 ms
|
ViewItem | 14 % | 1064 | 0 | 3 ms | 91 ms | 9 ms
|
ViewUserInfo | 3 % | 277 | 0 | 3 ms | 108 ms | 8 ms
|
ViewBidHistory | 1 % | 123 | 0 | 3 ms | 148 ms | 31 ms
|
BuyNowAuth | 1 % | 90 | 0 | 2 ms | 9 ms | 3 ms
|
BuyNow | 1 % | 91 | 18 | 4 ms | 37 ms | 7 ms
|
StoreBuyBow | 0 % | 57 | 0 | 4 ms | 59 ms | 13 ms
|
PutBidAuth | 5 % | 375 | 0 | 0 ms | 32 ms | 3 ms
|
PutBid | 5 % | 405 | 43 | 3 ms | 68 ms | 10 ms
|
StoreBid | 3 % | 251 | 0 | 4 ms | 119 ms | 10 ms
|
PutCommentAuth | 0 % | 0 | 0 | 0 ms | 0 ms | 0 ms
|
PutComment | 0 % | 48 | 7 | 4 ms | 25 ms | 6 ms
|
StoreComment | 0 % | 27 | 0 | 4 ms | 23 ms | 10 ms
|
Sell | 0 % | 50 | 0 | 0 ms | 6 ms | 0 ms
|
SelectCategoryToSellItem | 0 % | 48 | 0 | 4 ms | 45 ms | 5 ms
|
SellItemForm | 0 % | 34 | 0 | 2 ms | 16 ms | 4 ms
|
RegisterItem | 0 % | 39 | 0 | 4 ms | 28 ms | 7 ms
|
AboutMe (auth form) | 1 % | 112 | 0 | 0 ms | 27 ms | 1 ms
|
AboutMe | 2 % | 200 | 0 | 4 ms | 100 ms | 25 ms
|
Back probability | 10 % | 774 | 0 | 0 ms | 0 ms | 0 ms
|
End of Session | 1 % | 115 | 0 | 0 ms | 0 ms | 0 ms
|
Total | 100 % | 7347 | 70 | - | - | 7 ms
|
Average throughput | 247 req/s
| |||||
Completed sessions | 113
| |||||
Total time | 34564 seconds
| |||||
Average session time | 305 seconds
| |||||
| State name | % of total | Count | Errors | Minimum Time | Maximum Time | Average Time |
|---|---|---|---|---|---|---|
Home | 5 % | 15180 | 0 | 0 ms | 44995 ms | 879 ms
|
Register | 1 % | 3208 | 0 | 0 ms | 21095 ms | 229 ms
|
RegisterUser | 1 % | 3111 | 72 | 4 ms | 21117 ms | 256 ms
|
Browse | 7 % | 21311 | 0 | 0 ms | 30939 ms | 245 ms
|
BrowseCategories | 5 % | 14746 | 0 | 3 ms | 21440 ms | 244 ms
|
SearchItemsInCategory | 15 % | 44123 | 0 | 0 ms | 30954 ms | 154 ms
|
BrowseRegions | 2 % | 6060 | 0 | 3 ms | 21144 ms | 163 ms
|
BrowseCategoriesInRegion | 2 % | 5875 | 0 | 3 ms | 21201 ms | 182 ms
|
SearchItemsInRegion | 4 % | 14124 | 0 | 0 ms | 21431 ms | 144 ms
|
ViewItem | 13 % | 39445 | 0 | 3 ms | 30959 ms | 152 ms
|
ViewUserInfo | 3 % | 9008 | 0 | 3 ms | 21137 ms | 98 ms
|
ViewBidHistory | 1 % | 4590 | 0 | 3 ms | 21046 ms | 129 ms
|
BuyNowAuth | 1 % | 3598 | 0 | 2 ms | 21270 ms | 103 ms
|
BuyNow | 1 % | 3496 | 536 | 3 ms | 21072 ms | 106 ms
|
StoreBuyBow | 1 % | 2853 | 1 | 4 ms | 21005 ms | 66 ms
|
PutBidAuth | 4 % | 13606 | 0 | 0 ms | 27952 ms | 127 ms
|
PutBid | 5 % | 15248 | 1820 | 3 ms | 21325 ms | 102 ms
|
StoreBid | 3 % | 9820 | 1 | 4 ms | 21385 ms | 124 ms
|
PutCommentAuth | 0 % | 0 | 0 | 0 ms | 0 ms | 0 ms
|
PutComment | 0 % | 1283 | 98 | 3 ms | 21012 ms | 129 ms
|
StoreComment | 0 % | 1138 | 0 | 4 ms | 21028 ms | 134 ms
|
Sell | 0 % | 1606 | 0 | 0 ms | 21110 ms | 226 ms
|
SelectCategoryToSellItem | 0 % | 1560 | 0 | 3 ms | 21008 ms | 102 ms
|
SellItemForm | 0 % | 1499 | 0 | 2 ms | 21014 ms | 136 ms
|
RegisterItem | 0 % | 1462 | 0 | 4 ms | 21073 ms | 165 ms
|
AboutMe (auth form) | 1 % | 4831 | 0 | 0 ms | 21461 ms | 243 ms
|
AboutMe | 2 % | 8015 | 0 | 4 ms | 21425 ms | 218 ms
|
Back probability | 10 % | 28455 | 0 | 0 ms | 0 ms | 0 ms
|
End of Session | 1 % | 3905 | 0 | 0 ms | 0 ms | 0 ms
|
Total | 100 % | 283156 | 2528 | - | - | 181 ms
|
Average throughput | 476 req/s
| |||||
Completed sessions | 3905
| |||||
Total time | 883714 seconds
| |||||
Average session time | 226 seconds
| |||||
An error occured while waiting for remote processes termination (Skipping waits)
Command is: /usr/bin/scp farm6.csail.mit.edu:/tmp/client1 /home/drkp/sandbox/txcache/src/RUBiS-1.4.3/bench/2009-3-19@6:55:48//client1.bin
Command is: /usr/bin/ssh -x localhost /bin/bash -c 'LANG=en_GB.UTF-8 /usr/bin/sar -n DEV -n SOCK -rubcw 1 605 -f /home/drkp/sandbox/txcache/src/RUBiS-1.4.3/bench/2009-3-19@6:55:48//client1.bin > /home/drkp/sandbox/txcache/src/RUBiS-1.4.3/bench/2009-3-19@6:55:48//client1'
Command is: /usr/bin/scp farm14:/tmp/db_server0 /home/drkp/sandbox/txcache/src/RUBiS-1.4.3/bench/2009-3-19@6:55:48//db_server0.bin
Command is: /usr/bin/ssh -x localhost /bin/bash -c 'LANG=en_GB.UTF-8 /usr/bin/sar -n DEV -n SOCK -rubcw 1 605 -f /home/drkp/sandbox/txcache/src/RUBiS-1.4.3/bench/2009-3-19@6:55:48//db_server0.bin > /home/drkp/sandbox/txcache/src/RUBiS-1.4.3/bench/2009-3-19@6:55:48//db_server0'
Command is: /usr/bin/scp farm12.csail.mit.edu:/tmp/web_server0 /home/drkp/sandbox/txcache/src/RUBiS-1.4.3/bench/2009-3-19@6:55:48//web_server0.bin
Command is: /usr/bin/ssh -x localhost /bin/bash -c 'LANG=en_GB.UTF-8 /usr/bin/sar -n DEV -n SOCK -rubcw 1 605 -f /home/drkp/sandbox/txcache/src/RUBiS-1.4.3/bench/2009-3-19@6:55:48//web_server0.bin > /home/drkp/sandbox/txcache/src/RUBiS-1.4.3/bench/2009-3-19@6:55:48//web_server0'
Command is: /usr/bin/scp farm13.csail.mit.edu:/tmp/web_server1 /home/drkp/sandbox/txcache/src/RUBiS-1.4.3/bench/2009-3-19@6:55:48//web_server1.bin
Command is: /usr/bin/ssh -x localhost /bin/bash -c 'LANG=en_GB.UTF-8 /usr/bin/sar -n DEV -n SOCK -rubcw 1 605 -f /home/drkp/sandbox/txcache/src/RUBiS-1.4.3/bench/2009-3-19@6:55:48//web_server1.bin > /home/drkp/sandbox/txcache/src/RUBiS-1.4.3/bench/2009-3-19@6:55:48//web_server1'
Command is: /usr/bin/scp localhost:/tmp/client0 /home/drkp/sandbox/txcache/src/RUBiS-1.4.3/bench/2009-3-19@6:55:48//client0.bin
Command is: /usr/bin/ssh -x localhost /bin/bash -c 'LANG=en_GB.UTF-8 /usr/bin/sar -n DEV -n SOCK -rubcw 1 605 -f /home/drkp/sandbox/txcache/src/RUBiS-1.4.3/bench/2009-3-19@6:55:48//client0.bin > /home/drkp/sandbox/txcache/src/RUBiS-1.4.3/bench/2009-3-19@6:55:48//client0'
Command is: /usr/bin/scp farm6.csail.mit.edu:/tmp/trace_client1.html /home/drkp/sandbox/txcache/src/RUBiS-1.4.3/bench/2009-3-19@6:55:48//
Command is: /usr/bin/scp farm6.csail.mit.edu:/tmp/stat_client1.html /home/drkp/sandbox/txcache/src/RUBiS-1.4.3/bench/2009-3-19@6:55:48//
|
|
|
|
|
|
 | 
|
 | 
|
 | 
|
 | 
|
 | 
|
 | 
|
 | 
|
 | 
|
 | 
|