Node information
Test timing information
Up ramp statistics
Runtime session statistics
Down ramp statistics
Overall statistics
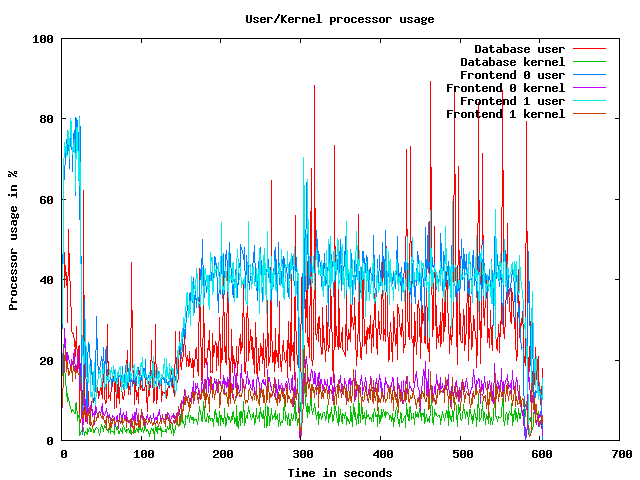
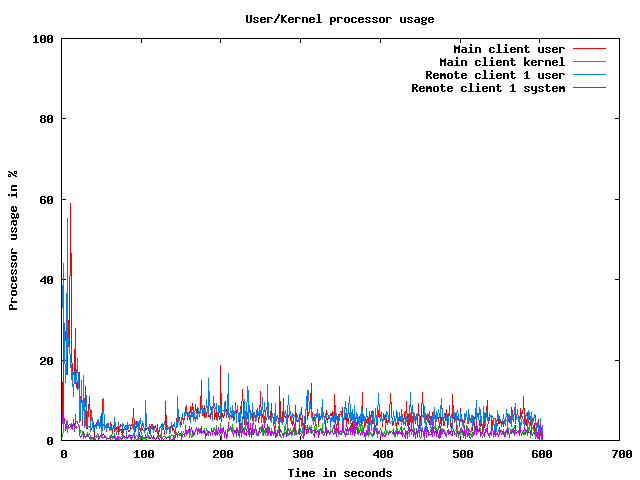
CPU usage graphs
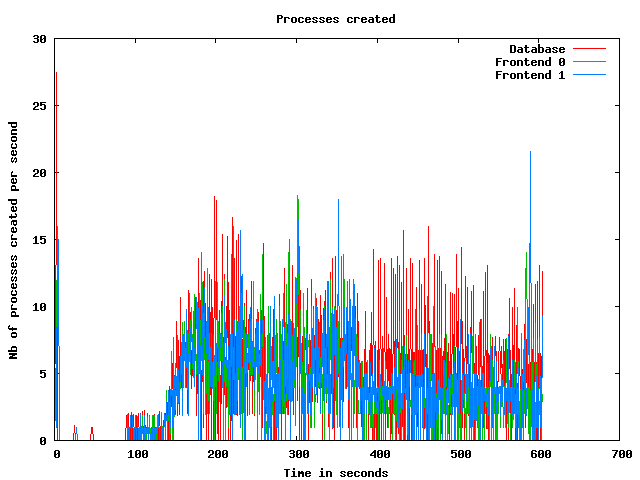
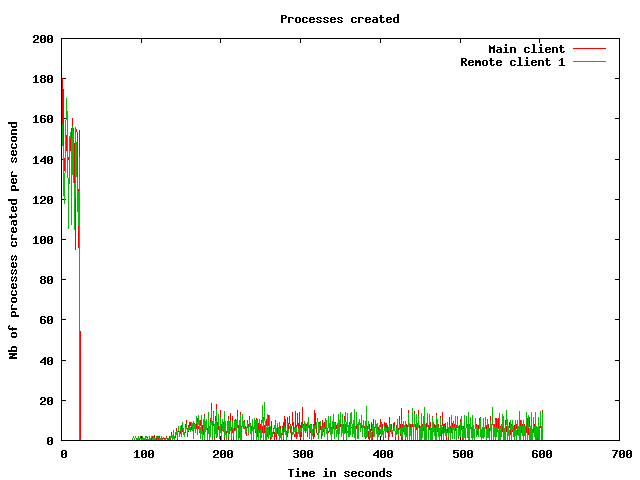
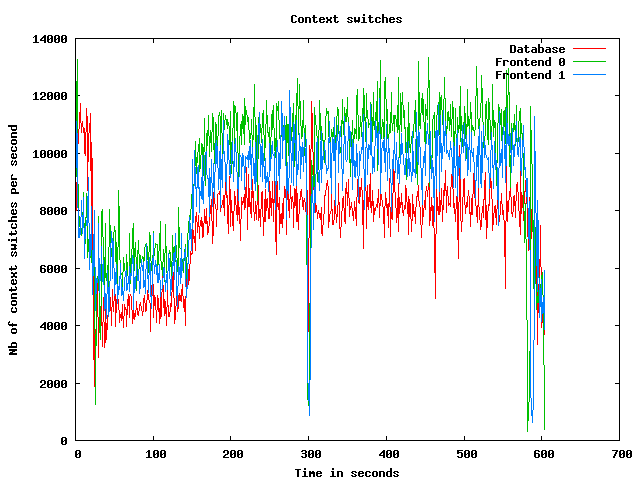
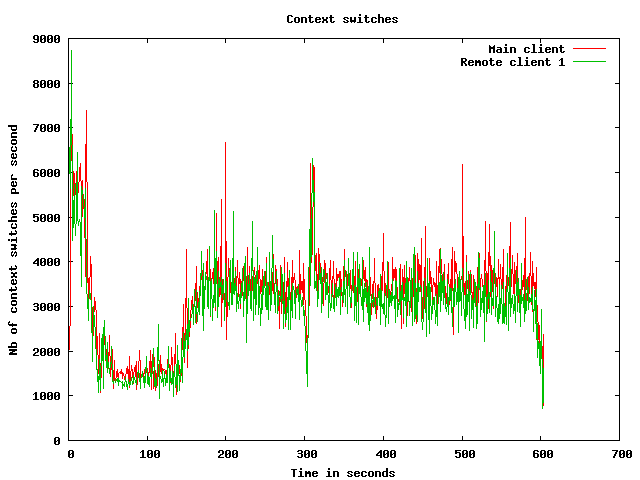
Processes usage graphs
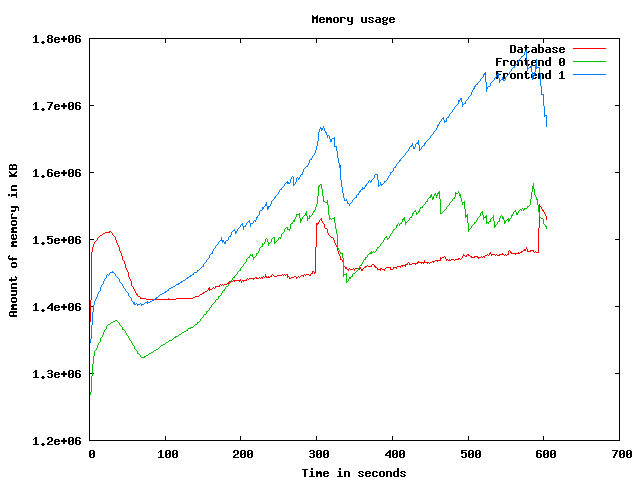
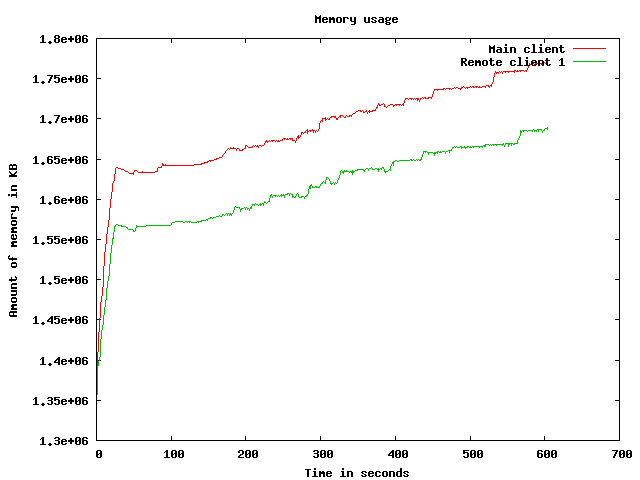
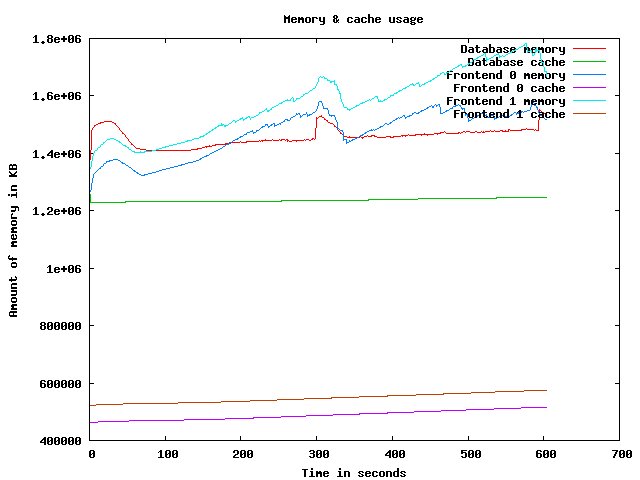
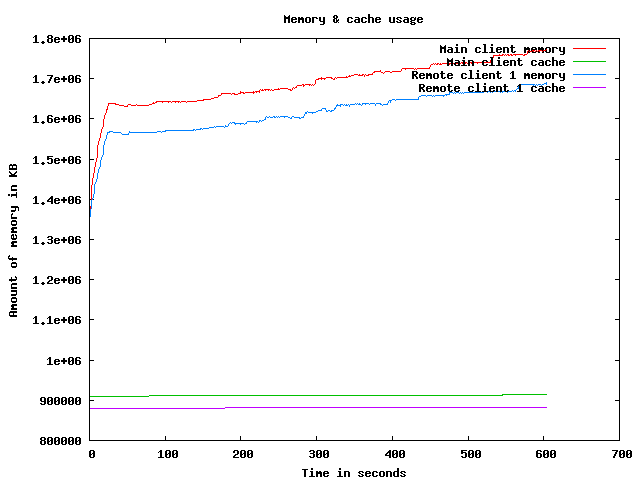
Memory usage graph
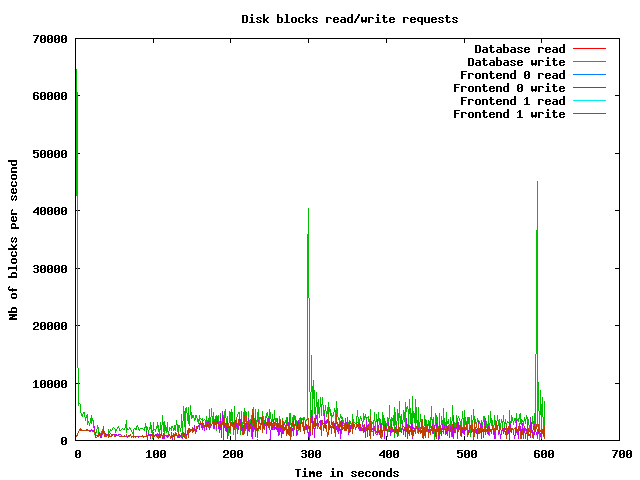
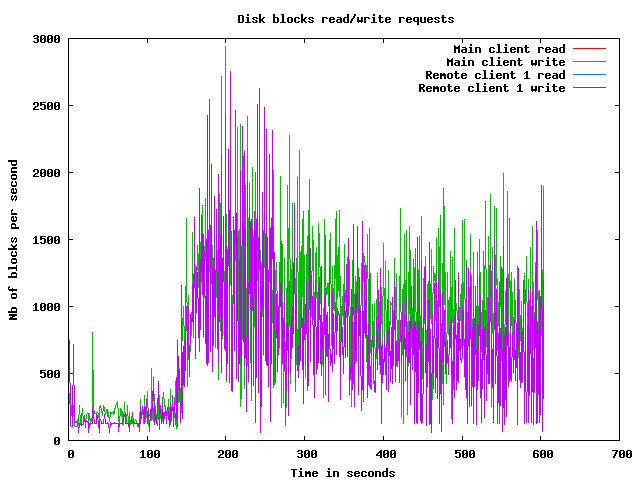
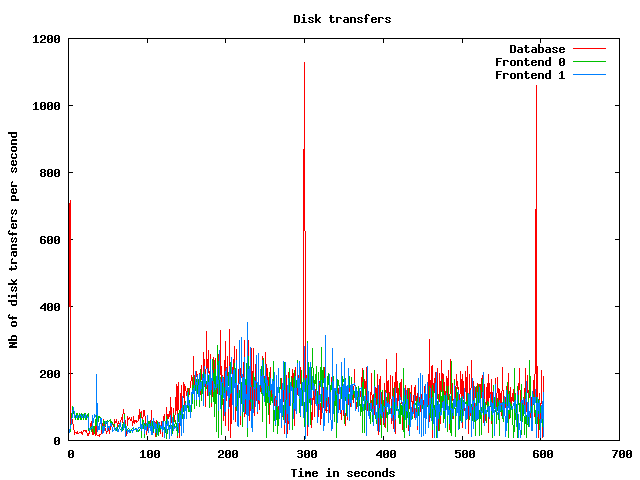
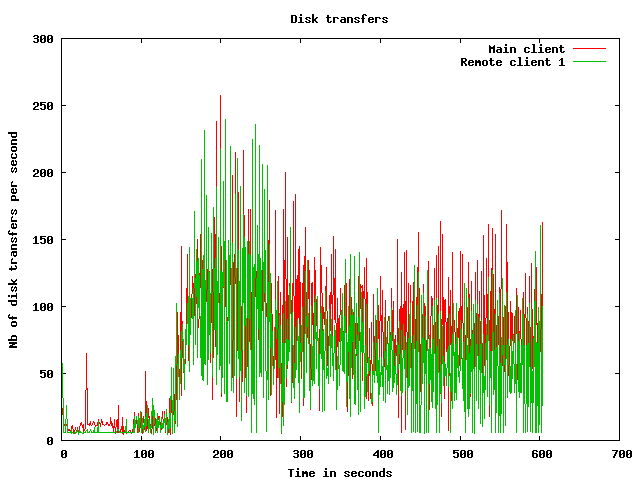
Disk usage graphs
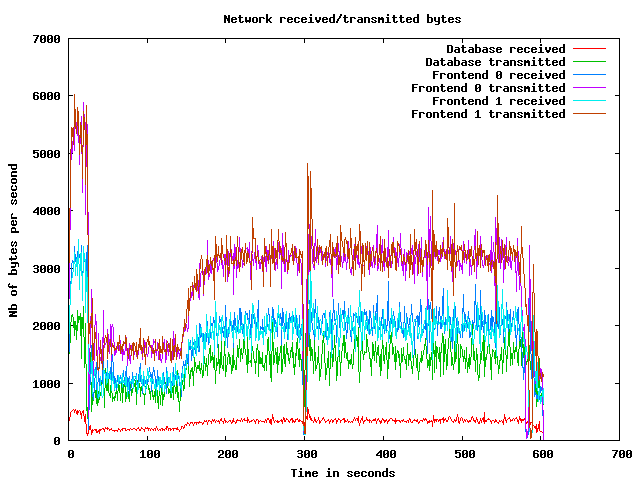
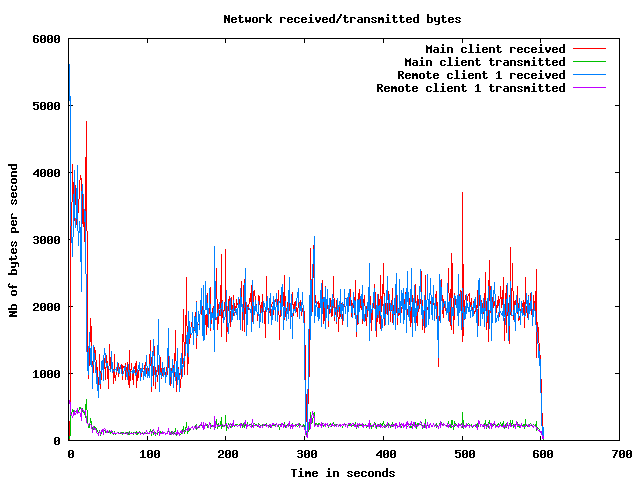
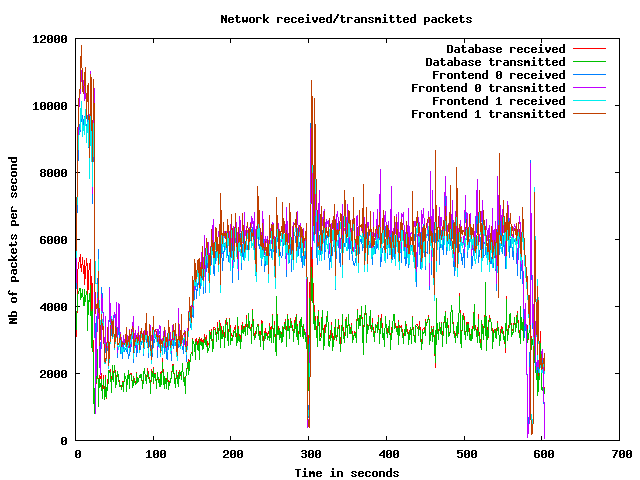
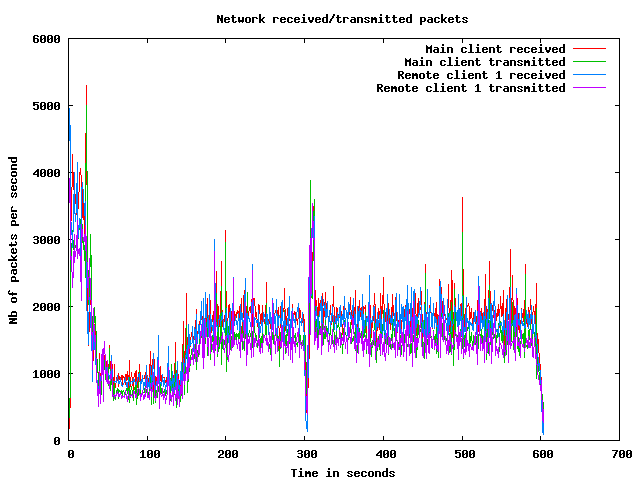
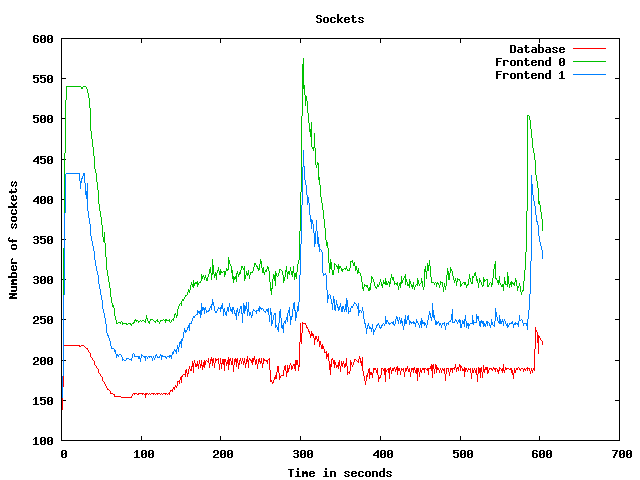
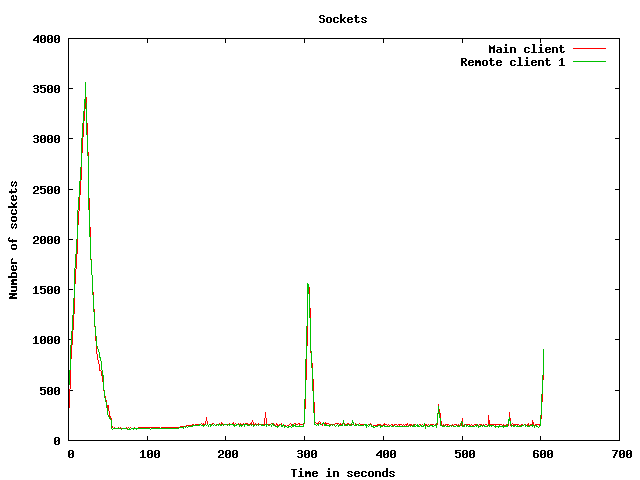
Network usage graphs
| Test start | 2009-3-19 7:8:58 |
| Up ramp start | 2009-3-19 7:9:24 |
| Runtime session start | 2009-3-19 7:11:24 |
| Down ramp start | 2009-3-19 7:18:54 |
| Test end | 2009-3-19 7:21:20 |
| Up ramp length | 2 minutes 1 millisecond (requested 120000 ms) |
| Runtime session length | 7 minutes 30 seconds 0 millisecond (requested 450000 ms) |
| Down ramp length | 30 seconds 1 millisecond (requested 30000 ms) |
| Total test length | 12 minutes 22 seconds 107 milliseconds |
| State name | % of total | Count | Errors | Minimum Time | Maximum Time | Average Time |
|---|---|---|---|---|---|---|
Home | 9 % | 5651 | 0 | 0 ms | 45043 ms | 3802 ms
|
Register | 1 % | 784 | 0 | 0 ms | 45009 ms | 1187 ms
|
RegisterUser | 1 % | 739 | 9 | 5 ms | 45022 ms | 1071 ms
|
Browse | 9 % | 5871 | 0 | 0 ms | 45033 ms | 1562 ms
|
BrowseCategories | 6 % | 3940 | 0 | 3 ms | 45061 ms | 1146 ms
|
SearchItemsInCategory | 15 % | 9509 | 0 | 3 ms | 45055 ms | 936 ms
|
BrowseRegions | 2 % | 1554 | 0 | 3 ms | 45031 ms | 1129 ms
|
BrowseCategoriesInRegion | 2 % | 1442 | 0 | 3 ms | 45040 ms | 1169 ms
|
SearchItemsInRegion | 4 % | 2900 | 0 | 0 ms | 45045 ms | 870 ms
|
ViewItem | 12 % | 7715 | 0 | 3 ms | 45063 ms | 909 ms
|
ViewUserInfo | 2 % | 1447 | 0 | 3 ms | 45043 ms | 738 ms
|
ViewBidHistory | 1 % | 731 | 0 | 3 ms | 22927 ms | 729 ms
|
BuyNowAuth | 1 % | 664 | 0 | 2 ms | 45015 ms | 847 ms
|
BuyNow | 0 % | 602 | 88 | 3 ms | 45011 ms | 791 ms
|
StoreBuyBow | 0 % | 458 | 0 | 4 ms | 45038 ms | 845 ms
|
PutBidAuth | 4 % | 2681 | 0 | 0 ms | 45014 ms | 796 ms
|
PutBid | 4 % | 2665 | 324 | 3 ms | 45025 ms | 716 ms
|
StoreBid | 2 % | 1608 | 0 | 4 ms | 21961 ms | 541 ms
|
PutCommentAuth | 0 % | 0 | 0 | 0 ms | 0 ms | 0 ms
|
PutComment | 0 % | 234 | 33 | 3 ms | 45017 ms | 718 ms
|
StoreComment | 0 % | 180 | 0 | 4 ms | 45008 ms | 652 ms
|
Sell | 0 % | 402 | 0 | 0 ms | 45003 ms | 2072 ms
|
SelectCategoryToSellItem | 0 % | 375 | 0 | 3 ms | 45019 ms | 1337 ms
|
SellItemForm | 0 % | 352 | 0 | 2 ms | 21053 ms | 630 ms
|
RegisterItem | 0 % | 328 | 0 | 4 ms | 23468 ms | 888 ms
|
AboutMe (auth form) | 2 % | 1280 | 0 | 0 ms | 45040 ms | 1418 ms
|
AboutMe | 2 % | 1841 | 0 | 4 ms | 45059 ms | 1085 ms
|
Back probability | 8 % | 4960 | 0 | 0 ms | 0 ms | 0 ms
|
End of Session | 1 % | 672 | 0 | 0 ms | 0 ms | 0 ms
|
Total | 100 % | 61585 | 454 | - | - | 1171 ms
|
Average throughput | 516 req/s
| |||||
Completed sessions | 601
| |||||
Total time | 30835 seconds
| |||||
Average session time | 51 seconds
| |||||
| State name | % of total | Count | Errors | Minimum Time | Maximum Time | Average Time |
|---|---|---|---|---|---|---|
Home | 4 % | 11252 | 0 | 0 ms | 9535 ms | 17 ms
|
Register | 1 % | 2683 | 0 | 0 ms | 21014 ms | 50 ms
|
RegisterUser | 1 % | 2603 | 76 | 4 ms | 9464 ms | 58 ms
|
Browse | 7 % | 18156 | 0 | 0 ms | 9501 ms | 45 ms
|
BrowseCategories | 4 % | 12659 | 0 | 3 ms | 9511 ms | 63 ms
|
SearchItemsInCategory | 15 % | 40479 | 0 | 0 ms | 21312 ms | 60 ms
|
BrowseRegions | 2 % | 5291 | 0 | 3 ms | 9567 ms | 68 ms
|
BrowseCategoriesInRegion | 2 % | 5215 | 0 | 3 ms | 9514 ms | 48 ms
|
SearchItemsInRegion | 5 % | 13073 | 0 | 0 ms | 21041 ms | 74 ms
|
ViewItem | 14 % | 36698 | 0 | 3 ms | 21145 ms | 60 ms
|
ViewUserInfo | 3 % | 8572 | 0 | 3 ms | 9537 ms | 61 ms
|
ViewBidHistory | 1 % | 4375 | 0 | 3 ms | 10115 ms | 105 ms
|
BuyNowAuth | 1 % | 3341 | 0 | 2 ms | 21106 ms | 46 ms
|
BuyNow | 1 % | 3307 | 485 | 4 ms | 9287 ms | 58 ms
|
StoreBuyBow | 1 % | 2776 | 2 | 4 ms | 9505 ms | 49 ms
|
PutBidAuth | 4 % | 12783 | 0 | 0 ms | 21014 ms | 51 ms
|
PutBid | 5 % | 14774 | 1779 | 3 ms | 21039 ms | 67 ms
|
StoreBid | 3 % | 9575 | 5 | 4 ms | 21189 ms | 65 ms
|
PutCommentAuth | 0 % | 0 | 0 | 0 ms | 0 ms | 0 ms
|
PutComment | 0 % | 1326 | 95 | 3 ms | 4340 ms | 25 ms
|
StoreComment | 0 % | 1207 | 0 | 4 ms | 9291 ms | 54 ms
|
Sell | 0 % | 1426 | 0 | 0 ms | 9238 ms | 49 ms
|
SelectCategoryToSellItem | 0 % | 1407 | 0 | 3 ms | 9793 ms | 64 ms
|
SellItemForm | 0 % | 1377 | 0 | 2 ms | 21003 ms | 68 ms
|
RegisterItem | 0 % | 1348 | 0 | 4 ms | 9425 ms | 45 ms
|
AboutMe (auth form) | 1 % | 4384 | 0 | 0 ms | 9261 ms | 44 ms
|
AboutMe | 2 % | 7383 | 0 | 4 ms | 9919 ms | 92 ms
|
Back probability | 10 % | 27229 | 0 | 0 ms | 0 ms | 0 ms
|
End of Session | 1 % | 3589 | 0 | 0 ms | 0 ms | 0 ms
|
Total | 100 % | 258288 | 2442 | - | - | 51 ms
|
Average throughput | 579 req/s
| |||||
Completed sessions | 3600
| |||||
Total time | 909904 seconds
| |||||
Average session time | 252 seconds
| |||||
| State name | % of total | Count | Errors | Minimum Time | Maximum Time | Average Time |
|---|---|---|---|---|---|---|
Home | 4 % | 340 | 0 | 0 ms | 9000 ms | 242 ms
|
Register | 1 % | 97 | 0 | 0 ms | 9010 ms | 491 ms
|
RegisterUser | 1 % | 96 | 1 | 5 ms | 9020 ms | 927 ms
|
Browse | 6 % | 541 | 0 | 0 ms | 9058 ms | 637 ms
|
BrowseCategories | 4 % | 382 | 0 | 3 ms | 9075 ms | 853 ms
|
SearchItemsInCategory | 14 % | 1208 | 0 | 3 ms | 9032 ms | 552 ms
|
BrowseRegions | 2 % | 168 | 0 | 3 ms | 9021 ms | 875 ms
|
BrowseCategoriesInRegion | 2 % | 191 | 0 | 3 ms | 9029 ms | 669 ms
|
SearchItemsInRegion | 5 % | 434 | 0 | 0 ms | 9050 ms | 598 ms
|
ViewItem | 14 % | 1200 | 0 | 3 ms | 9057 ms | 678 ms
|
ViewUserInfo | 3 % | 291 | 0 | 3 ms | 9021 ms | 514 ms
|
ViewBidHistory | 1 % | 146 | 0 | 4 ms | 9041 ms | 534 ms
|
BuyNowAuth | 1 % | 114 | 0 | 2 ms | 9012 ms | 827 ms
|
BuyNow | 1 % | 99 | 19 | 5 ms | 9018 ms | 657 ms
|
StoreBuyBow | 0 % | 81 | 0 | 5 ms | 9011 ms | 796 ms
|
PutBidAuth | 5 % | 433 | 0 | 0 ms | 9008 ms | 603 ms
|
PutBid | 5 % | 491 | 44 | 4 ms | 9041 ms | 672 ms
|
StoreBid | 3 % | 323 | 0 | 5 ms | 9046 ms | 867 ms
|
PutCommentAuth | 0 % | 0 | 0 | 0 ms | 0 ms | 0 ms
|
PutComment | 0 % | 32 | 4 | 4 ms | 9011 ms | 949 ms
|
StoreComment | 0 % | 30 | 0 | 6 ms | 9088 ms | 1260 ms
|
Sell | 0 % | 44 | 0 | 0 ms | 4707 ms | 410 ms
|
SelectCategoryToSellItem | 0 % | 42 | 0 | 4 ms | 9019 ms | 588 ms
|
SellItemForm | 0 % | 44 | 0 | 2 ms | 9002 ms | 752 ms
|
RegisterItem | 0 % | 50 | 0 | 4 ms | 9006 ms | 351 ms
|
AboutMe (auth form) | 1 % | 152 | 0 | 0 ms | 9000 ms | 463 ms
|
AboutMe | 3 % | 257 | 0 | 4 ms | 9120 ms | 592 ms
|
Back probability | 10 % | 845 | 0 | 0 ms | 0 ms | 0 ms
|
End of Session | 1 % | 126 | 0 | 0 ms | 0 ms | 0 ms
|
Total | 100 % | 8257 | 68 | - | - | 554 ms
|
Average throughput | 277 req/s
| |||||
Completed sessions | 131
| |||||
Total time | 43116 seconds
| |||||
Average session time | 329 seconds
| |||||
| State name | % of total | Count | Errors | Minimum Time | Maximum Time | Average Time |
|---|---|---|---|---|---|---|
Home | 5 % | 17243 | 0 | 0 ms | 45043 ms | 1262 ms
|
Register | 1 % | 3564 | 0 | 0 ms | 45009 ms | 312 ms
|
RegisterUser | 1 % | 3438 | 86 | 4 ms | 45022 ms | 300 ms
|
Browse | 7 % | 24568 | 0 | 0 ms | 45033 ms | 420 ms
|
BrowseCategories | 5 % | 16981 | 0 | 3 ms | 45061 ms | 332 ms
|
SearchItemsInCategory | 15 % | 51368 | 0 | 0 ms | 45055 ms | 234 ms
|
BrowseRegions | 2 % | 7013 | 0 | 3 ms | 45031 ms | 322 ms
|
BrowseCategoriesInRegion | 2 % | 6848 | 0 | 3 ms | 45040 ms | 301 ms
|
SearchItemsInRegion | 5 % | 16444 | 0 | 0 ms | 45045 ms | 228 ms
|
ViewItem | 13 % | 45694 | 0 | 3 ms | 45063 ms | 220 ms
|
ViewUserInfo | 3 % | 10331 | 0 | 3 ms | 45043 ms | 169 ms
|
ViewBidHistory | 1 % | 5263 | 0 | 3 ms | 22927 ms | 203 ms
|
BuyNowAuth | 1 % | 4119 | 0 | 2 ms | 45015 ms | 197 ms
|
BuyNow | 1 % | 4008 | 592 | 3 ms | 45011 ms | 183 ms
|
StoreBuyBow | 1 % | 3315 | 2 | 4 ms | 45038 ms | 178 ms
|
PutBidAuth | 4 % | 15897 | 0 | 0 ms | 45014 ms | 192 ms
|
PutBid | 5 % | 17970 | 2147 | 3 ms | 45025 ms | 180 ms
|
StoreBid | 3 % | 11506 | 5 | 4 ms | 21961 ms | 154 ms
|
PutCommentAuth | 0 % | 0 | 0 | 0 ms | 0 ms | 0 ms
|
PutComment | 0 % | 1592 | 132 | 3 ms | 45017 ms | 145 ms
|
StoreComment | 0 % | 1417 | 0 | 4 ms | 45008 ms | 155 ms
|
Sell | 0 % | 1872 | 0 | 0 ms | 45003 ms | 492 ms
|
SelectCategoryToSellItem | 0 % | 1824 | 0 | 3 ms | 45019 ms | 338 ms
|
SellItemForm | 0 % | 1773 | 0 | 2 ms | 21053 ms | 197 ms
|
RegisterItem | 0 % | 1726 | 0 | 4 ms | 23468 ms | 214 ms
|
AboutMe (auth form) | 1 % | 5816 | 0 | 0 ms | 45040 ms | 357 ms
|
AboutMe | 2 % | 9530 | 0 | 4 ms | 45059 ms | 297 ms
|
Back probability | 10 % | 33034 | 0 | 0 ms | 0 ms | 0 ms
|
End of Session | 1 % | 4387 | 0 | 0 ms | 0 ms | 0 ms
|
Total | 100 % | 328541 | 2964 | - | - | 273 ms
|
Average throughput | 552 req/s
| |||||
Completed sessions | 4386
| |||||
Total time | 1002133 seconds
| |||||
Average session time | 228 seconds
| |||||
An error occured while waiting for remote processes termination (Skipping waits)
Command is: /usr/bin/scp farm6.csail.mit.edu:/tmp/client1 /home/drkp/sandbox/txcache/src/RUBiS-1.4.3/bench/2009-3-19@7:8:58//client1.bin
Command is: /usr/bin/ssh -x localhost /bin/bash -c 'LANG=en_GB.UTF-8 /usr/bin/sar -n DEV -n SOCK -rubcw 1 605 -f /home/drkp/sandbox/txcache/src/RUBiS-1.4.3/bench/2009-3-19@7:8:58//client1.bin > /home/drkp/sandbox/txcache/src/RUBiS-1.4.3/bench/2009-3-19@7:8:58//client1'
Command is: /usr/bin/scp farm14:/tmp/db_server0 /home/drkp/sandbox/txcache/src/RUBiS-1.4.3/bench/2009-3-19@7:8:58//db_server0.bin
Command is: /usr/bin/ssh -x localhost /bin/bash -c 'LANG=en_GB.UTF-8 /usr/bin/sar -n DEV -n SOCK -rubcw 1 605 -f /home/drkp/sandbox/txcache/src/RUBiS-1.4.3/bench/2009-3-19@7:8:58//db_server0.bin > /home/drkp/sandbox/txcache/src/RUBiS-1.4.3/bench/2009-3-19@7:8:58//db_server0'
Command is: /usr/bin/scp farm12.csail.mit.edu:/tmp/web_server0 /home/drkp/sandbox/txcache/src/RUBiS-1.4.3/bench/2009-3-19@7:8:58//web_server0.bin
Command is: /usr/bin/ssh -x localhost /bin/bash -c 'LANG=en_GB.UTF-8 /usr/bin/sar -n DEV -n SOCK -rubcw 1 605 -f /home/drkp/sandbox/txcache/src/RUBiS-1.4.3/bench/2009-3-19@7:8:58//web_server0.bin > /home/drkp/sandbox/txcache/src/RUBiS-1.4.3/bench/2009-3-19@7:8:58//web_server0'
Command is: /usr/bin/scp farm13.csail.mit.edu:/tmp/web_server1 /home/drkp/sandbox/txcache/src/RUBiS-1.4.3/bench/2009-3-19@7:8:58//web_server1.bin
Command is: /usr/bin/ssh -x localhost /bin/bash -c 'LANG=en_GB.UTF-8 /usr/bin/sar -n DEV -n SOCK -rubcw 1 605 -f /home/drkp/sandbox/txcache/src/RUBiS-1.4.3/bench/2009-3-19@7:8:58//web_server1.bin > /home/drkp/sandbox/txcache/src/RUBiS-1.4.3/bench/2009-3-19@7:8:58//web_server1'
Command is: /usr/bin/scp localhost:/tmp/client0 /home/drkp/sandbox/txcache/src/RUBiS-1.4.3/bench/2009-3-19@7:8:58//client0.bin
Command is: /usr/bin/ssh -x localhost /bin/bash -c 'LANG=en_GB.UTF-8 /usr/bin/sar -n DEV -n SOCK -rubcw 1 605 -f /home/drkp/sandbox/txcache/src/RUBiS-1.4.3/bench/2009-3-19@7:8:58//client0.bin > /home/drkp/sandbox/txcache/src/RUBiS-1.4.3/bench/2009-3-19@7:8:58//client0'
Command is: /usr/bin/scp farm6.csail.mit.edu:/tmp/trace_client1.html /home/drkp/sandbox/txcache/src/RUBiS-1.4.3/bench/2009-3-19@7:8:58//
Command is: /usr/bin/scp farm6.csail.mit.edu:/tmp/stat_client1.html /home/drkp/sandbox/txcache/src/RUBiS-1.4.3/bench/2009-3-19@7:8:58//
|
|
|
|
|
|
 | 
|
 | 
|
 | 
|
 | 
|
 | 
|
 | 
|
 | 
|
 | 
|
 | 
|