Node information
Test timing information
Up ramp statistics
Runtime session statistics
Down ramp statistics
Overall statistics
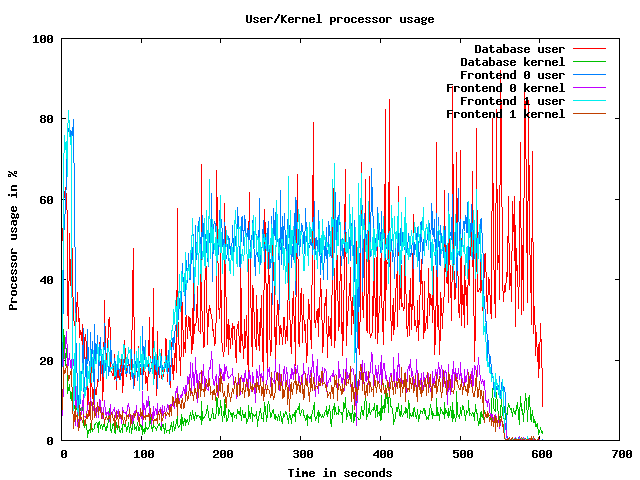
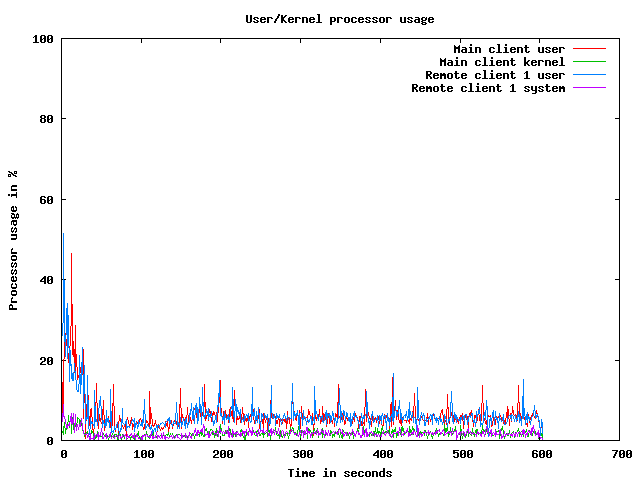
CPU usage graphs
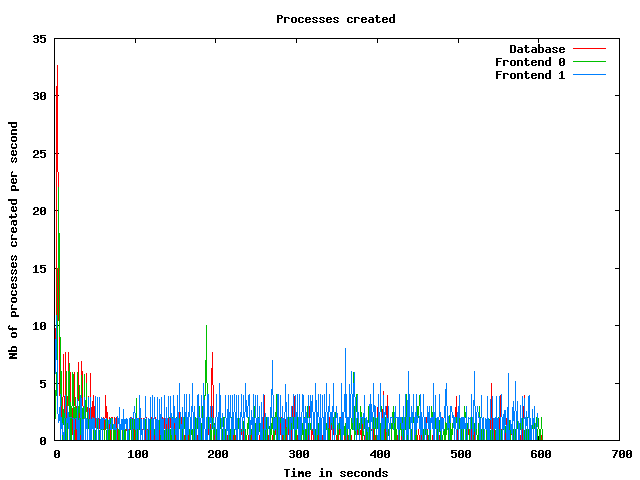
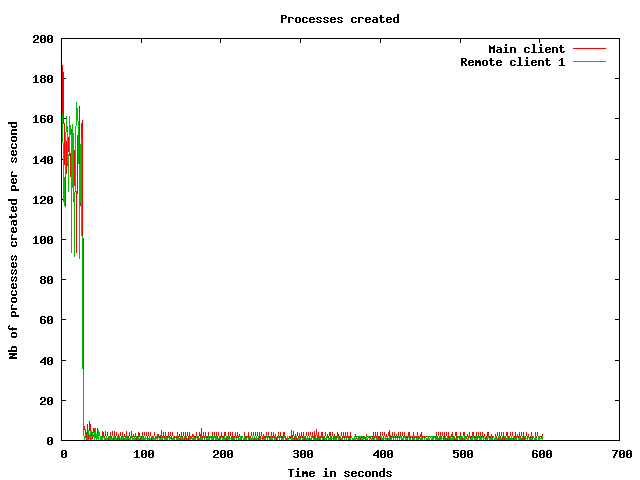
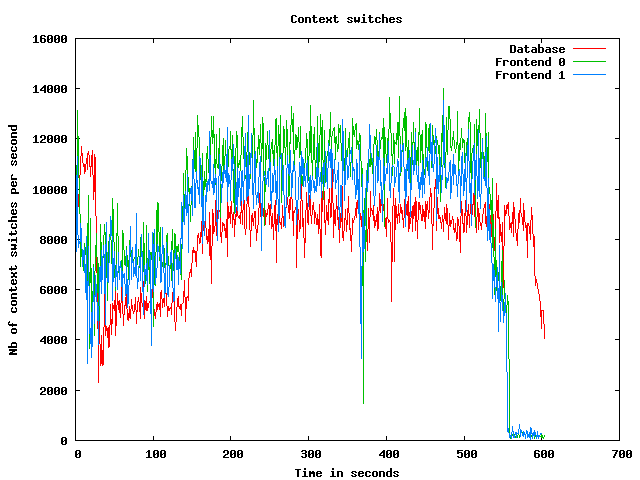
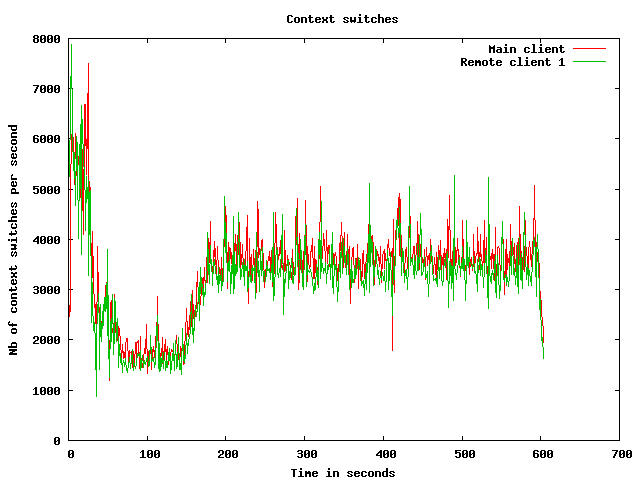
Processes usage graphs
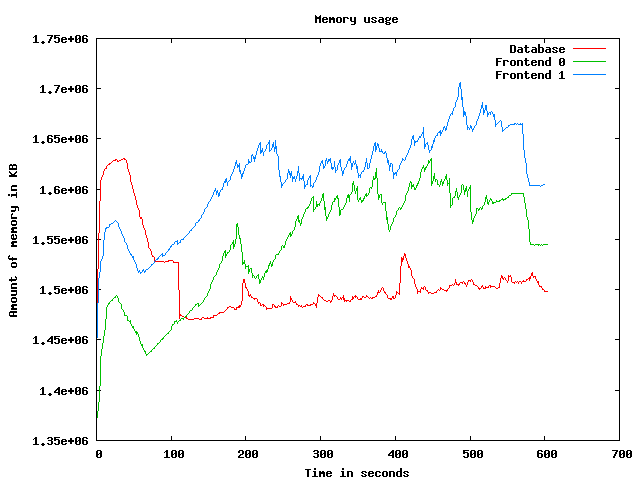
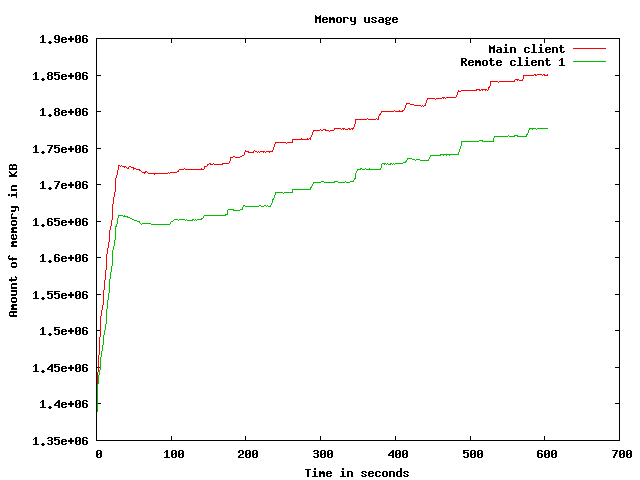
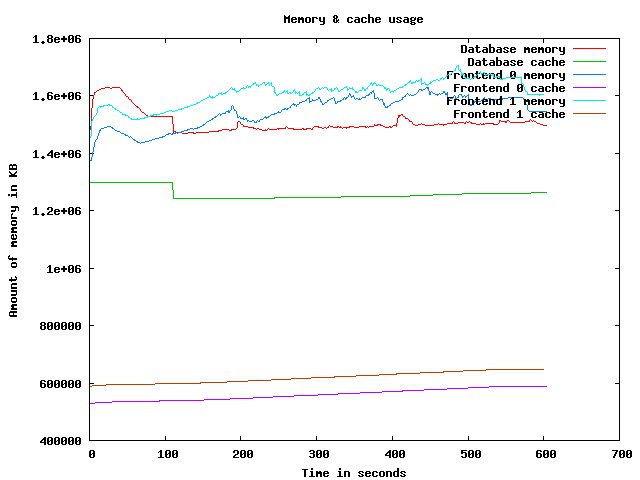
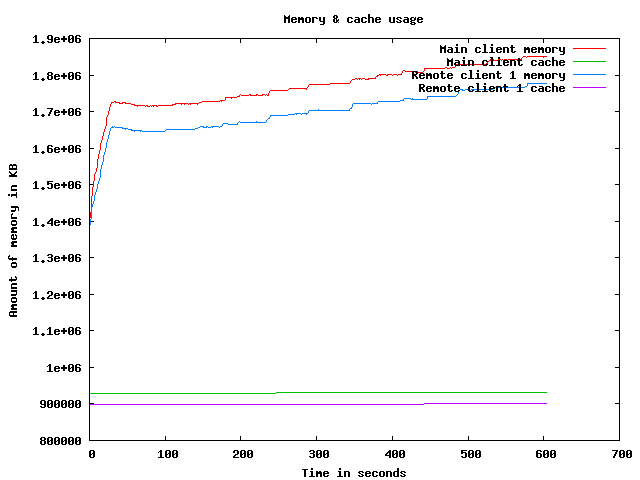
Memory usage graph
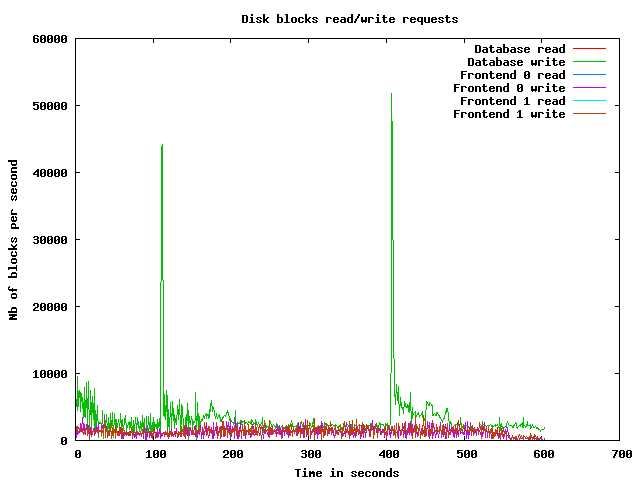
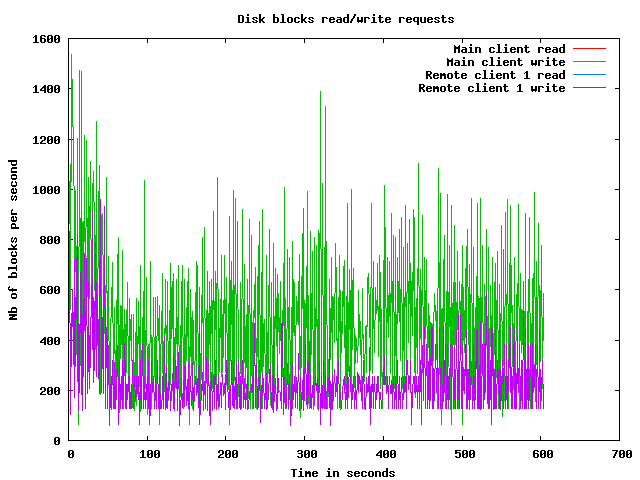
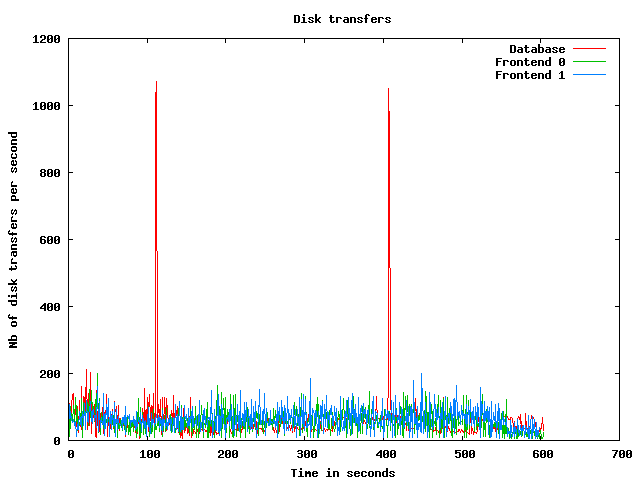
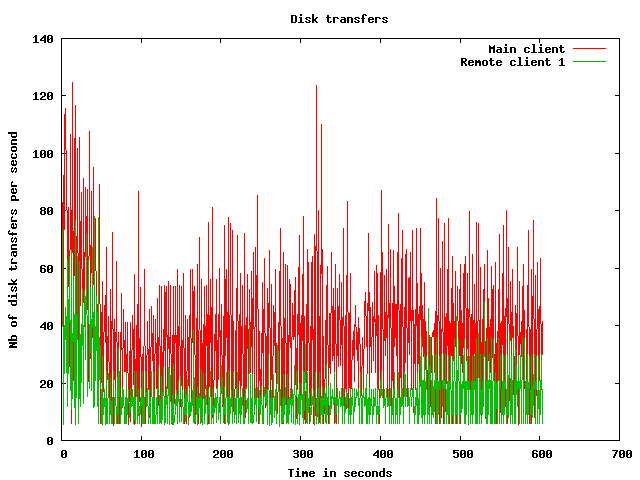
Disk usage graphs
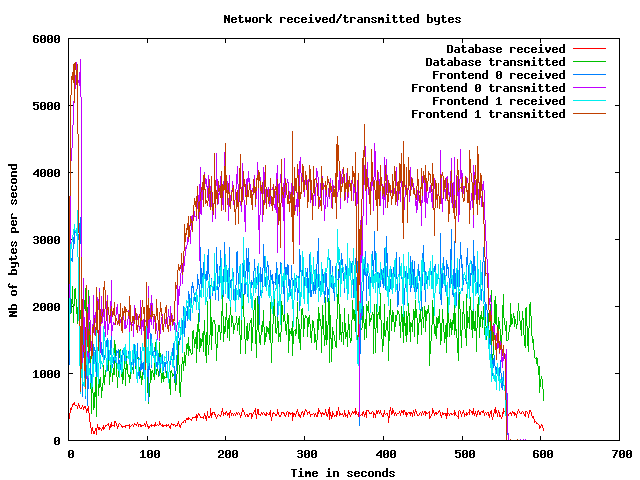
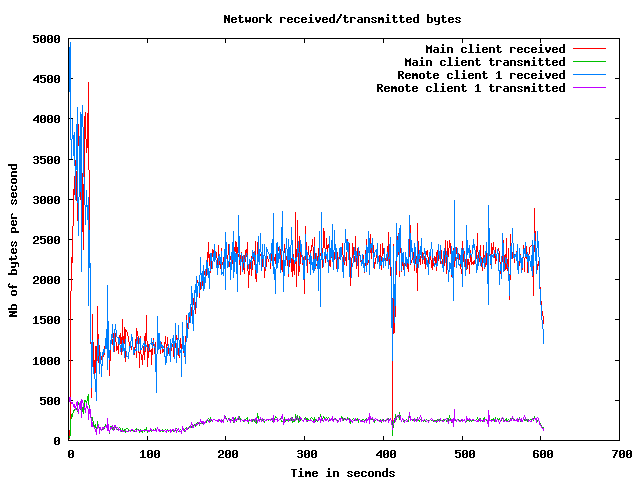
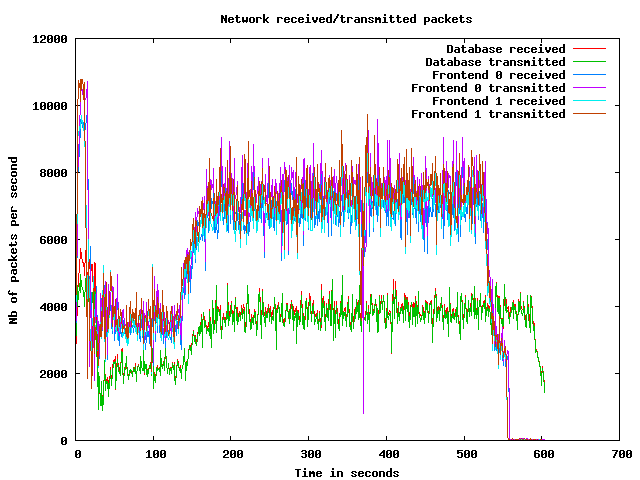
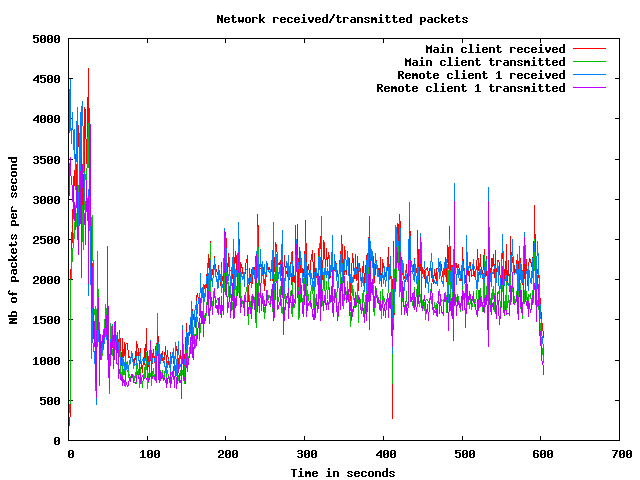
Network usage graphs
| Test start | 2009-3-19 7:22:8 |
| Up ramp start | 2009-3-19 7:22:37 |
| Runtime session start | 2009-3-19 7:24:37 |
| Down ramp start | 2009-3-19 7:32:7 |
| Test end | 2009-3-19 7:34:41 |
| Up ramp length | 2 minutes 1 millisecond (requested 120000 ms) |
| Runtime session length | 7 minutes 30 seconds 0 millisecond (requested 450000 ms) |
| Down ramp length | 30 seconds 0 millisecond (requested 30000 ms) |
| Total test length | 12 minutes 33 seconds 864 milliseconds |
| State name | % of total | Count | Errors | Minimum Time | Maximum Time | Average Time |
|---|---|---|---|---|---|---|
Home | 9 % | 6371 | 0 | 0 ms | 65224 ms | 5222 ms
|
Register | 1 % | 905 | 0 | 0 ms | 45039 ms | 1547 ms
|
RegisterUser | 1 % | 833 | 13 | 5 ms | 45063 ms | 1203 ms
|
Browse | 9 % | 6407 | 0 | 0 ms | 59110 ms | 1894 ms
|
BrowseCategories | 6 % | 4232 | 0 | 3 ms | 45045 ms | 1457 ms
|
SearchItemsInCategory | 14 % | 10022 | 0 | 0 ms | 59110 ms | 1164 ms
|
BrowseRegions | 2 % | 1784 | 0 | 3 ms | 45047 ms | 1646 ms
|
BrowseCategoriesInRegion | 2 % | 1680 | 0 | 3 ms | 45047 ms | 1290 ms
|
SearchItemsInRegion | 5 % | 3443 | 0 | 0 ms | 45089 ms | 1010 ms
|
ViewItem | 12 % | 8599 | 0 | 3 ms | 45071 ms | 1115 ms
|
ViewUserInfo | 2 % | 1614 | 0 | 3 ms | 45049 ms | 811 ms
|
ViewBidHistory | 1 % | 838 | 0 | 3 ms | 45120 ms | 981 ms
|
BuyNowAuth | 1 % | 716 | 0 | 2 ms | 45026 ms | 1155 ms
|
BuyNow | 0 % | 652 | 97 | 4 ms | 45037 ms | 1146 ms
|
StoreBuyBow | 0 % | 481 | 1 | 4 ms | 45025 ms | 1270 ms
|
PutBidAuth | 4 % | 2901 | 0 | 0 ms | 45063 ms | 900 ms
|
PutBid | 4 % | 2896 | 371 | 3 ms | 45106 ms | 1038 ms
|
StoreBid | 2 % | 1669 | 1 | 5 ms | 45074 ms | 849 ms
|
PutCommentAuth | 0 % | 0 | 0 | 0 ms | 0 ms | 0 ms
|
PutComment | 0 % | 273 | 31 | 4 ms | 45019 ms | 1489 ms
|
StoreComment | 0 % | 214 | 0 | 5 ms | 7119 ms | 65 ms
|
Sell | 0 % | 493 | 0 | 0 ms | 45001 ms | 1894 ms
|
SelectCategoryToSellItem | 0 % | 460 | 0 | 3 ms | 45019 ms | 1479 ms
|
SellItemForm | 0 % | 430 | 0 | 2 ms | 45005 ms | 1758 ms
|
RegisterItem | 0 % | 402 | 0 | 4 ms | 45019 ms | 1268 ms
|
AboutMe (auth form) | 2 % | 1496 | 0 | 0 ms | 45018 ms | 1967 ms
|
AboutMe | 3 % | 2139 | 0 | 4 ms | 45111 ms | 1594 ms
|
Back probability | 8 % | 5511 | 0 | 0 ms | 0 ms | 0 ms
|
End of Session | 1 % | 734 | 0 | 0 ms | 0 ms | 0 ms
|
Total | 100 % | 68195 | 514 | - | - | 1525 ms
|
Average throughput | 572 req/s
| |||||
Completed sessions | 653
| |||||
Total time | 34289 seconds
| |||||
Average session time | 52 seconds
| |||||
| State name | % of total | Count | Errors | Minimum Time | Maximum Time | Average Time |
|---|---|---|---|---|---|---|
Home | 4 % | 12458 | 0 | 0 ms | 21123 ms | 13 ms
|
Register | 1 % | 3038 | 0 | 0 ms | 21055 ms | 28 ms
|
RegisterUser | 1 % | 3028 | 111 | 4 ms | 5457 ms | 40 ms
|
Browse | 7 % | 20755 | 0 | 0 ms | 21650 ms | 38 ms
|
BrowseCategories | 4 % | 14523 | 0 | 3 ms | 21713 ms | 49 ms
|
SearchItemsInCategory | 15 % | 45797 | 0 | 3 ms | 21718 ms | 54 ms
|
BrowseRegions | 2 % | 6003 | 0 | 3 ms | 21669 ms | 49 ms
|
BrowseCategoriesInRegion | 2 % | 5893 | 0 | 3 ms | 21383 ms | 54 ms
|
SearchItemsInRegion | 5 % | 14873 | 0 | 0 ms | 21667 ms | 62 ms
|
ViewItem | 14 % | 41623 | 0 | 3 ms | 21703 ms | 53 ms
|
ViewUserInfo | 3 % | 9462 | 0 | 3 ms | 21624 ms | 61 ms
|
ViewBidHistory | 1 % | 5064 | 0 | 3 ms | 21930 ms | 107 ms
|
BuyNowAuth | 1 % | 3940 | 0 | 2 ms | 10019 ms | 32 ms
|
BuyNow | 1 % | 3864 | 512 | 3 ms | 5362 ms | 36 ms
|
StoreBuyBow | 1 % | 3289 | 0 | 5 ms | 21008 ms | 39 ms
|
PutBidAuth | 4 % | 14656 | 0 | 0 ms | 21715 ms | 47 ms
|
PutBid | 5 % | 16891 | 1917 | 0 ms | 21703 ms | 53 ms
|
StoreBid | 3 % | 11086 | 6 | 5 ms | 21677 ms | 43 ms
|
PutCommentAuth | 0 % | 0 | 0 | 0 ms | 0 ms | 0 ms
|
PutComment | 0 % | 1473 | 110 | 4 ms | 21596 ms | 57 ms
|
StoreComment | 0 % | 1343 | 0 | 4 ms | 21069 ms | 66 ms
|
Sell | 0 % | 1700 | 0 | 0 ms | 21719 ms | 40 ms
|
SelectCategoryToSellItem | 0 % | 1674 | 0 | 4 ms | 10182 ms | 31 ms
|
SellItemForm | 0 % | 1650 | 0 | 2 ms | 21078 ms | 30 ms
|
RegisterItem | 0 % | 1616 | 0 | 4 ms | 21077 ms | 60 ms
|
AboutMe (auth form) | 1 % | 4878 | 0 | 0 ms | 9717 ms | 21 ms
|
AboutMe | 2 % | 8366 | 0 | 4 ms | 21530 ms | 81 ms
|
Back probability | 10 % | 30797 | 0 | 0 ms | 0 ms | 0 ms
|
End of Session | 1 % | 4293 | 0 | 0 ms | 0 ms | 0 ms
|
Total | 100 % | 294033 | 2656 | - | - | 43 ms
|
Average throughput | 659 req/s
| |||||
Completed sessions | 4290
| |||||
Total time | 1087994 seconds
| |||||
Average session time | 253 seconds
| |||||
| State name | % of total | Count | Errors | Minimum Time | Maximum Time | Average Time |
|---|---|---|---|---|---|---|
Home | 4 % | 449 | 0 | 0 ms | 32 ms | 0 ms
|
Register | 0 % | 92 | 0 | 0 ms | 10 ms | 0 ms
|
RegisterUser | 0 % | 74 | 7 | 4 ms | 56 ms | 14 ms
|
Browse | 6 % | 671 | 0 | 0 ms | 24 ms | 1 ms
|
BrowseCategories | 4 % | 466 | 0 | 3 ms | 42 ms | 7 ms
|
SearchItemsInCategory | 15 % | 1510 | 0 | 3 ms | 510 ms | 11 ms
|
BrowseRegions | 2 % | 204 | 0 | 3 ms | 50 ms | 7 ms
|
BrowseCategoriesInRegion | 1 % | 195 | 0 | 3 ms | 51 ms | 8 ms
|
SearchItemsInRegion | 5 % | 514 | 0 | 0 ms | 482 ms | 23 ms
|
ViewItem | 14 % | 1393 | 0 | 3 ms | 177 ms | 11 ms
|
ViewUserInfo | 3 % | 302 | 0 | 3 ms | 58 ms | 11 ms
|
ViewBidHistory | 1 % | 170 | 0 | 3 ms | 494 ms | 73 ms
|
BuyNowAuth | 1 % | 130 | 0 | 2 ms | 37 ms | 4 ms
|
BuyNow | 1 % | 129 | 14 | 5 ms | 50 ms | 12 ms
|
StoreBuyBow | 1 % | 107 | 0 | 4 ms | 48 ms | 11 ms
|
PutBidAuth | 5 % | 509 | 0 | 0 ms | 27 ms | 3 ms
|
PutBid | 5 % | 568 | 65 | 3 ms | 52 ms | 13 ms
|
StoreBid | 4 % | 398 | 0 | 4 ms | 44 ms | 10 ms
|
PutCommentAuth | 0 % | 0 | 0 | 0 ms | 0 ms | 0 ms
|
PutComment | 0 % | 34 | 4 | 4 ms | 47 ms | 17 ms
|
StoreComment | 0 % | 38 | 0 | 4 ms | 45 ms | 11 ms
|
Sell | 0 % | 48 | 0 | 0 ms | 9 ms | 1 ms
|
SelectCategoryToSellItem | 0 % | 52 | 0 | 4 ms | 29 ms | 9 ms
|
SellItemForm | 0 % | 51 | 0 | 2 ms | 34 ms | 5 ms
|
RegisterItem | 0 % | 59 | 0 | 4 ms | 137 ms | 9 ms
|
AboutMe (auth form) | 1 % | 185 | 0 | 0 ms | 9 ms | 0 ms
|
AboutMe | 2 % | 279 | 0 | 4 ms | 124 ms | 27 ms
|
Back probability | 10 % | 1051 | 0 | 0 ms | 0 ms | 0 ms
|
End of Session | 1 % | 169 | 0 | 0 ms | 0 ms | 0 ms
|
Total | 100 % | 9847 | 90 | - | - | 9 ms
|
Average throughput | 331 req/s
| |||||
Completed sessions | 174
| |||||
Total time | 55548 seconds
| |||||
Average session time | 319 seconds
| |||||
| State name | % of total | Count | Errors | Minimum Time | Maximum Time | Average Time |
|---|---|---|---|---|---|---|
Home | 5 % | 19278 | 0 | 0 ms | 65224 ms | 1734 ms
|
Register | 1 % | 4035 | 0 | 0 ms | 45039 ms | 368 ms
|
RegisterUser | 1 % | 3935 | 131 | 4 ms | 45063 ms | 286 ms
|
Browse | 7 % | 27833 | 0 | 0 ms | 59110 ms | 464 ms
|
BrowseCategories | 5 % | 19221 | 0 | 3 ms | 45045 ms | 358 ms
|
SearchItemsInCategory | 15 % | 57569 | 0 | 0 ms | 59110 ms | 246 ms
|
BrowseRegions | 2 % | 7991 | 0 | 3 ms | 45047 ms | 405 ms
|
BrowseCategoriesInRegion | 2 % | 7768 | 0 | 3 ms | 45047 ms | 320 ms
|
SearchItemsInRegion | 5 % | 18879 | 0 | 0 ms | 45089 ms | 234 ms
|
ViewItem | 13 % | 51698 | 0 | 3 ms | 45071 ms | 228 ms
|
ViewUserInfo | 3 % | 11402 | 0 | 3 ms | 45049 ms | 165 ms
|
ViewBidHistory | 1 % | 6090 | 0 | 3 ms | 45120 ms | 226 ms
|
BuyNowAuth | 1 % | 4786 | 0 | 2 ms | 45026 ms | 199 ms
|
BuyNow | 1 % | 4645 | 623 | 3 ms | 45037 ms | 191 ms
|
StoreBuyBow | 1 % | 3877 | 1 | 4 ms | 45025 ms | 191 ms
|
PutBidAuth | 4 % | 18066 | 0 | 0 ms | 45063 ms | 182 ms
|
PutBid | 5 % | 20404 | 2353 | 0 ms | 45106 ms | 191 ms
|
StoreBid | 3 % | 13154 | 7 | 4 ms | 45074 ms | 144 ms
|
PutCommentAuth | 0 % | 0 | 0 | 0 ms | 0 ms | 0 ms
|
PutComment | 0 % | 1780 | 145 | 4 ms | 45019 ms | 276 ms
|
StoreComment | 0 % | 1595 | 0 | 4 ms | 21069 ms | 64 ms
|
Sell | 0 % | 2241 | 0 | 0 ms | 45001 ms | 447 ms
|
SelectCategoryToSellItem | 0 % | 2186 | 0 | 3 ms | 45019 ms | 335 ms
|
SellItemForm | 0 % | 2131 | 0 | 2 ms | 45005 ms | 378 ms
|
RegisterItem | 0 % | 2077 | 0 | 4 ms | 45019 ms | 293 ms
|
AboutMe (auth form) | 1 % | 6559 | 0 | 0 ms | 45018 ms | 465 ms
|
AboutMe | 2 % | 10837 | 0 | 4 ms | 45111 ms | 378 ms
|
Back probability | 10 % | 37359 | 0 | 0 ms | 0 ms | 0 ms
|
End of Session | 1 % | 5196 | 0 | 0 ms | 0 ms | 0 ms
|
Total | 100 % | 372592 | 3260 | - | - | 313 ms
|
Average throughput | 626 req/s
| |||||
Completed sessions | 5196
| |||||
Total time | 1203569 seconds
| |||||
Average session time | 231 seconds
| |||||
An error occured while waiting for remote processes termination (Skipping waits)
Command is: /usr/bin/scp farm6.csail.mit.edu:/tmp/client1 /home/drkp/sandbox/txcache/src/RUBiS-1.4.3/bench/2009-3-19@7:22:8//client1.bin
Command is: /usr/bin/ssh -x localhost /bin/bash -c 'LANG=en_GB.UTF-8 /usr/bin/sar -n DEV -n SOCK -rubcw 1 605 -f /home/drkp/sandbox/txcache/src/RUBiS-1.4.3/bench/2009-3-19@7:22:8//client1.bin > /home/drkp/sandbox/txcache/src/RUBiS-1.4.3/bench/2009-3-19@7:22:8//client1'
Command is: /usr/bin/scp farm14:/tmp/db_server0 /home/drkp/sandbox/txcache/src/RUBiS-1.4.3/bench/2009-3-19@7:22:8//db_server0.bin
Command is: /usr/bin/ssh -x localhost /bin/bash -c 'LANG=en_GB.UTF-8 /usr/bin/sar -n DEV -n SOCK -rubcw 1 605 -f /home/drkp/sandbox/txcache/src/RUBiS-1.4.3/bench/2009-3-19@7:22:8//db_server0.bin > /home/drkp/sandbox/txcache/src/RUBiS-1.4.3/bench/2009-3-19@7:22:8//db_server0'
Command is: /usr/bin/scp farm12.csail.mit.edu:/tmp/web_server0 /home/drkp/sandbox/txcache/src/RUBiS-1.4.3/bench/2009-3-19@7:22:8//web_server0.bin
Command is: /usr/bin/ssh -x localhost /bin/bash -c 'LANG=en_GB.UTF-8 /usr/bin/sar -n DEV -n SOCK -rubcw 1 605 -f /home/drkp/sandbox/txcache/src/RUBiS-1.4.3/bench/2009-3-19@7:22:8//web_server0.bin > /home/drkp/sandbox/txcache/src/RUBiS-1.4.3/bench/2009-3-19@7:22:8//web_server0'
Command is: /usr/bin/scp farm13.csail.mit.edu:/tmp/web_server1 /home/drkp/sandbox/txcache/src/RUBiS-1.4.3/bench/2009-3-19@7:22:8//web_server1.bin
Command is: /usr/bin/ssh -x localhost /bin/bash -c 'LANG=en_GB.UTF-8 /usr/bin/sar -n DEV -n SOCK -rubcw 1 605 -f /home/drkp/sandbox/txcache/src/RUBiS-1.4.3/bench/2009-3-19@7:22:8//web_server1.bin > /home/drkp/sandbox/txcache/src/RUBiS-1.4.3/bench/2009-3-19@7:22:8//web_server1'
Command is: /usr/bin/scp localhost:/tmp/client0 /home/drkp/sandbox/txcache/src/RUBiS-1.4.3/bench/2009-3-19@7:22:8//client0.bin
Command is: /usr/bin/ssh -x localhost /bin/bash -c 'LANG=en_GB.UTF-8 /usr/bin/sar -n DEV -n SOCK -rubcw 1 605 -f /home/drkp/sandbox/txcache/src/RUBiS-1.4.3/bench/2009-3-19@7:22:8//client0.bin > /home/drkp/sandbox/txcache/src/RUBiS-1.4.3/bench/2009-3-19@7:22:8//client0'
Command is: /usr/bin/scp farm6.csail.mit.edu:/tmp/trace_client1.html /home/drkp/sandbox/txcache/src/RUBiS-1.4.3/bench/2009-3-19@7:22:8//
Command is: /usr/bin/scp farm6.csail.mit.edu:/tmp/stat_client1.html /home/drkp/sandbox/txcache/src/RUBiS-1.4.3/bench/2009-3-19@7:22:8//
|
|
|
|
|
|
 | 
|
 | 
|
 | 
|
 | 
|
 | 
|
 | 
|
 | 
|
 | 
|
 | 
|