Node information
Test timing information
Up ramp statistics
Runtime session statistics
Down ramp statistics
Overall statistics
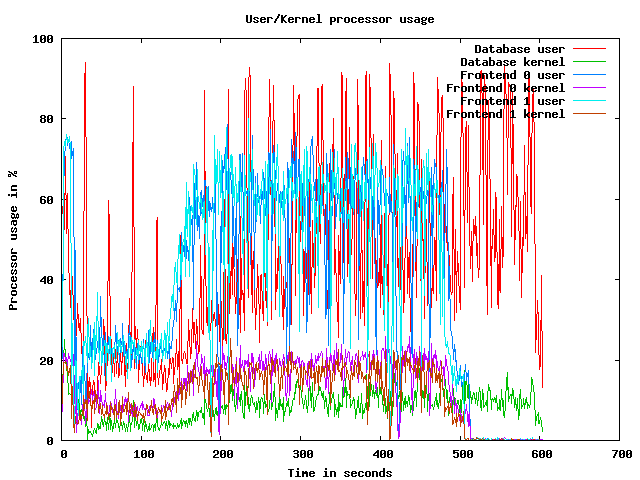
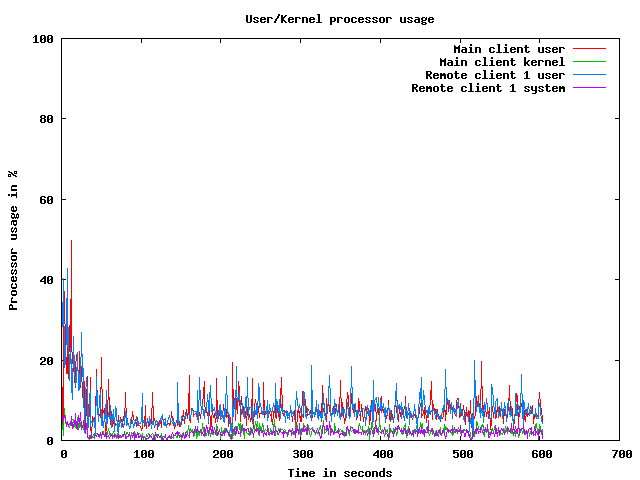
CPU usage graphs
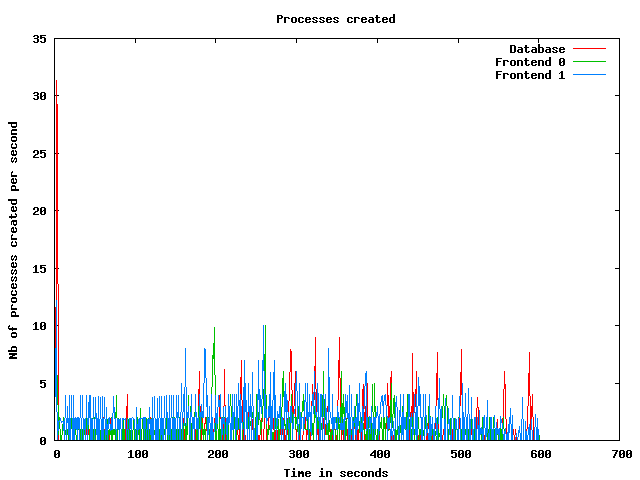
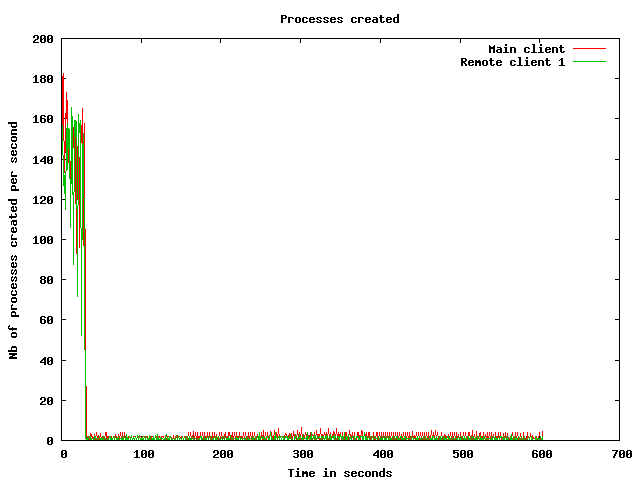
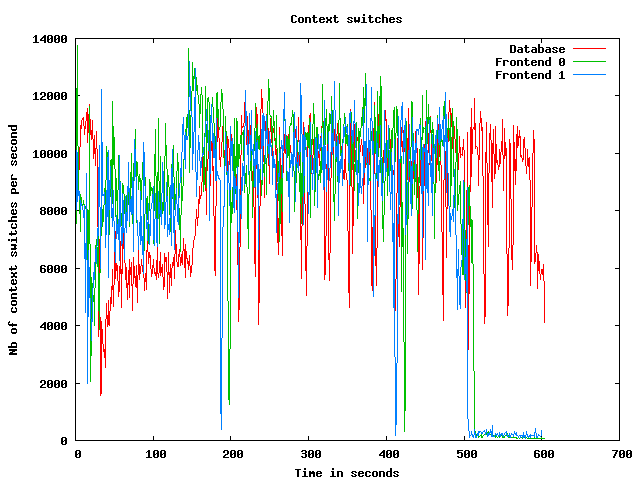
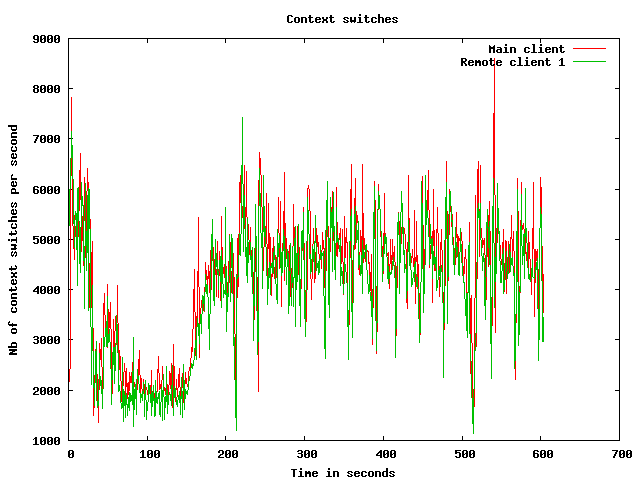
Processes usage graphs
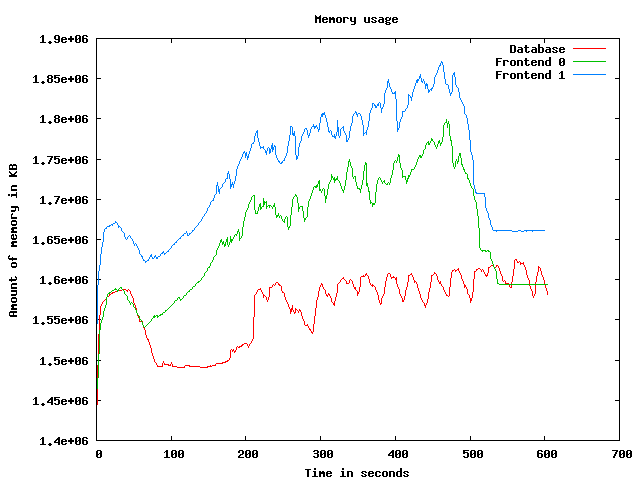
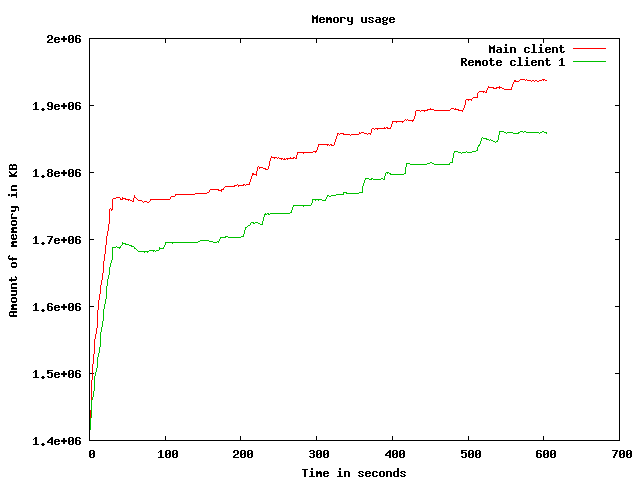
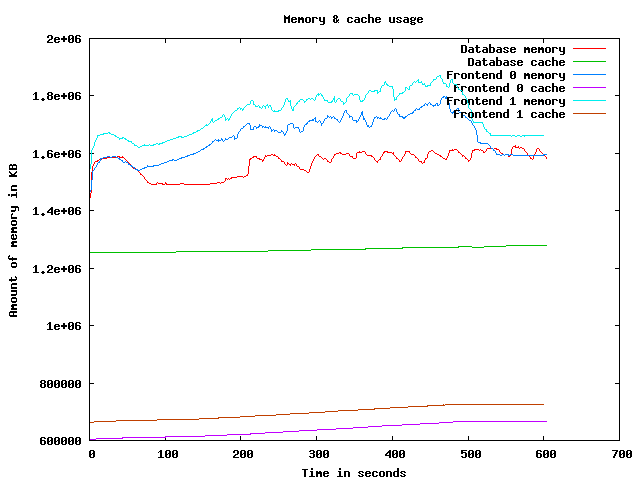
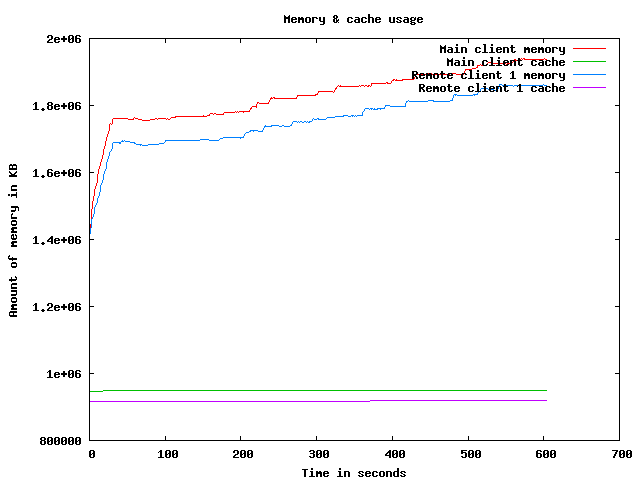
Memory usage graph
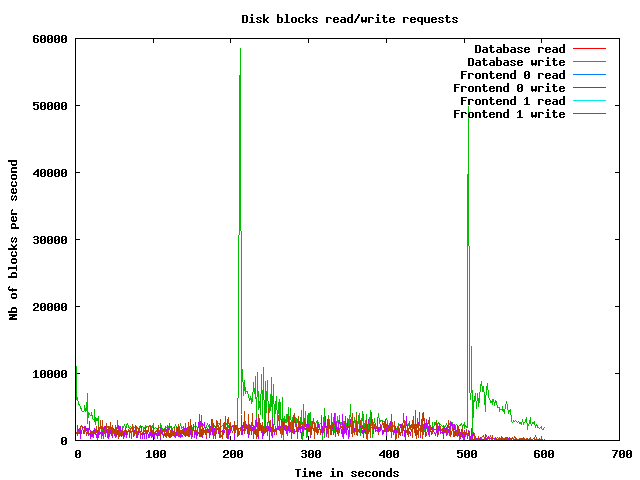
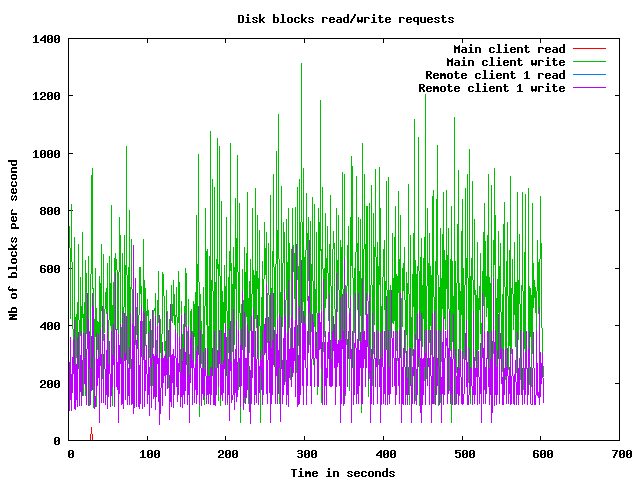
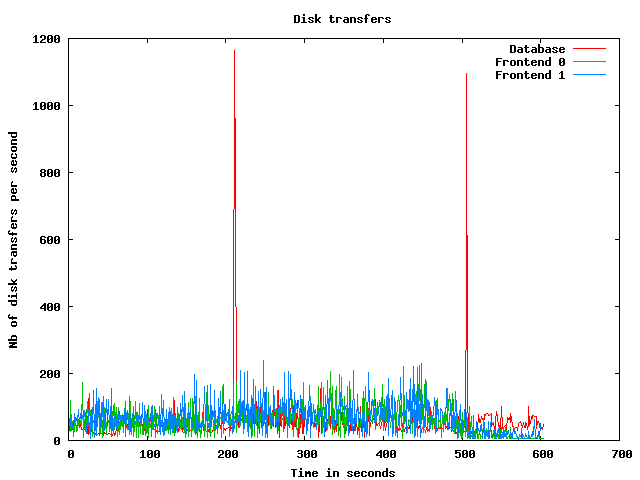
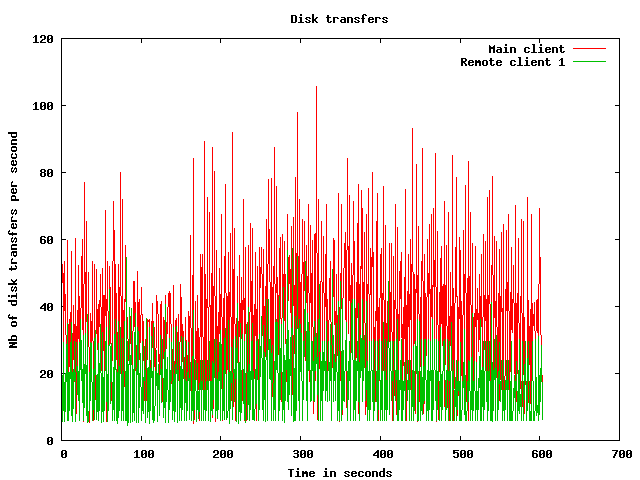
Disk usage graphs
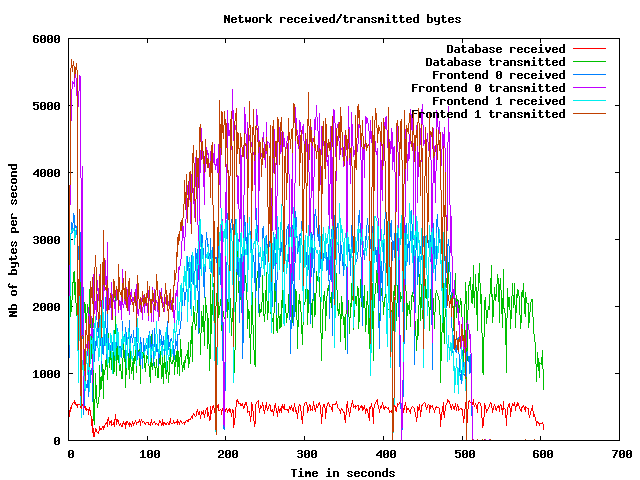
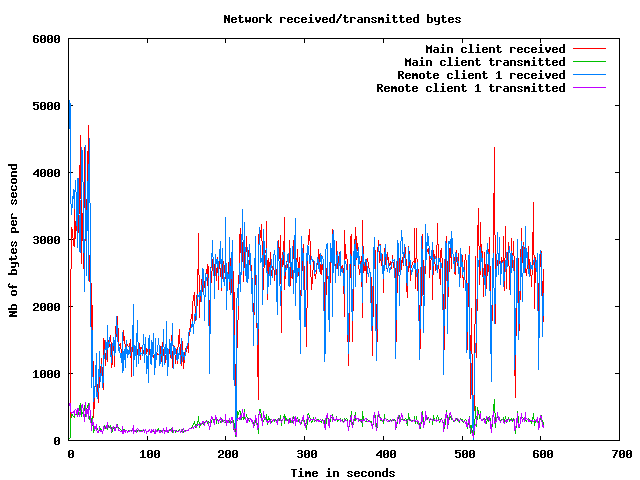
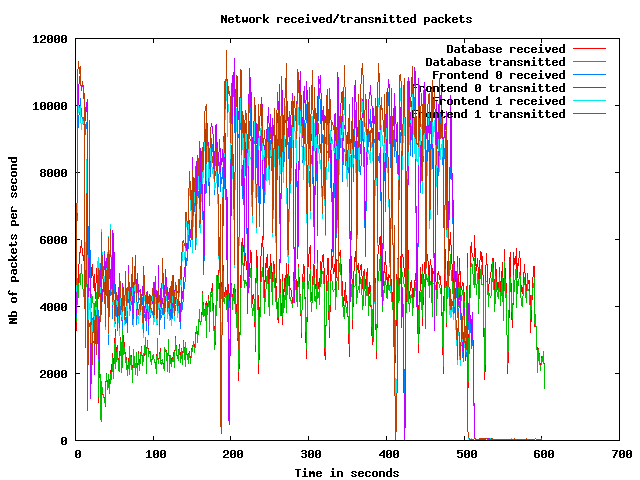
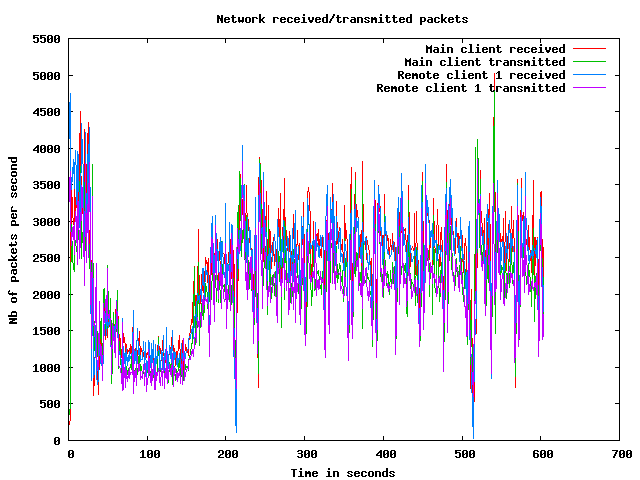
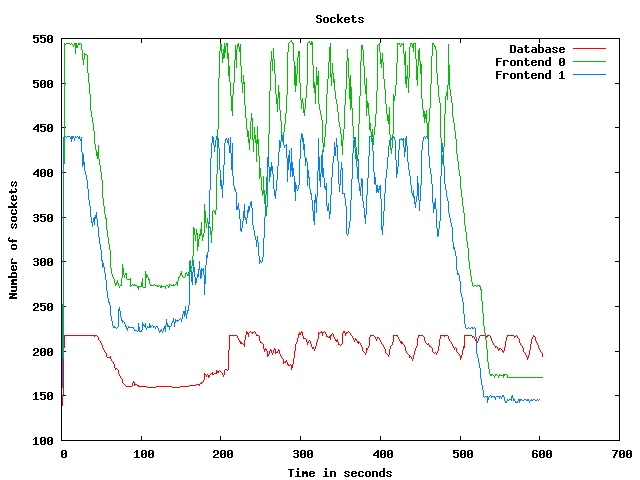
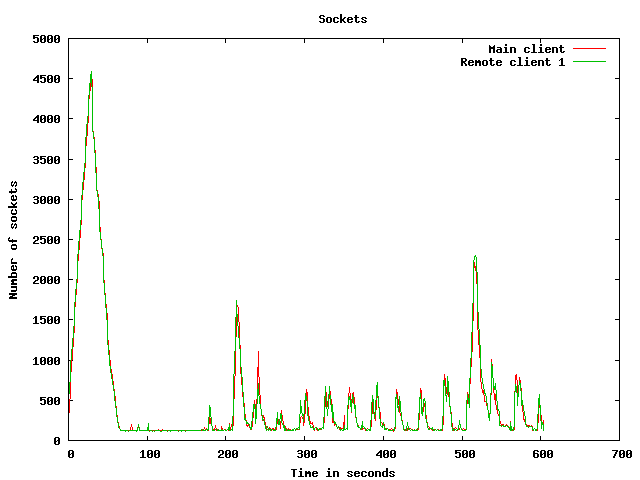
Network usage graphs
| Test start | 2009-3-19 7:35:29 |
| Up ramp start | 2009-3-19 7:36:1 |
| Runtime session start | 2009-3-19 7:38:1 |
| Down ramp start | 2009-3-19 7:45:31 |
| Test end | 2009-3-19 7:48:4 |
| Up ramp length | 2 minutes 1 millisecond (requested 120000 ms) |
| Runtime session length | 7 minutes 30 seconds 0 millisecond (requested 450000 ms) |
| Down ramp length | 30 seconds 0 millisecond (requested 30000 ms) |
| Total test length | 12 minutes 35 seconds 349 milliseconds |
| State name | % of total | Count | Errors | Minimum Time | Maximum Time | Average Time |
|---|---|---|---|---|---|---|
Home | 9 % | 6822 | 0 | 0 ms | 65101 ms | 6010 ms
|
Register | 1 % | 1003 | 0 | 0 ms | 45481 ms | 2205 ms
|
RegisterUser | 1 % | 939 | 33 | 4 ms | 45349 ms | 1824 ms
|
Browse | 9 % | 7081 | 0 | 0 ms | 59105 ms | 2346 ms
|
BrowseCategories | 6 % | 4739 | 0 | 3 ms | 56115 ms | 1812 ms
|
SearchItemsInCategory | 14 % | 11072 | 0 | 3 ms | 65092 ms | 1375 ms
|
BrowseRegions | 2 % | 1915 | 0 | 3 ms | 45558 ms | 1733 ms
|
BrowseCategoriesInRegion | 2 % | 1789 | 0 | 3 ms | 45636 ms | 1431 ms
|
SearchItemsInRegion | 4 % | 3637 | 0 | 0 ms | 45197 ms | 1445 ms
|
ViewItem | 12 % | 9377 | 0 | 3 ms | 45992 ms | 1264 ms
|
ViewUserInfo | 2 % | 1744 | 0 | 3 ms | 45390 ms | 1080 ms
|
ViewBidHistory | 1 % | 908 | 0 | 3 ms | 45912 ms | 1035 ms
|
BuyNowAuth | 1 % | 787 | 0 | 2 ms | 45927 ms | 1138 ms
|
BuyNow | 0 % | 700 | 93 | 4 ms | 45537 ms | 1211 ms
|
StoreBuyBow | 0 % | 540 | 0 | 4 ms | 45360 ms | 1229 ms
|
PutBidAuth | 4 % | 3171 | 0 | 0 ms | 59113 ms | 1170 ms
|
PutBid | 4 % | 3183 | 343 | 0 ms | 45479 ms | 981 ms
|
StoreBid | 2 % | 1891 | 1 | 4 ms | 45456 ms | 1135 ms
|
PutCommentAuth | 0 % | 0 | 0 | 0 ms | 0 ms | 0 ms
|
PutComment | 0 % | 251 | 19 | 4 ms | 45289 ms | 908 ms
|
StoreComment | 0 % | 201 | 0 | 4 ms | 45009 ms | 512 ms
|
Sell | 0 % | 568 | 0 | 0 ms | 59096 ms | 2583 ms
|
SelectCategoryToSellItem | 0 % | 529 | 0 | 4 ms | 45844 ms | 1768 ms
|
SellItemForm | 0 % | 485 | 0 | 2 ms | 45013 ms | 948 ms
|
RegisterItem | 0 % | 443 | 0 | 4 ms | 45384 ms | 2142 ms
|
AboutMe (auth form) | 2 % | 1513 | 0 | 0 ms | 65095 ms | 2149 ms
|
AboutMe | 2 % | 2221 | 0 | 4 ms | 45606 ms | 1731 ms
|
Back probability | 8 % | 6047 | 0 | 0 ms | 0 ms | 0 ms
|
End of Session | 1 % | 788 | 0 | 0 ms | 0 ms | 0 ms
|
Total | 100 % | 74344 | 489 | - | - | 1788 ms
|
Average throughput | 623 req/s
| |||||
Completed sessions | 709
| |||||
Total time | 42324 seconds
| |||||
Average session time | 59 seconds
| |||||
| State name | % of total | Count | Errors | Minimum Time | Maximum Time | Average Time |
|---|---|---|---|---|---|---|
Home | 4 % | 13268 | 0 | 0 ms | 21280 ms | 121 ms
|
Register | 1 % | 3263 | 0 | 0 ms | 21868 ms | 313 ms
|
RegisterUser | 1 % | 3217 | 128 | 5 ms | 21189 ms | 324 ms
|
Browse | 7 % | 22343 | 0 | 0 ms | 45230 ms | 279 ms
|
BrowseCategories | 4 % | 15600 | 0 | 3 ms | 45153 ms | 318 ms
|
SearchItemsInCategory | 15 % | 48890 | 0 | 3 ms | 45253 ms | 350 ms
|
BrowseRegions | 2 % | 6468 | 0 | 3 ms | 45152 ms | 328 ms
|
BrowseCategoriesInRegion | 2 % | 6358 | 0 | 3 ms | 23562 ms | 323 ms
|
SearchItemsInRegion | 5 % | 16553 | 0 | 0 ms | 45233 ms | 344 ms
|
ViewItem | 14 % | 44857 | 0 | 3 ms | 45310 ms | 326 ms
|
ViewUserInfo | 3 % | 10217 | 0 | 3 ms | 45143 ms | 332 ms
|
ViewBidHistory | 1 % | 5640 | 0 | 3 ms | 45284 ms | 591 ms
|
BuyNowAuth | 1 % | 4283 | 0 | 2 ms | 21292 ms | 300 ms
|
BuyNow | 1 % | 4216 | 562 | 4 ms | 45297 ms | 322 ms
|
StoreBuyBow | 1 % | 3587 | 1 | 4 ms | 24334 ms | 325 ms
|
PutBidAuth | 4 % | 15743 | 0 | 0 ms | 24386 ms | 316 ms
|
PutBid | 5 % | 18235 | 1897 | 4 ms | 24378 ms | 324 ms
|
StoreBid | 3 % | 12080 | 14 | 5 ms | 45188 ms | 332 ms
|
PutCommentAuth | 0 % | 0 | 0 | 0 ms | 0 ms | 0 ms
|
PutComment | 0 % | 1629 | 120 | 4 ms | 10540 ms | 271 ms
|
StoreComment | 0 % | 1490 | 0 | 5 ms | 21093 ms | 360 ms
|
Sell | 0 % | 1767 | 0 | 0 ms | 21283 ms | 315 ms
|
SelectCategoryToSellItem | 0 % | 1737 | 0 | 4 ms | 24387 ms | 308 ms
|
SellItemForm | 0 % | 1715 | 0 | 2 ms | 24360 ms | 334 ms
|
RegisterItem | 0 % | 1700 | 0 | 4 ms | 21076 ms | 288 ms
|
AboutMe (auth form) | 1 % | 5235 | 0 | 0 ms | 24324 ms | 301 ms
|
AboutMe | 2 % | 8875 | 0 | 4 ms | 21535 ms | 385 ms
|
Back probability | 10 % | 33299 | 0 | 0 ms | 0 ms | 0 ms
|
End of Session | 1 % | 4763 | 0 | 0 ms | 0 ms | 0 ms
|
Total | 100 % | 317028 | 2722 | - | - | 281 ms
|
Average throughput | 710 req/s
| |||||
Completed sessions | 4780
| |||||
Total time | 1204897 seconds
| |||||
Average session time | 252 seconds
| |||||
| State name | % of total | Count | Errors | Minimum Time | Maximum Time | Average Time |
|---|---|---|---|---|---|---|
Home | 3 % | 427 | 0 | 0 ms | 3456 ms | 66 ms
|
Register | 1 % | 116 | 0 | 0 ms | 3365 ms | 181 ms
|
RegisterUser | 1 % | 114 | 2 | 5 ms | 3430 ms | 241 ms
|
Browse | 7 % | 791 | 0 | 0 ms | 3883 ms | 92 ms
|
BrowseCategories | 5 % | 574 | 0 | 3 ms | 3874 ms | 146 ms
|
SearchItemsInCategory | 14 % | 1648 | 0 | 3 ms | 3918 ms | 141 ms
|
BrowseRegions | 2 % | 226 | 0 | 3 ms | 3467 ms | 107 ms
|
BrowseCategoriesInRegion | 2 % | 226 | 0 | 3 ms | 3957 ms | 134 ms
|
SearchItemsInRegion | 5 % | 594 | 0 | 0 ms | 3953 ms | 170 ms
|
ViewItem | 14 % | 1607 | 0 | 3 ms | 3958 ms | 126 ms
|
ViewUserInfo | 3 % | 346 | 0 | 3 ms | 3960 ms | 150 ms
|
ViewBidHistory | 1 % | 189 | 0 | 3 ms | 3566 ms | 194 ms
|
BuyNowAuth | 1 % | 172 | 0 | 2 ms | 3356 ms | 79 ms
|
BuyNow | 1 % | 149 | 16 | 4 ms | 3334 ms | 53 ms
|
StoreBuyBow | 1 % | 115 | 0 | 5 ms | 3502 ms | 175 ms
|
PutBidAuth | 5 % | 579 | 0 | 0 ms | 3473 ms | 147 ms
|
PutBid | 5 % | 630 | 64 | 3 ms | 3948 ms | 183 ms
|
StoreBid | 3 % | 420 | 0 | 4 ms | 3925 ms | 160 ms
|
PutCommentAuth | 0 % | 0 | 0 | 0 ms | 0 ms | 0 ms
|
PutComment | 0 % | 54 | 4 | 3 ms | 3901 ms | 232 ms
|
StoreComment | 0 % | 50 | 0 | 5 ms | 3455 ms | 163 ms
|
Sell | 0 % | 70 | 0 | 0 ms | 3417 ms | 113 ms
|
SelectCategoryToSellItem | 0 % | 65 | 0 | 4 ms | 3408 ms | 100 ms
|
SellItemForm | 0 % | 73 | 0 | 2 ms | 3412 ms | 65 ms
|
RegisterItem | 0 % | 64 | 0 | 5 ms | 3292 ms | 68 ms
|
AboutMe (auth form) | 1 % | 162 | 0 | 0 ms | 3417 ms | 127 ms
|
AboutMe | 2 % | 319 | 0 | 4 ms | 3659 ms | 260 ms
|
Back probability | 10 % | 1163 | 0 | 0 ms | 0 ms | 0 ms
|
End of Session | 1 % | 185 | 0 | 0 ms | 0 ms | 0 ms
|
Total | 100 % | 11128 | 86 | - | - | 122 ms
|
Average throughput | 373 req/s
| |||||
Completed sessions | 154
| |||||
Total time | 54022 seconds
| |||||
Average session time | 350 seconds
| |||||
| State name | % of total | Count | Errors | Minimum Time | Maximum Time | Average Time |
|---|---|---|---|---|---|---|
Home | 5 % | 20517 | 0 | 0 ms | 65101 ms | 2078 ms
|
Register | 1 % | 4382 | 0 | 0 ms | 45481 ms | 743 ms
|
RegisterUser | 1 % | 4270 | 163 | 4 ms | 45349 ms | 651 ms
|
Browse | 7 % | 30215 | 0 | 0 ms | 59105 ms | 759 ms
|
BrowseCategories | 5 % | 20913 | 0 | 3 ms | 56115 ms | 652 ms
|
SearchItemsInCategory | 15 % | 61853 | 0 | 3 ms | 65092 ms | 526 ms
|
BrowseRegions | 2 % | 8609 | 0 | 3 ms | 45558 ms | 635 ms
|
BrowseCategoriesInRegion | 2 % | 8373 | 0 | 3 ms | 45636 ms | 554 ms
|
SearchItemsInRegion | 5 % | 20848 | 0 | 0 ms | 45233 ms | 530 ms
|
ViewItem | 13 % | 55931 | 0 | 3 ms | 45992 ms | 477 ms
|
ViewUserInfo | 3 % | 12334 | 0 | 3 ms | 45390 ms | 432 ms
|
ViewBidHistory | 1 % | 6750 | 0 | 3 ms | 45912 ms | 639 ms
|
BuyNowAuth | 1 % | 5242 | 0 | 2 ms | 45927 ms | 418 ms
|
BuyNow | 1 % | 5065 | 671 | 4 ms | 45537 ms | 437 ms
|
StoreBuyBow | 1 % | 4242 | 1 | 4 ms | 45360 ms | 436 ms
|
PutBidAuth | 4 % | 19493 | 0 | 0 ms | 59113 ms | 450 ms
|
PutBid | 5 % | 22093 | 2304 | 0 ms | 45479 ms | 414 ms
|
StoreBid | 3 % | 14391 | 15 | 4 ms | 45456 ms | 432 ms
|
PutCommentAuth | 0 % | 0 | 0 | 0 ms | 0 ms | 0 ms
|
PutComment | 0 % | 1934 | 143 | 3 ms | 45289 ms | 352 ms
|
StoreComment | 0 % | 1741 | 0 | 4 ms | 45009 ms | 372 ms
|
Sell | 0 % | 2405 | 0 | 0 ms | 59096 ms | 845 ms
|
SelectCategoryToSellItem | 0 % | 2331 | 0 | 4 ms | 45844 ms | 634 ms
|
SellItemForm | 0 % | 2273 | 0 | 2 ms | 45013 ms | 456 ms
|
RegisterItem | 0 % | 2207 | 0 | 4 ms | 45384 ms | 654 ms
|
AboutMe (auth form) | 1 % | 6910 | 0 | 0 ms | 65095 ms | 702 ms
|
AboutMe | 2 % | 11475 | 0 | 4 ms | 45606 ms | 640 ms
|
Back probability | 10 % | 40509 | 0 | 0 ms | 0 ms | 0 ms
|
End of Session | 1 % | 5736 | 0 | 0 ms | 0 ms | 0 ms
|
Total | 100 % | 403042 | 3297 | - | - | 554 ms
|
Average throughput | 677 req/s
| |||||
Completed sessions | 5736
| |||||
Total time | 1335313 seconds
| |||||
Average session time | 232 seconds
| |||||
An error occured while waiting for remote processes termination (Skipping waits)
Command is: /usr/bin/scp farm6.csail.mit.edu:/tmp/client1 /home/drkp/sandbox/txcache/src/RUBiS-1.4.3/bench/2009-3-19@7:35:29//client1.bin
Command is: /usr/bin/ssh -x localhost /bin/bash -c 'LANG=en_GB.UTF-8 /usr/bin/sar -n DEV -n SOCK -rubcw 1 605 -f /home/drkp/sandbox/txcache/src/RUBiS-1.4.3/bench/2009-3-19@7:35:29//client1.bin > /home/drkp/sandbox/txcache/src/RUBiS-1.4.3/bench/2009-3-19@7:35:29//client1'
Command is: /usr/bin/scp farm14:/tmp/db_server0 /home/drkp/sandbox/txcache/src/RUBiS-1.4.3/bench/2009-3-19@7:35:29//db_server0.bin
Command is: /usr/bin/ssh -x localhost /bin/bash -c 'LANG=en_GB.UTF-8 /usr/bin/sar -n DEV -n SOCK -rubcw 1 605 -f /home/drkp/sandbox/txcache/src/RUBiS-1.4.3/bench/2009-3-19@7:35:29//db_server0.bin > /home/drkp/sandbox/txcache/src/RUBiS-1.4.3/bench/2009-3-19@7:35:29//db_server0'
Command is: /usr/bin/scp farm12.csail.mit.edu:/tmp/web_server0 /home/drkp/sandbox/txcache/src/RUBiS-1.4.3/bench/2009-3-19@7:35:29//web_server0.bin
Command is: /usr/bin/ssh -x localhost /bin/bash -c 'LANG=en_GB.UTF-8 /usr/bin/sar -n DEV -n SOCK -rubcw 1 605 -f /home/drkp/sandbox/txcache/src/RUBiS-1.4.3/bench/2009-3-19@7:35:29//web_server0.bin > /home/drkp/sandbox/txcache/src/RUBiS-1.4.3/bench/2009-3-19@7:35:29//web_server0'
Command is: /usr/bin/scp farm13.csail.mit.edu:/tmp/web_server1 /home/drkp/sandbox/txcache/src/RUBiS-1.4.3/bench/2009-3-19@7:35:29//web_server1.bin
Command is: /usr/bin/ssh -x localhost /bin/bash -c 'LANG=en_GB.UTF-8 /usr/bin/sar -n DEV -n SOCK -rubcw 1 605 -f /home/drkp/sandbox/txcache/src/RUBiS-1.4.3/bench/2009-3-19@7:35:29//web_server1.bin > /home/drkp/sandbox/txcache/src/RUBiS-1.4.3/bench/2009-3-19@7:35:29//web_server1'
Command is: /usr/bin/scp localhost:/tmp/client0 /home/drkp/sandbox/txcache/src/RUBiS-1.4.3/bench/2009-3-19@7:35:29//client0.bin
Command is: /usr/bin/ssh -x localhost /bin/bash -c 'LANG=en_GB.UTF-8 /usr/bin/sar -n DEV -n SOCK -rubcw 1 605 -f /home/drkp/sandbox/txcache/src/RUBiS-1.4.3/bench/2009-3-19@7:35:29//client0.bin > /home/drkp/sandbox/txcache/src/RUBiS-1.4.3/bench/2009-3-19@7:35:29//client0'
Command is: /usr/bin/scp farm6.csail.mit.edu:/tmp/trace_client1.html /home/drkp/sandbox/txcache/src/RUBiS-1.4.3/bench/2009-3-19@7:35:29//
Command is: /usr/bin/scp farm6.csail.mit.edu:/tmp/stat_client1.html /home/drkp/sandbox/txcache/src/RUBiS-1.4.3/bench/2009-3-19@7:35:29//
|
|
|
|
|
|
 | 
|
 | 
|
 | 
|
 | 
|
 | 
|
 | 
|
 | 
|
 | 
|
 | 
|