Node information
Test timing information
Up ramp statistics
Runtime session statistics
Down ramp statistics
Overall statistics
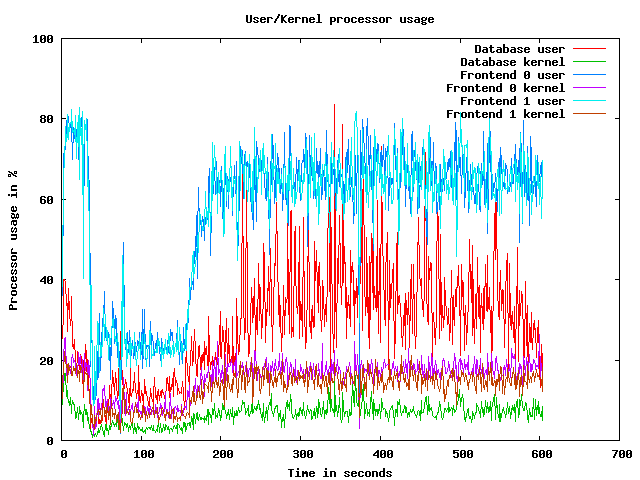
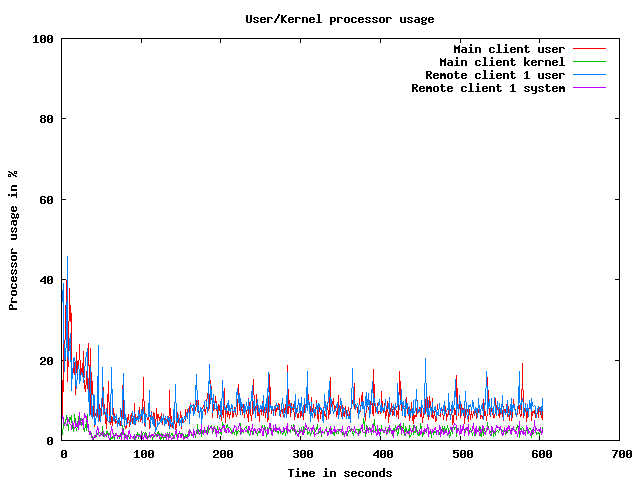
CPU usage graphs
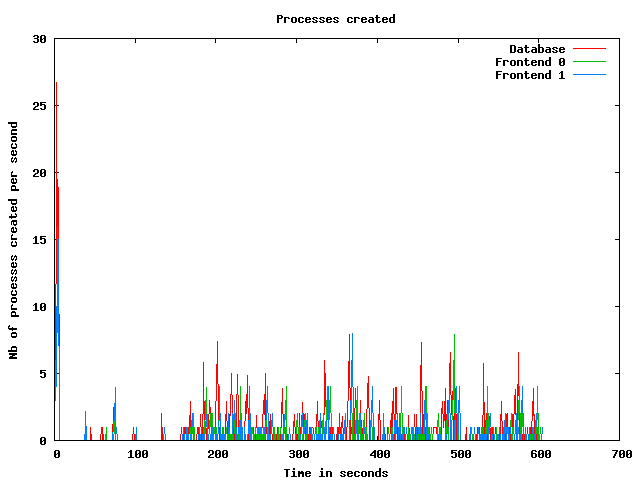
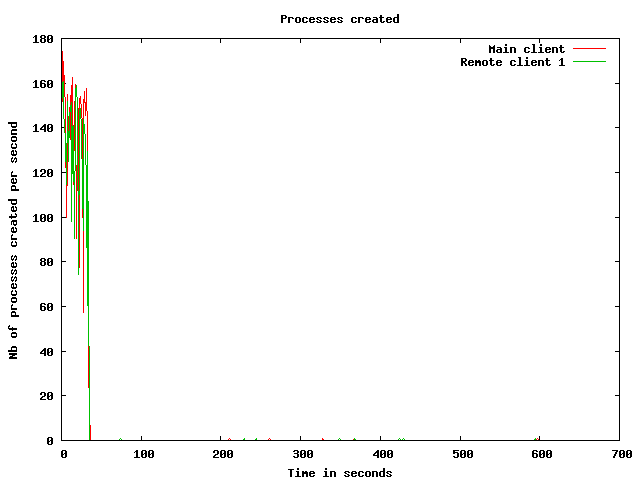
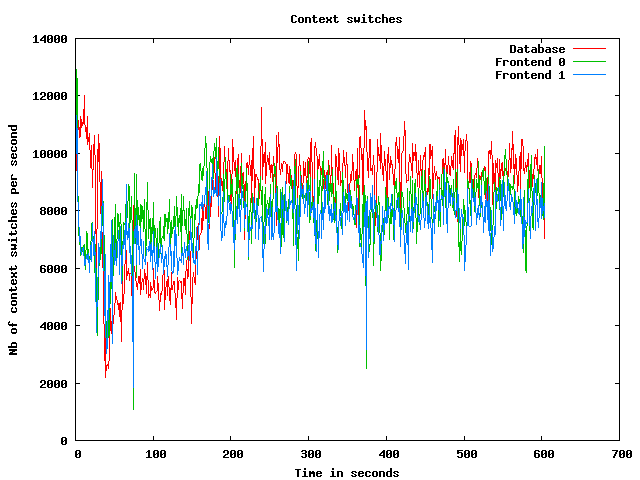
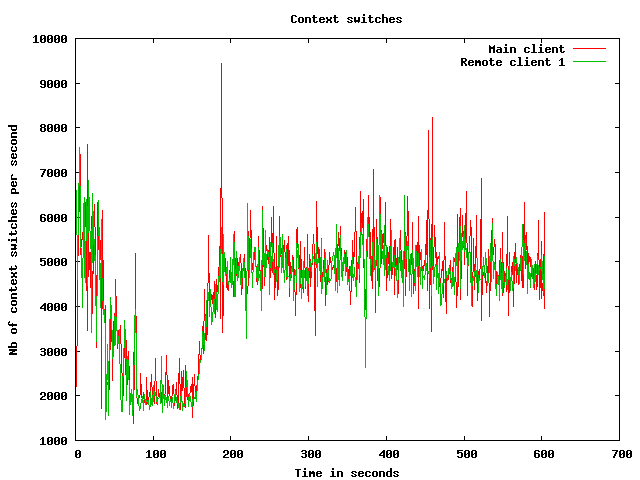
Processes usage graphs
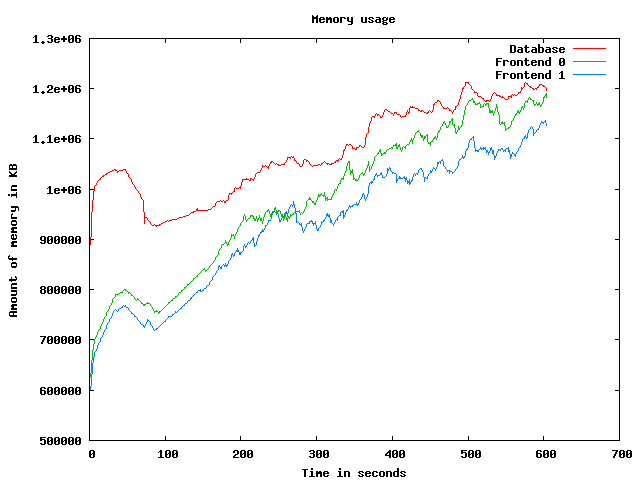
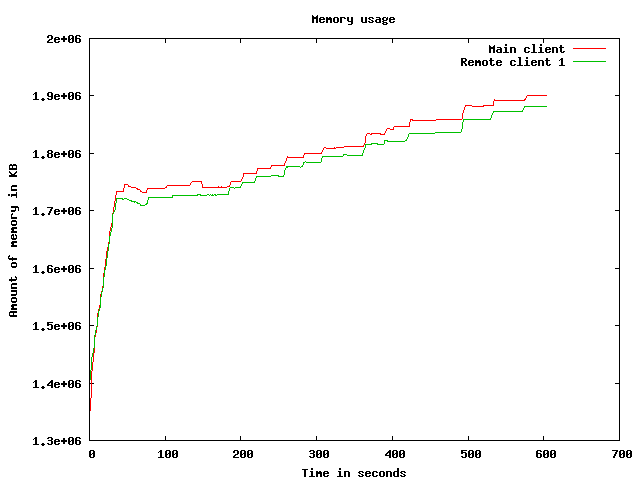
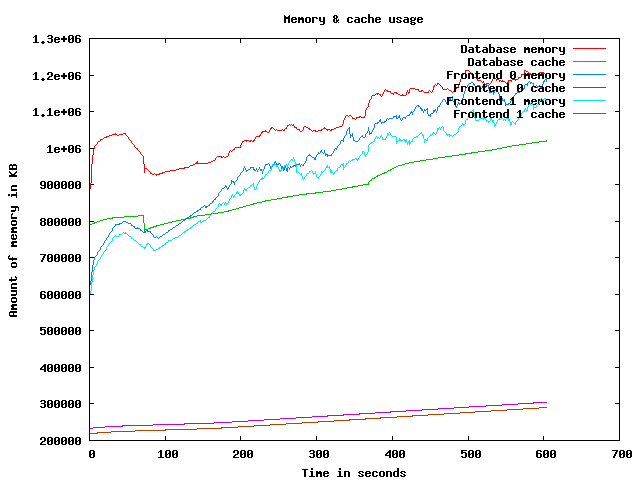
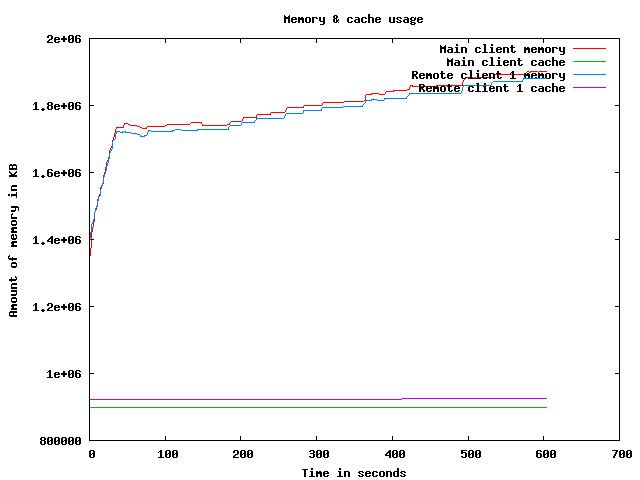
Memory usage graph
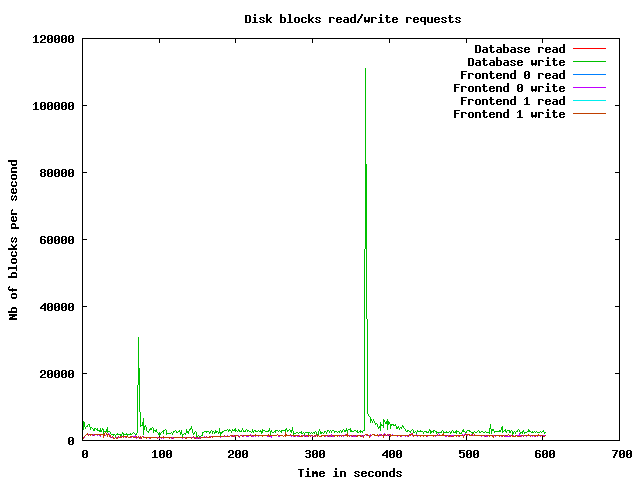
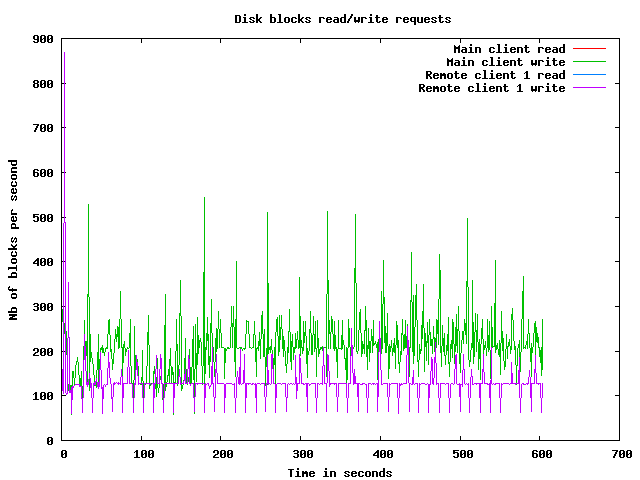
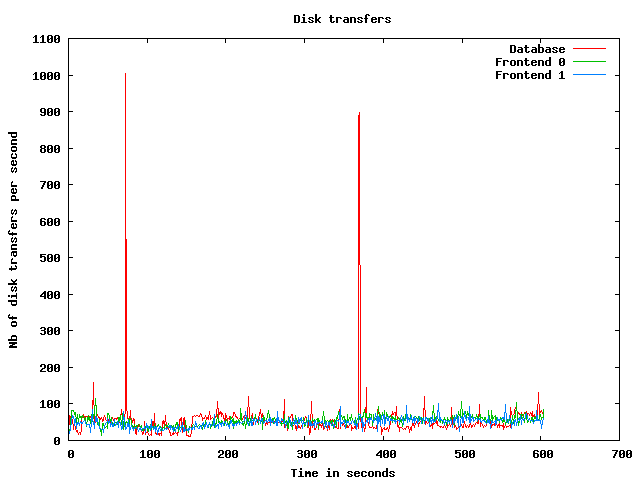
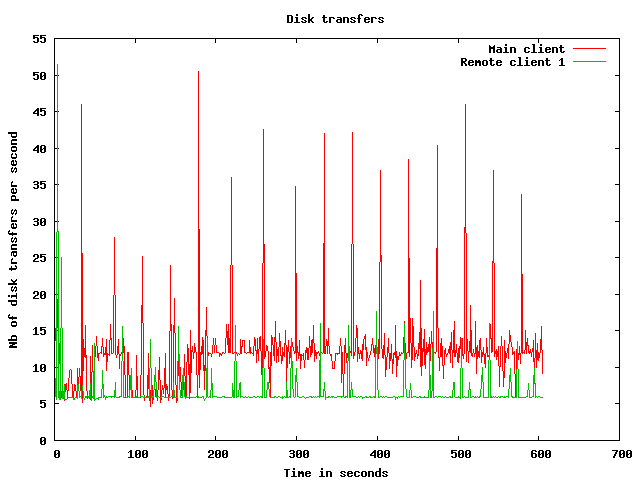
Disk usage graphs
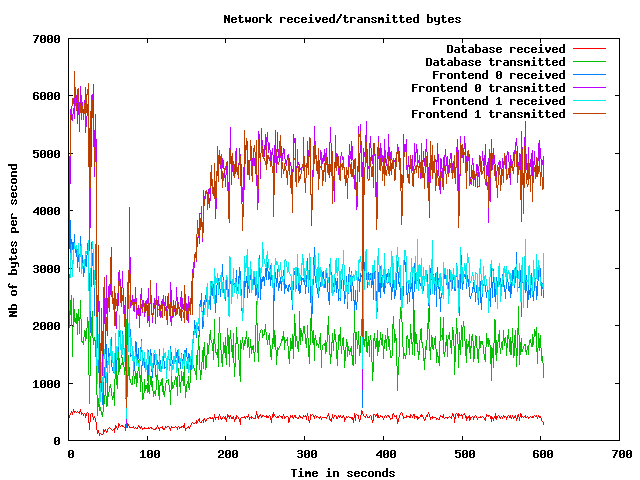
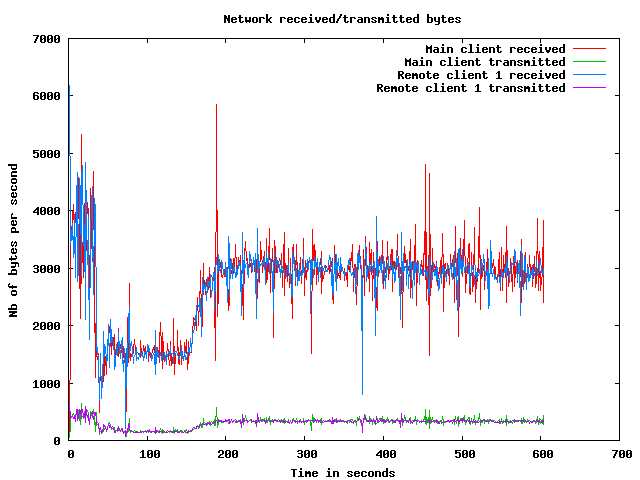
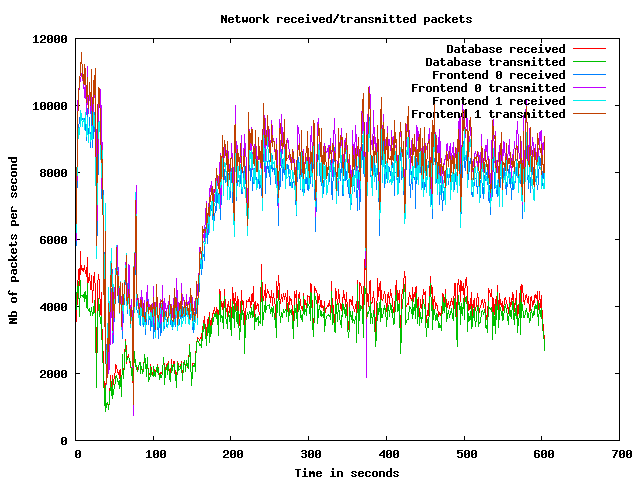
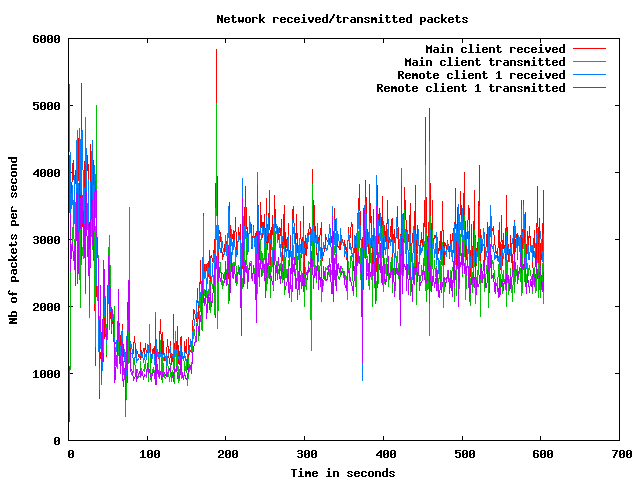
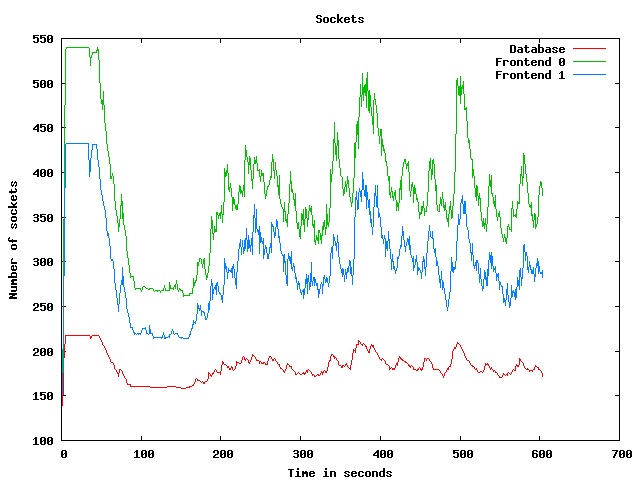
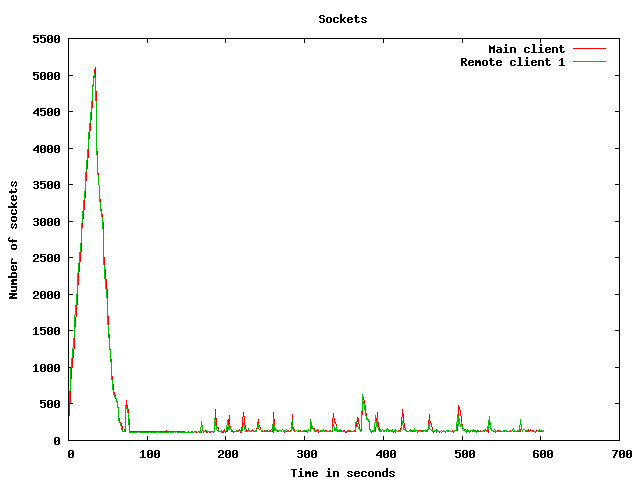
Network usage graphs
| Test start | 2009-3-19 12:58:50 |
| Up ramp start | 2009-3-19 12:59:27 |
| Runtime session start | 2009-3-19 13:1:27 |
| Down ramp start | 2009-3-19 13:8:57 |
| Test end | 2009-3-19 13:11:40 |
| Up ramp length | 2 minutes 0 millisecond (requested 120000 ms) |
| Runtime session length | 7 minutes 30 seconds 1 millisecond (requested 450000 ms) |
| Down ramp length | 30 seconds 0 millisecond (requested 30000 ms) |
| Total test length | 12 minutes 49 seconds 403 milliseconds |
| State name | % of total | Count | Errors | Minimum Time | Maximum Time | Average Time |
|---|---|---|---|---|---|---|
Home | 9 % | 8371 | 0 | 0 ms | 65429 ms | 4627 ms
|
Register | 1 % | 1224 | 0 | 0 ms | 45126 ms | 2123 ms
|
RegisterUser | 1 % | 1143 | 4 | 5 ms | 45494 ms | 1991 ms
|
Browse | 9 % | 8389 | 0 | 0 ms | 45726 ms | 2229 ms
|
BrowseCategories | 6 % | 5563 | 0 | 3 ms | 59113 ms | 1769 ms
|
SearchItemsInCategory | 14 % | 12994 | 0 | 0 ms | 65109 ms | 1475 ms
|
BrowseRegions | 2 % | 2353 | 0 | 3 ms | 45719 ms | 1820 ms
|
BrowseCategoriesInRegion | 2 % | 2200 | 0 | 3 ms | 45566 ms | 1733 ms
|
SearchItemsInRegion | 4 % | 4363 | 0 | 0 ms | 45158 ms | 1423 ms
|
ViewItem | 12 % | 11169 | 0 | 3 ms | 65104 ms | 1326 ms
|
ViewUserInfo | 2 % | 1921 | 0 | 3 ms | 45351 ms | 943 ms
|
ViewBidHistory | 1 % | 1076 | 0 | 3 ms | 45145 ms | 1343 ms
|
BuyNowAuth | 1 % | 955 | 0 | 2 ms | 45314 ms | 1317 ms
|
BuyNow | 0 % | 867 | 141 | 3 ms | 45021 ms | 1358 ms
|
StoreBuyBow | 0 % | 650 | 0 | 4 ms | 45054 ms | 1520 ms
|
PutBidAuth | 4 % | 3804 | 0 | 0 ms | 56108 ms | 1348 ms
|
PutBid | 4 % | 3763 | 526 | 1 ms | 57388 ms | 1088 ms
|
StoreBid | 2 % | 2187 | 1 | 4 ms | 45054 ms | 1122 ms
|
PutCommentAuth | 0 % | 0 | 0 | 0 ms | 0 ms | 0 ms
|
PutComment | 0 % | 319 | 35 | 3 ms | 45008 ms | 637 ms
|
StoreComment | 0 % | 250 | 0 | 4 ms | 45038 ms | 946 ms
|
Sell | 0 % | 616 | 0 | 0 ms | 45003 ms | 1684 ms
|
SelectCategoryToSellItem | 0 % | 574 | 0 | 3 ms | 59124 ms | 1916 ms
|
SellItemForm | 0 % | 527 | 0 | 2 ms | 45022 ms | 1396 ms
|
RegisterItem | 0 % | 484 | 0 | 4 ms | 56154 ms | 1885 ms
|
AboutMe (auth form) | 2 % | 1914 | 0 | 0 ms | 59141 ms | 1962 ms
|
AboutMe | 3 % | 2696 | 0 | 4 ms | 56120 ms | 1425 ms
|
Back probability | 7 % | 6860 | 0 | 0 ms | 0 ms | 0 ms
|
End of Session | 1 % | 958 | 0 | 0 ms | 0 ms | 0 ms
|
Total | 100 % | 88190 | 707 | - | - | 1694 ms
|
Average throughput | 740 req/s
| |||||
Completed sessions | 868
| |||||
Total time | 47231 seconds
| |||||
Average session time | 54 seconds
| |||||
| State name | % of total | Count | Errors | Minimum Time | Maximum Time | Average Time |
|---|---|---|---|---|---|---|
Home | 4 % | 16076 | 0 | 0 ms | 9478 ms | 16 ms
|
Register | 1 % | 3853 | 0 | 0 ms | 9763 ms | 28 ms
|
RegisterUser | 1 % | 3781 | 45 | 5 ms | 9055 ms | 64 ms
|
Browse | 7 % | 25952 | 0 | 0 ms | 9786 ms | 40 ms
|
BrowseCategories | 4 % | 18210 | 0 | 3 ms | 9776 ms | 56 ms
|
SearchItemsInCategory | 15 % | 57355 | 0 | 0 ms | 9844 ms | 57 ms
|
BrowseRegions | 2 % | 7418 | 0 | 3 ms | 9498 ms | 50 ms
|
BrowseCategoriesInRegion | 1 % | 7310 | 0 | 3 ms | 9953 ms | 58 ms
|
SearchItemsInRegion | 5 % | 18476 | 0 | 0 ms | 9852 ms | 67 ms
|
ViewItem | 14 % | 52172 | 4 | 3 ms | 9854 ms | 64 ms
|
ViewUserInfo | 3 % | 12073 | 0 | 3 ms | 9813 ms | 63 ms
|
ViewBidHistory | 1 % | 6199 | 0 | 3 ms | 9077 ms | 95 ms
|
BuyNowAuth | 1 % | 4952 | 0 | 2 ms | 9448 ms | 45 ms
|
BuyNow | 1 % | 4881 | 714 | 4 ms | 9794 ms | 72 ms
|
StoreBuyBow | 1 % | 4086 | 2 | 5 ms | 9615 ms | 61 ms
|
PutBidAuth | 4 % | 17975 | 0 | 0 ms | 9773 ms | 43 ms
|
PutBid | 5 % | 20555 | 2413 | 4 ms | 9508 ms | 67 ms
|
StoreBid | 3 % | 13506 | 11 | 4 ms | 9824 ms | 64 ms
|
PutCommentAuth | 0 % | 0 | 0 | 0 ms | 0 ms | 0 ms
|
PutComment | 0 % | 1838 | 157 | 4 ms | 9056 ms | 76 ms
|
StoreComment | 0 % | 1655 | 0 | 5 ms | 3871 ms | 58 ms
|
Sell | 0 % | 2071 | 0 | 0 ms | 3616 ms | 34 ms
|
SelectCategoryToSellItem | 0 % | 2049 | 0 | 3 ms | 3628 ms | 57 ms
|
SellItemForm | 0 % | 2020 | 0 | 2 ms | 4127 ms | 38 ms
|
RegisterItem | 0 % | 1991 | 0 | 4 ms | 9595 ms | 60 ms
|
AboutMe (auth form) | 1 % | 6172 | 0 | 0 ms | 9334 ms | 39 ms
|
AboutMe | 2 % | 10599 | 0 | 4 ms | 9767 ms | 107 ms
|
Back probability | 10 % | 38231 | 0 | 0 ms | 0 ms | 0 ms
|
End of Session | 1 % | 5339 | 0 | 0 ms | 0 ms | 0 ms
|
Total | 100 % | 366795 | 3346 | - | - | 50 ms
|
Average throughput | 822 req/s
| |||||
Completed sessions | 5329
| |||||
Total time | 1352393 seconds
| |||||
Average session time | 253 seconds
| |||||
| State name | % of total | Count | Errors | Minimum Time | Maximum Time | Average Time |
|---|---|---|---|---|---|---|
Home | 4 % | 513 | 0 | 0 ms | 14 ms | 0 ms
|
Register | 1 % | 133 | 0 | 0 ms | 28 ms | 1 ms
|
RegisterUser | 1 % | 132 | 1 | 5 ms | 43 ms | 12 ms
|
Browse | 7 % | 871 | 0 | 0 ms | 38 ms | 1 ms
|
BrowseCategories | 4 % | 592 | 0 | 3 ms | 57 ms | 7 ms
|
SearchItemsInCategory | 14 % | 1839 | 0 | 3 ms | 57 ms | 8 ms
|
BrowseRegions | 1 % | 246 | 0 | 3 ms | 53 ms | 8 ms
|
BrowseCategoriesInRegion | 1 % | 239 | 0 | 3 ms | 44 ms | 9 ms
|
SearchItemsInRegion | 5 % | 659 | 0 | 0 ms | 192 ms | 15 ms
|
ViewItem | 13 % | 1722 | 0 | 3 ms | 156 ms | 11 ms
|
ViewUserInfo | 3 % | 403 | 0 | 3 ms | 96 ms | 10 ms
|
ViewBidHistory | 1 % | 218 | 0 | 3 ms | 196 ms | 24 ms
|
BuyNowAuth | 1 % | 152 | 0 | 2 ms | 18 ms | 4 ms
|
BuyNow | 1 % | 160 | 26 | 4 ms | 55 ms | 13 ms
|
StoreBuyBow | 1 % | 139 | 0 | 5 ms | 45 ms | 10 ms
|
PutBidAuth | 5 % | 637 | 0 | 0 ms | 39 ms | 4 ms
|
PutBid | 5 % | 711 | 74 | 3 ms | 62 ms | 13 ms
|
StoreBid | 3 % | 453 | 0 | 4 ms | 60 ms | 12 ms
|
PutCommentAuth | 0 % | 0 | 0 | 0 ms | 0 ms | 0 ms
|
PutComment | 0 % | 65 | 2 | 4 ms | 48 ms | 11 ms
|
StoreComment | 0 % | 52 | 0 | 5 ms | 43 ms | 11 ms
|
Sell | 0 % | 78 | 0 | 0 ms | 13 ms | 1 ms
|
SelectCategoryToSellItem | 0 % | 67 | 0 | 4 ms | 43 ms | 10 ms
|
SellItemForm | 0 % | 68 | 0 | 2 ms | 38 ms | 5 ms
|
RegisterItem | 0 % | 71 | 0 | 4 ms | 40 ms | 10 ms
|
AboutMe (auth form) | 1 % | 229 | 0 | 0 ms | 10 ms | 1 ms
|
AboutMe | 2 % | 360 | 0 | 4 ms | 109 ms | 30 ms
|
Back probability | 10 % | 1327 | 0 | 0 ms | 0 ms | 0 ms
|
End of Session | 1 % | 174 | 0 | 0 ms | 0 ms | 0 ms
|
Total | 100 % | 12310 | 103 | - | - | 8 ms
|
Average throughput | 413 req/s
| |||||
Completed sessions | 184
| |||||
Total time | 62632 seconds
| |||||
Average session time | 340 seconds
| |||||
| State name | % of total | Count | Errors | Minimum Time | Maximum Time | Average Time |
|---|---|---|---|---|---|---|
Home | 5 % | 24960 | 0 | 0 ms | 65429 ms | 1562 ms
|
Register | 1 % | 5210 | 0 | 0 ms | 45126 ms | 520 ms
|
RegisterUser | 1 % | 5056 | 50 | 5 ms | 45494 ms | 498 ms
|
Browse | 7 % | 35212 | 0 | 0 ms | 45726 ms | 560 ms
|
BrowseCategories | 5 % | 24365 | 0 | 3 ms | 59113 ms | 446 ms
|
SearchItemsInCategory | 15 % | 72487 | 0 | 0 ms | 65109 ms | 310 ms
|
BrowseRegions | 2 % | 10017 | 0 | 3 ms | 45719 ms | 464 ms
|
BrowseCategoriesInRegion | 2 % | 9749 | 0 | 3 ms | 45566 ms | 434 ms
|
SearchItemsInRegion | 5 % | 23567 | 0 | 0 ms | 45158 ms | 316 ms
|
ViewItem | 13 % | 65184 | 4 | 3 ms | 65104 ms | 279 ms
|
ViewUserInfo | 3 % | 14428 | 0 | 3 ms | 45351 ms | 178 ms
|
ViewBidHistory | 1 % | 7517 | 0 | 3 ms | 45145 ms | 271 ms
|
BuyNowAuth | 1 % | 6059 | 0 | 2 ms | 45314 ms | 245 ms
|
BuyNow | 1 % | 5908 | 881 | 3 ms | 45021 ms | 260 ms
|
StoreBuyBow | 1 % | 4875 | 2 | 4 ms | 45054 ms | 254 ms
|
PutBidAuth | 4 % | 22417 | 0 | 0 ms | 56108 ms | 264 ms
|
PutBid | 5 % | 25076 | 3013 | 1 ms | 57388 ms | 218 ms
|
StoreBid | 3 % | 16146 | 12 | 4 ms | 45054 ms | 206 ms
|
PutCommentAuth | 0 % | 0 | 0 | 0 ms | 0 ms | 0 ms
|
PutComment | 0 % | 2222 | 194 | 3 ms | 45008 ms | 155 ms
|
StoreComment | 0 % | 1957 | 0 | 4 ms | 45038 ms | 171 ms
|
Sell | 0 % | 2765 | 0 | 0 ms | 45003 ms | 401 ms
|
SelectCategoryToSellItem | 0 % | 2690 | 0 | 3 ms | 59124 ms | 452 ms
|
SellItemForm | 0 % | 2615 | 0 | 2 ms | 45022 ms | 310 ms
|
RegisterItem | 0 % | 2546 | 0 | 4 ms | 56154 ms | 406 ms
|
AboutMe (auth form) | 1 % | 8315 | 0 | 0 ms | 59141 ms | 481 ms
|
AboutMe | 2 % | 13710 | 0 | 4 ms | 56120 ms | 364 ms
|
Back probability | 9 % | 46418 | 0 | 0 ms | 0 ms | 0 ms
|
End of Session | 1 % | 6471 | 0 | 0 ms | 0 ms | 0 ms
|
Total | 100 % | 467942 | 4156 | - | - | 358 ms
|
Average throughput | 786 req/s
| |||||
Completed sessions | 6470
| |||||
Total time | 1493946 seconds
| |||||
Average session time | 230 seconds
| |||||
An error occured while waiting for remote processes termination (Skipping waits)
Command is: /usr/bin/scp farm6.csail.mit.edu:/tmp/client1 /home/drkp/sandbox/txcache/src/RUBiS-1.4.3/bench/2009-3-19@12:58:50//client1.bin
Command is: /usr/bin/ssh -x localhost /bin/bash -c 'LANG=en_GB.UTF-8 /usr/bin/sar -n DEV -n SOCK -rubcw 1 605 -f /home/drkp/sandbox/txcache/src/RUBiS-1.4.3/bench/2009-3-19@12:58:50//client1.bin > /home/drkp/sandbox/txcache/src/RUBiS-1.4.3/bench/2009-3-19@12:58:50//client1'
Command is: /usr/bin/scp farm14:/tmp/db_server0 /home/drkp/sandbox/txcache/src/RUBiS-1.4.3/bench/2009-3-19@12:58:50//db_server0.bin
Command is: /usr/bin/ssh -x localhost /bin/bash -c 'LANG=en_GB.UTF-8 /usr/bin/sar -n DEV -n SOCK -rubcw 1 605 -f /home/drkp/sandbox/txcache/src/RUBiS-1.4.3/bench/2009-3-19@12:58:50//db_server0.bin > /home/drkp/sandbox/txcache/src/RUBiS-1.4.3/bench/2009-3-19@12:58:50//db_server0'
Command is: /usr/bin/scp farm12.csail.mit.edu:/tmp/web_server0 /home/drkp/sandbox/txcache/src/RUBiS-1.4.3/bench/2009-3-19@12:58:50//web_server0.bin
Command is: /usr/bin/ssh -x localhost /bin/bash -c 'LANG=en_GB.UTF-8 /usr/bin/sar -n DEV -n SOCK -rubcw 1 605 -f /home/drkp/sandbox/txcache/src/RUBiS-1.4.3/bench/2009-3-19@12:58:50//web_server0.bin > /home/drkp/sandbox/txcache/src/RUBiS-1.4.3/bench/2009-3-19@12:58:50//web_server0'
Command is: /usr/bin/scp farm13.csail.mit.edu:/tmp/web_server1 /home/drkp/sandbox/txcache/src/RUBiS-1.4.3/bench/2009-3-19@12:58:50//web_server1.bin
Command is: /usr/bin/ssh -x localhost /bin/bash -c 'LANG=en_GB.UTF-8 /usr/bin/sar -n DEV -n SOCK -rubcw 1 605 -f /home/drkp/sandbox/txcache/src/RUBiS-1.4.3/bench/2009-3-19@12:58:50//web_server1.bin > /home/drkp/sandbox/txcache/src/RUBiS-1.4.3/bench/2009-3-19@12:58:50//web_server1'
Command is: /usr/bin/scp localhost:/tmp/client0 /home/drkp/sandbox/txcache/src/RUBiS-1.4.3/bench/2009-3-19@12:58:50//client0.bin
Command is: /usr/bin/ssh -x localhost /bin/bash -c 'LANG=en_GB.UTF-8 /usr/bin/sar -n DEV -n SOCK -rubcw 1 605 -f /home/drkp/sandbox/txcache/src/RUBiS-1.4.3/bench/2009-3-19@12:58:50//client0.bin > /home/drkp/sandbox/txcache/src/RUBiS-1.4.3/bench/2009-3-19@12:58:50//client0'
Command is: /usr/bin/scp farm6.csail.mit.edu:/tmp/trace_client1.html /home/drkp/sandbox/txcache/src/RUBiS-1.4.3/bench/2009-3-19@12:58:50//
Command is: /usr/bin/scp farm6.csail.mit.edu:/tmp/stat_client1.html /home/drkp/sandbox/txcache/src/RUBiS-1.4.3/bench/2009-3-19@12:58:50//
|
|
|
|
|
|
 | 
|
 | 
|
 | 
|
 | 
|
 | 
|
 | 
|
 | 
|
 | 
|
 | 
|