Node information
Test timing information
Up ramp statistics
Runtime session statistics
Down ramp statistics
Overall statistics
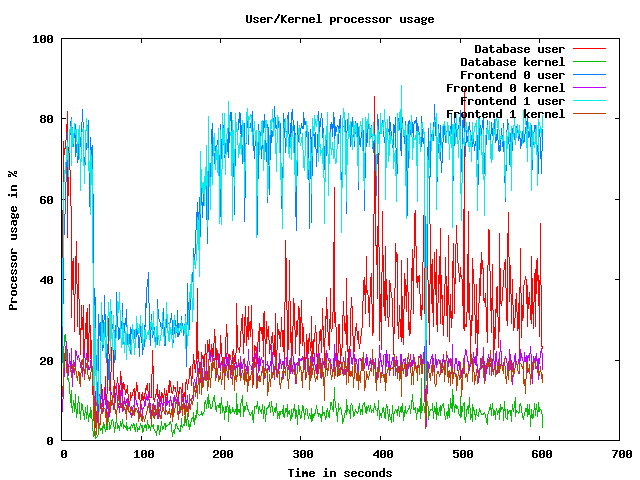
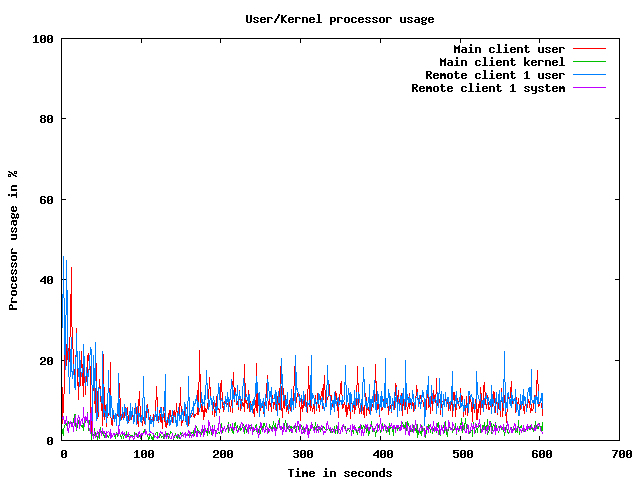
CPU usage graphs
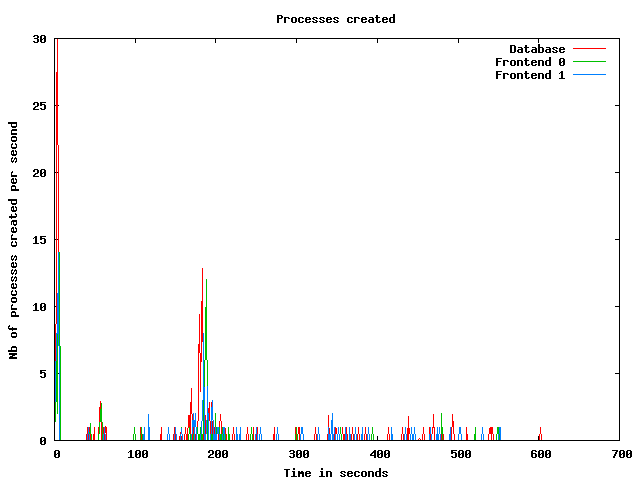
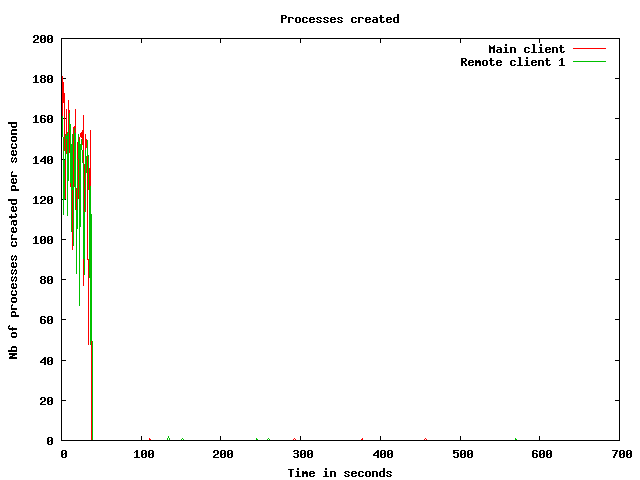
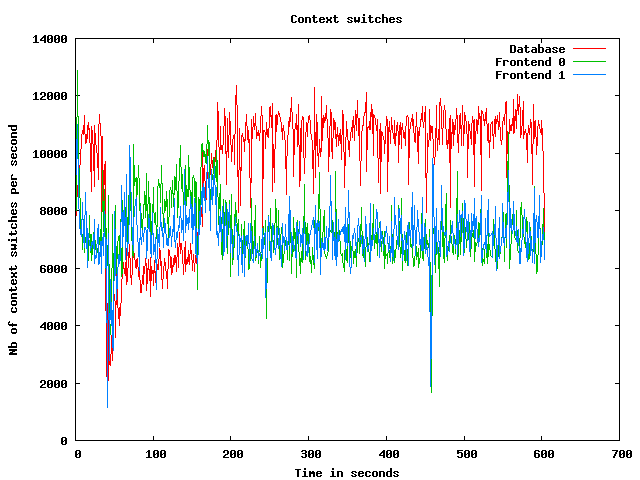
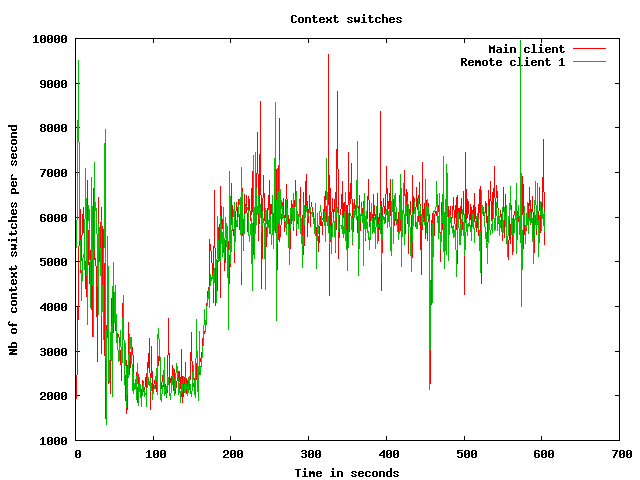
Processes usage graphs
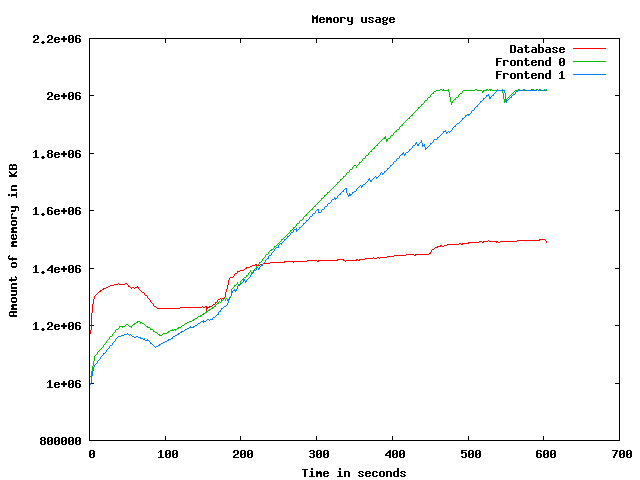
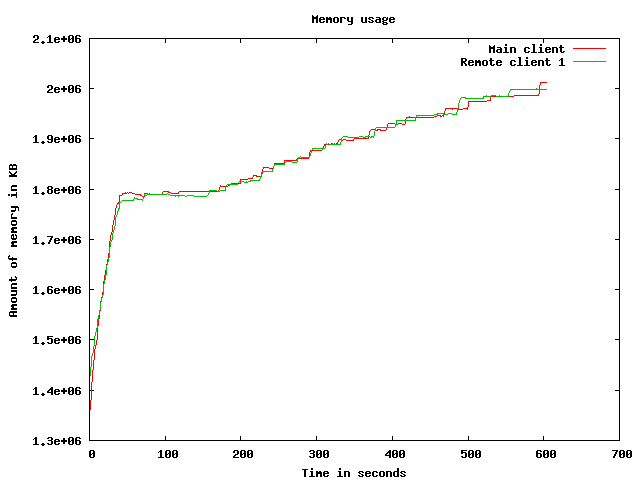
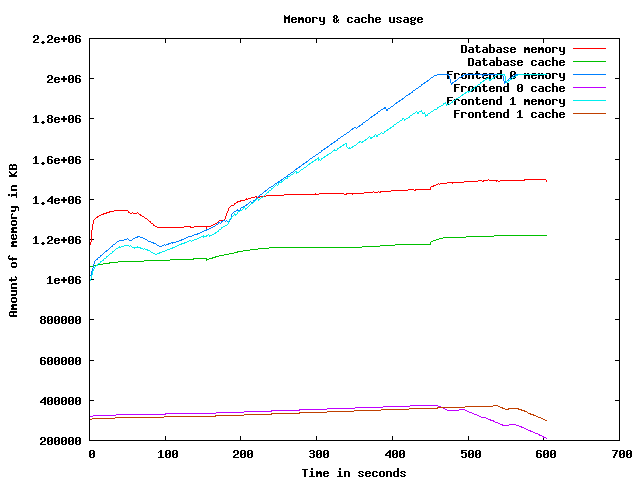
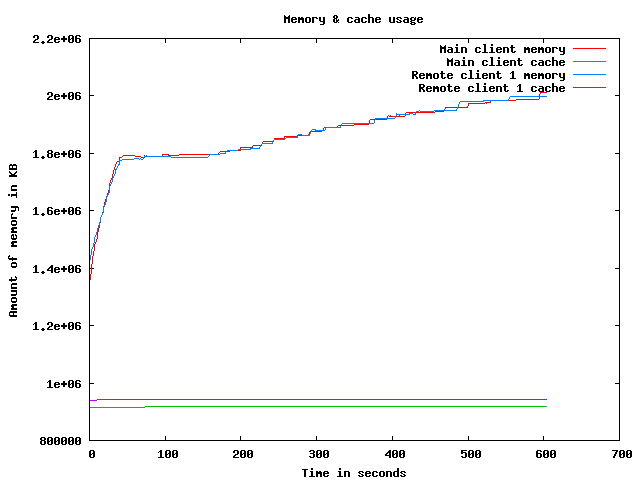
Memory usage graph
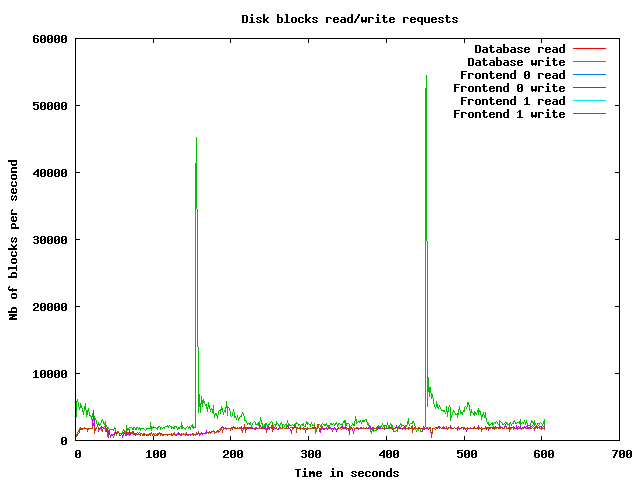
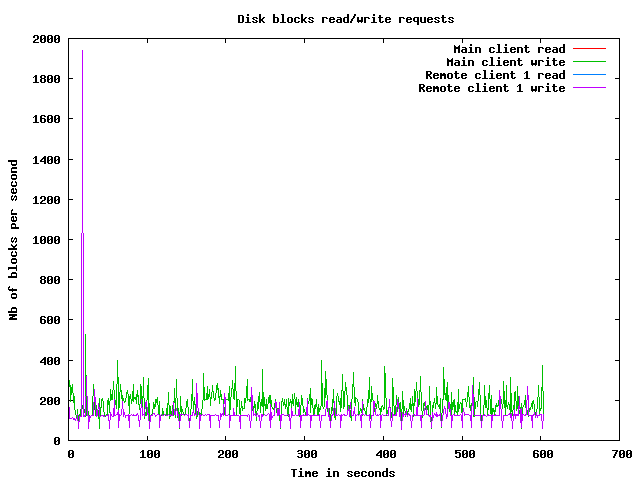
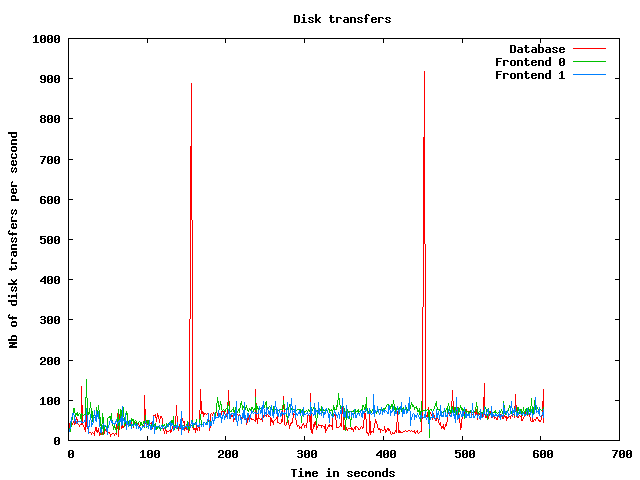
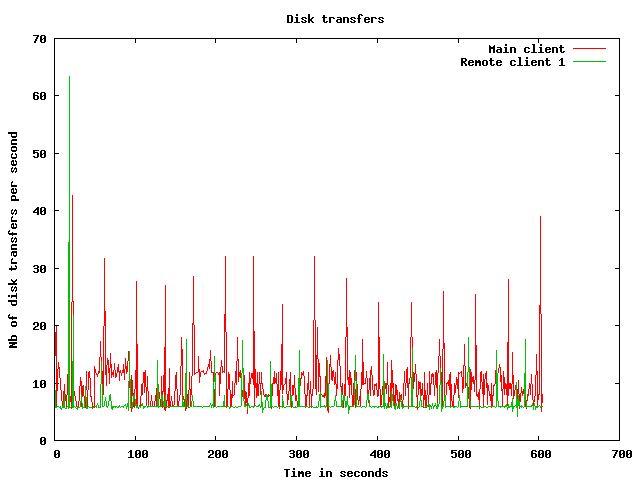
Disk usage graphs
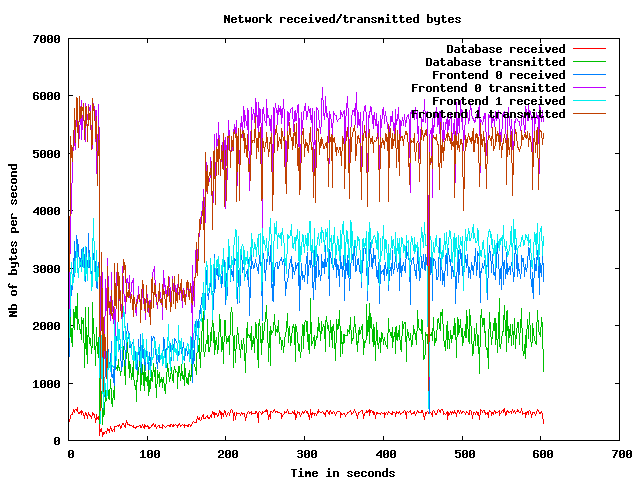
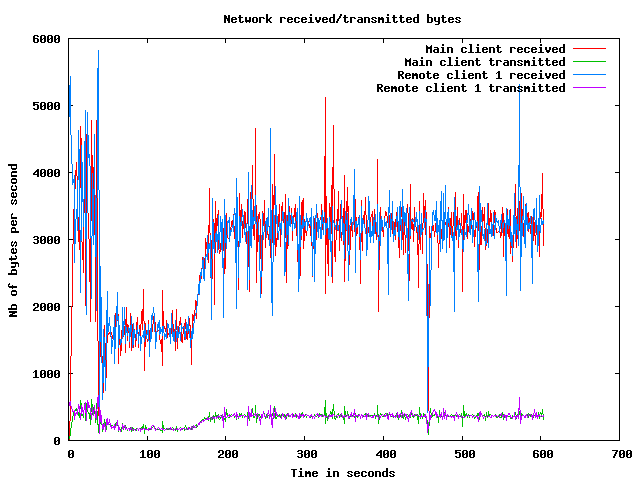
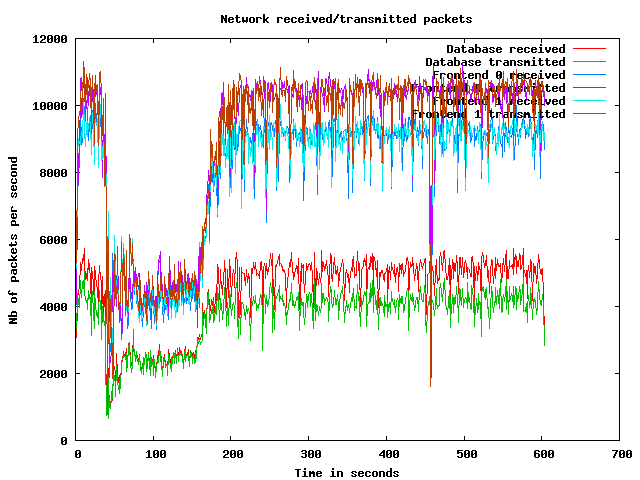
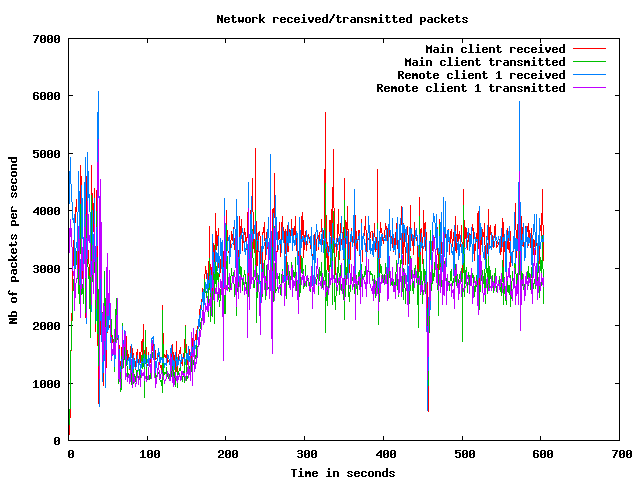
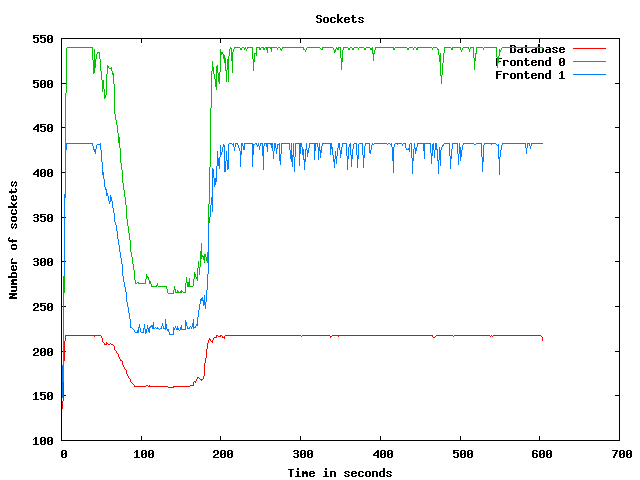
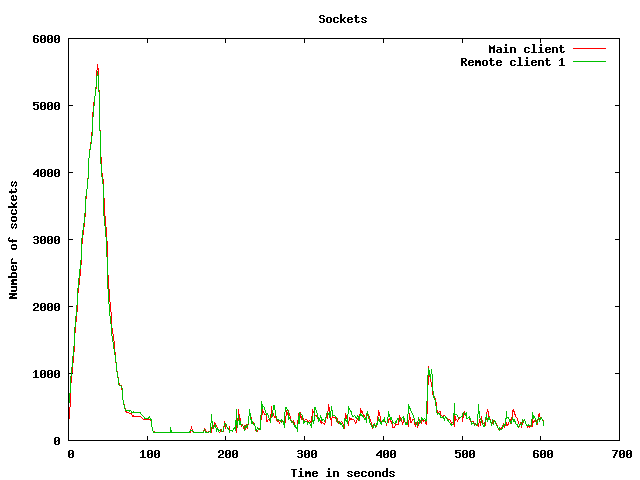
Network usage graphs
| Test start | 2009-3-19 13:12:27 |
| Up ramp start | 2009-3-19 13:13:6 |
| Runtime session start | 2009-3-19 13:15:6 |
| Down ramp start | 2009-3-19 13:22:36 |
| Test end | 2009-3-19 13:25:21 |
| Up ramp length | 2 minutes 1 millisecond (requested 120000 ms) |
| Runtime session length | 7 minutes 30 seconds 0 millisecond (requested 450000 ms) |
| Down ramp length | 30 seconds 0 millisecond (requested 30000 ms) |
| Total test length | 12 minutes 54 seconds 671 milliseconds |
| State name | % of total | Count | Errors | Minimum Time | Maximum Time | Average Time |
|---|---|---|---|---|---|---|
Home | 9 % | 8700 | 0 | 0 ms | 93061 ms | 6190 ms
|
Register | 1 % | 1222 | 0 | 0 ms | 92996 ms | 2125 ms
|
RegisterUser | 1 % | 1123 | 10 | 4 ms | 93039 ms | 2406 ms
|
Browse | 9 % | 8749 | 0 | 0 ms | 93039 ms | 2768 ms
|
BrowseCategories | 6 % | 5752 | 0 | 3 ms | 93019 ms | 1899 ms
|
SearchItemsInCategory | 14 % | 13377 | 0 | 3 ms | 93065 ms | 1732 ms
|
BrowseRegions | 2 % | 2475 | 0 | 3 ms | 93026 ms | 2295 ms
|
BrowseCategoriesInRegion | 2 % | 2331 | 0 | 3 ms | 93041 ms | 1829 ms
|
SearchItemsInRegion | 5 % | 4733 | 0 | 0 ms | 93045 ms | 1514 ms
|
ViewItem | 12 % | 11566 | 0 | 3 ms | 93063 ms | 1693 ms
|
ViewUserInfo | 2 % | 2076 | 0 | 3 ms | 93011 ms | 1362 ms
|
ViewBidHistory | 1 % | 1028 | 0 | 3 ms | 93035 ms | 1627 ms
|
BuyNowAuth | 1 % | 1018 | 0 | 2 ms | 45743 ms | 1457 ms
|
BuyNow | 1 % | 919 | 131 | 4 ms | 93015 ms | 1269 ms
|
StoreBuyBow | 0 % | 691 | 0 | 4 ms | 93028 ms | 1134 ms
|
PutBidAuth | 4 % | 3974 | 0 | 0 ms | 93013 ms | 1417 ms
|
PutBid | 4 % | 3865 | 530 | 1 ms | 93030 ms | 1269 ms
|
StoreBid | 2 % | 2268 | 0 | 4 ms | 93029 ms | 1546 ms
|
PutCommentAuth | 0 % | 0 | 0 | 0 ms | 0 ms | 0 ms
|
PutComment | 0 % | 361 | 31 | 3 ms | 45033 ms | 768 ms
|
StoreComment | 0 % | 292 | 0 | 5 ms | 93051 ms | 732 ms
|
Sell | 0 % | 672 | 0 | 0 ms | 93004 ms | 2181 ms
|
SelectCategoryToSellItem | 0 % | 624 | 0 | 4 ms | 93038 ms | 2906 ms
|
SellItemForm | 0 % | 577 | 0 | 2 ms | 93061 ms | 1896 ms
|
RegisterItem | 0 % | 540 | 0 | 4 ms | 45655 ms | 1673 ms
|
AboutMe (auth form) | 2 % | 1955 | 0 | 0 ms | 93046 ms | 2871 ms
|
AboutMe | 3 % | 2757 | 0 | 4 ms | 93063 ms | 1786 ms
|
Back probability | 7 % | 7249 | 0 | 0 ms | 0 ms | 0 ms
|
End of Session | 1 % | 943 | 0 | 0 ms | 0 ms | 0 ms
|
Total | 100 % | 91837 | 702 | - | - | 2080 ms
|
Average throughput | 771 req/s
| |||||
Completed sessions | 861
| |||||
Total time | 51137 seconds
| |||||
Average session time | 59 seconds
| |||||
| State name | % of total | Count | Errors | Minimum Time | Maximum Time | Average Time |
|---|---|---|---|---|---|---|
Home | 4 % | 16575 | 0 | 0 ms | 46455 ms | 80 ms
|
Register | 1 % | 4036 | 0 | 0 ms | 46709 ms | 175 ms
|
RegisterUser | 1 % | 3957 | 75 | 4 ms | 22139 ms | 206 ms
|
Browse | 7 % | 27735 | 0 | 0 ms | 93671 ms | 178 ms
|
BrowseCategories | 4 % | 19367 | 0 | 3 ms | 93098 ms | 240 ms
|
SearchItemsInCategory | 15 % | 61356 | 0 | 3 ms | 93330 ms | 232 ms
|
BrowseRegions | 2 % | 8074 | 0 | 3 ms | 21942 ms | 217 ms
|
BrowseCategoriesInRegion | 2 % | 7907 | 0 | 3 ms | 21859 ms | 224 ms
|
SearchItemsInRegion | 5 % | 20156 | 0 | 0 ms | 93381 ms | 244 ms
|
ViewItem | 14 % | 55667 | 1 | 3 ms | 93729 ms | 264 ms
|
ViewUserInfo | 3 % | 12752 | 0 | 3 ms | 46882 ms | 238 ms
|
ViewBidHistory | 1 % | 6754 | 0 | 3 ms | 22997 ms | 461 ms
|
BuyNowAuth | 1 % | 5296 | 0 | 2 ms | 46274 ms | 211 ms
|
BuyNow | 1 % | 5216 | 770 | 4 ms | 46232 ms | 293 ms
|
StoreBuyBow | 1 % | 4409 | 3 | 4 ms | 93191 ms | 249 ms
|
PutBidAuth | 4 % | 19473 | 0 | 0 ms | 93731 ms | 223 ms
|
PutBid | 5 % | 22592 | 2525 | 3 ms | 93191 ms | 265 ms
|
StoreBid | 3 % | 14831 | 13 | 4 ms | 93724 ms | 257 ms
|
PutCommentAuth | 0 % | 0 | 0 | 0 ms | 0 ms | 0 ms
|
PutComment | 0 % | 1876 | 139 | 4 ms | 46053 ms | 271 ms
|
StoreComment | 0 % | 1717 | 0 | 5 ms | 21909 ms | 193 ms
|
Sell | 0 % | 2151 | 0 | 0 ms | 93304 ms | 210 ms
|
SelectCategoryToSellItem | 0 % | 2124 | 0 | 4 ms | 10221 ms | 223 ms
|
SellItemForm | 0 % | 2109 | 0 | 2 ms | 21790 ms | 196 ms
|
RegisterItem | 0 % | 2064 | 0 | 5 ms | 45823 ms | 217 ms
|
AboutMe (auth form) | 1 % | 6448 | 0 | 0 ms | 21944 ms | 173 ms
|
AboutMe | 2 % | 10954 | 0 | 4 ms | 46077 ms | 364 ms
|
Back probability | 10 % | 41313 | 0 | 0 ms | 0 ms | 0 ms
|
End of Session | 1 % | 5665 | 0 | 0 ms | 0 ms | 0 ms
|
Total | 100 % | 392574 | 3526 | - | - | 206 ms
|
Average throughput | 880 req/s
| |||||
Completed sessions | 5678
| |||||
Total time | 1466783 seconds
| |||||
Average session time | 258 seconds
| |||||
| State name | % of total | Count | Errors | Minimum Time | Maximum Time | Average Time |
|---|---|---|---|---|---|---|
Home | 4 % | 541 | 0 | 0 ms | 21035 ms | 46 ms
|
Register | 0 % | 132 | 0 | 0 ms | 764 ms | 8 ms
|
RegisterUser | 1 % | 138 | 2 | 5 ms | 615 ms | 21 ms
|
Browse | 6 % | 942 | 0 | 0 ms | 20995 ms | 46 ms
|
BrowseCategories | 4 % | 636 | 0 | 3 ms | 21035 ms | 171 ms
|
SearchItemsInCategory | 16 % | 2172 | 0 | 3 ms | 21045 ms | 51 ms
|
BrowseRegions | 1 % | 268 | 0 | 3 ms | 21020 ms | 100 ms
|
BrowseCategoriesInRegion | 1 % | 262 | 0 | 3 ms | 21044 ms | 286 ms
|
SearchItemsInRegion | 4 % | 672 | 0 | 0 ms | 1018 ms | 38 ms
|
ViewItem | 14 % | 1914 | 0 | 3 ms | 21055 ms | 79 ms
|
ViewUserInfo | 3 % | 431 | 0 | 3 ms | 3712 ms | 39 ms
|
ViewBidHistory | 1 % | 208 | 0 | 3 ms | 2582 ms | 136 ms
|
BuyNowAuth | 1 % | 182 | 0 | 2 ms | 21037 ms | 359 ms
|
BuyNow | 1 % | 167 | 23 | 4 ms | 21038 ms | 167 ms
|
StoreBuyBow | 1 % | 137 | 0 | 5 ms | 935 ms | 20 ms
|
PutBidAuth | 5 % | 752 | 0 | 0 ms | 21043 ms | 120 ms
|
PutBid | 5 % | 808 | 92 | 3 ms | 21051 ms | 62 ms
|
StoreBid | 3 % | 527 | 0 | 4 ms | 21068 ms | 104 ms
|
PutCommentAuth | 0 % | 0 | 0 | 0 ms | 0 ms | 0 ms
|
PutComment | 0 % | 67 | 6 | 4 ms | 934 ms | 58 ms
|
StoreComment | 0 % | 70 | 0 | 5 ms | 836 ms | 29 ms
|
Sell | 0 % | 75 | 0 | 0 ms | 901 ms | 27 ms
|
SelectCategoryToSellItem | 0 % | 72 | 0 | 3 ms | 153 ms | 21 ms
|
SellItemForm | 0 % | 62 | 0 | 2 ms | 40 ms | 7 ms
|
RegisterItem | 0 % | 71 | 0 | 4 ms | 201 ms | 19 ms
|
AboutMe (auth form) | 1 % | 202 | 0 | 0 ms | 732 ms | 7 ms
|
AboutMe | 2 % | 377 | 0 | 4 ms | 3885 ms | 92 ms
|
Back probability | 10 % | 1424 | 0 | 0 ms | 0 ms | 0 ms
|
End of Session | 1 % | 190 | 0 | 0 ms | 0 ms | 0 ms
|
Total | 100 % | 13499 | 123 | - | - | 70 ms
|
Average throughput | 454 req/s
| |||||
Completed sessions | 168
| |||||
Total time | 58514 seconds
| |||||
Average session time | 348 seconds
| |||||
| State name | % of total | Count | Errors | Minimum Time | Maximum Time | Average Time |
|---|---|---|---|---|---|---|
Home | 5 % | 25816 | 0 | 0 ms | 93061 ms | 2139 ms
|
Register | 1 % | 5390 | 0 | 0 ms | 92996 ms | 613 ms
|
RegisterUser | 1 % | 5218 | 87 | 4 ms | 93039 ms | 675 ms
|
Browse | 7 % | 37426 | 0 | 0 ms | 93671 ms | 780 ms
|
BrowseCategories | 5 % | 25755 | 0 | 3 ms | 93098 ms | 608 ms
|
SearchItemsInCategory | 15 % | 77217 | 0 | 3 ms | 93330 ms | 486 ms
|
BrowseRegions | 2 % | 10817 | 0 | 3 ms | 93026 ms | 689 ms
|
BrowseCategoriesInRegion | 2 % | 10500 | 0 | 3 ms | 93041 ms | 582 ms
|
SearchItemsInRegion | 5 % | 25626 | 0 | 0 ms | 93381 ms | 473 ms
|
ViewItem | 13 % | 69280 | 1 | 3 ms | 93729 ms | 497 ms
|
ViewUserInfo | 3 % | 15297 | 0 | 3 ms | 93011 ms | 385 ms
|
ViewBidHistory | 1 % | 8006 | 0 | 3 ms | 93035 ms | 601 ms
|
BuyNowAuth | 1 % | 6496 | 0 | 2 ms | 46274 ms | 410 ms
|
BuyNow | 1 % | 6302 | 924 | 4 ms | 93015 ms | 432 ms
|
StoreBuyBow | 1 % | 5237 | 3 | 4 ms | 93191 ms | 360 ms
|
PutBidAuth | 4 % | 24200 | 0 | 0 ms | 93731 ms | 416 ms
|
PutBid | 5 % | 27316 | 3147 | 1 ms | 93191 ms | 401 ms
|
StoreBid | 3 % | 17626 | 13 | 4 ms | 93724 ms | 419 ms
|
PutCommentAuth | 0 % | 0 | 0 | 0 ms | 0 ms | 0 ms
|
PutComment | 0 % | 2304 | 176 | 3 ms | 46053 ms | 342 ms
|
StoreComment | 0 % | 2079 | 0 | 5 ms | 93051 ms | 263 ms
|
Sell | 0 % | 2898 | 0 | 0 ms | 93304 ms | 662 ms
|
SelectCategoryToSellItem | 0 % | 2820 | 0 | 3 ms | 93038 ms | 811 ms
|
SellItemForm | 0 % | 2748 | 0 | 2 ms | 93061 ms | 548 ms
|
RegisterItem | 0 % | 2675 | 0 | 4 ms | 45823 ms | 505 ms
|
AboutMe (auth form) | 1 % | 8605 | 0 | 0 ms | 93046 ms | 782 ms
|
AboutMe | 2 % | 14153 | 0 | 4 ms | 93063 ms | 632 ms
|
Back probability | 10 % | 49986 | 0 | 0 ms | 0 ms | 0 ms
|
End of Session | 1 % | 6798 | 0 | 0 ms | 0 ms | 0 ms
|
Total | 100 % | 498591 | 4351 | - | - | 547 ms
|
Average throughput | 838 req/s
| |||||
Completed sessions | 6797
| |||||
Total time | 1608174 seconds
| |||||
Average session time | 236 seconds
| |||||
An error occured while waiting for remote processes termination (Skipping waits)
Command is: /usr/bin/scp farm6.csail.mit.edu:/tmp/client1 /home/drkp/sandbox/txcache/src/RUBiS-1.4.3/bench/2009-3-19@13:12:26//client1.bin
Command is: /usr/bin/ssh -x localhost /bin/bash -c 'LANG=en_GB.UTF-8 /usr/bin/sar -n DEV -n SOCK -rubcw 1 605 -f /home/drkp/sandbox/txcache/src/RUBiS-1.4.3/bench/2009-3-19@13:12:26//client1.bin > /home/drkp/sandbox/txcache/src/RUBiS-1.4.3/bench/2009-3-19@13:12:26//client1'
Command is: /usr/bin/scp farm14:/tmp/db_server0 /home/drkp/sandbox/txcache/src/RUBiS-1.4.3/bench/2009-3-19@13:12:26//db_server0.bin
Command is: /usr/bin/ssh -x localhost /bin/bash -c 'LANG=en_GB.UTF-8 /usr/bin/sar -n DEV -n SOCK -rubcw 1 605 -f /home/drkp/sandbox/txcache/src/RUBiS-1.4.3/bench/2009-3-19@13:12:26//db_server0.bin > /home/drkp/sandbox/txcache/src/RUBiS-1.4.3/bench/2009-3-19@13:12:26//db_server0'
Command is: /usr/bin/scp farm12.csail.mit.edu:/tmp/web_server0 /home/drkp/sandbox/txcache/src/RUBiS-1.4.3/bench/2009-3-19@13:12:26//web_server0.bin
Command is: /usr/bin/ssh -x localhost /bin/bash -c 'LANG=en_GB.UTF-8 /usr/bin/sar -n DEV -n SOCK -rubcw 1 605 -f /home/drkp/sandbox/txcache/src/RUBiS-1.4.3/bench/2009-3-19@13:12:26//web_server0.bin > /home/drkp/sandbox/txcache/src/RUBiS-1.4.3/bench/2009-3-19@13:12:26//web_server0'
Command is: /usr/bin/scp farm13.csail.mit.edu:/tmp/web_server1 /home/drkp/sandbox/txcache/src/RUBiS-1.4.3/bench/2009-3-19@13:12:26//web_server1.bin
Command is: /usr/bin/ssh -x localhost /bin/bash -c 'LANG=en_GB.UTF-8 /usr/bin/sar -n DEV -n SOCK -rubcw 1 605 -f /home/drkp/sandbox/txcache/src/RUBiS-1.4.3/bench/2009-3-19@13:12:26//web_server1.bin > /home/drkp/sandbox/txcache/src/RUBiS-1.4.3/bench/2009-3-19@13:12:26//web_server1'
Command is: /usr/bin/scp localhost:/tmp/client0 /home/drkp/sandbox/txcache/src/RUBiS-1.4.3/bench/2009-3-19@13:12:26//client0.bin
Command is: /usr/bin/ssh -x localhost /bin/bash -c 'LANG=en_GB.UTF-8 /usr/bin/sar -n DEV -n SOCK -rubcw 1 605 -f /home/drkp/sandbox/txcache/src/RUBiS-1.4.3/bench/2009-3-19@13:12:26//client0.bin > /home/drkp/sandbox/txcache/src/RUBiS-1.4.3/bench/2009-3-19@13:12:26//client0'
Command is: /usr/bin/scp farm6.csail.mit.edu:/tmp/trace_client1.html /home/drkp/sandbox/txcache/src/RUBiS-1.4.3/bench/2009-3-19@13:12:26//
Command is: /usr/bin/scp farm6.csail.mit.edu:/tmp/stat_client1.html /home/drkp/sandbox/txcache/src/RUBiS-1.4.3/bench/2009-3-19@13:12:26//
|
|
|
|
|
|
 | 
|
 | 
|
 | 
|
 | 
|
 | 
|
 | 
|
 | 
|
 | 
|
 | 
|