Node information
Test timing information
Up ramp statistics
Runtime session statistics
Down ramp statistics
Overall statistics
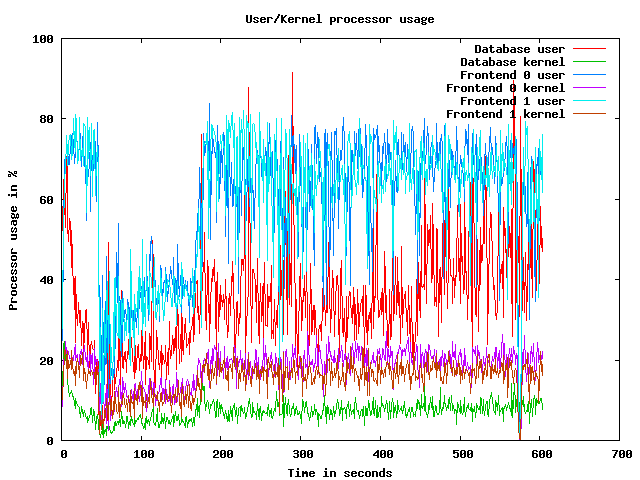
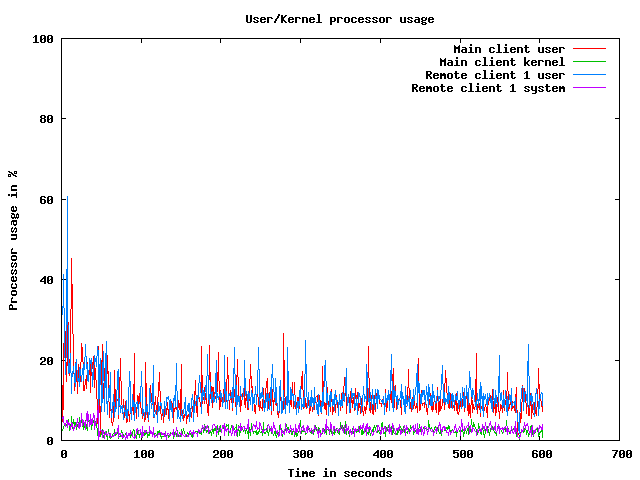
CPU usage graphs
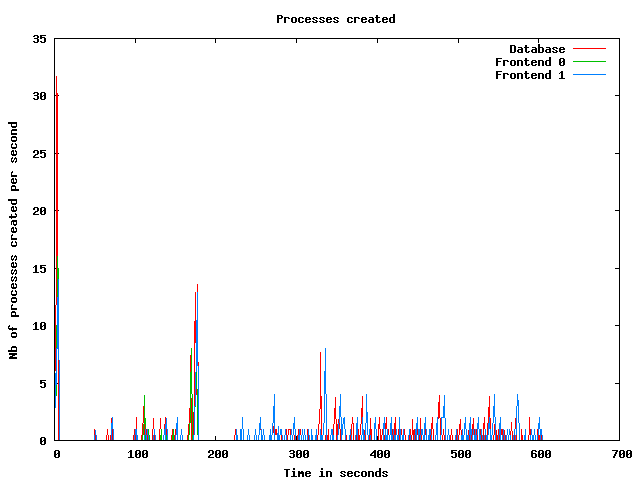
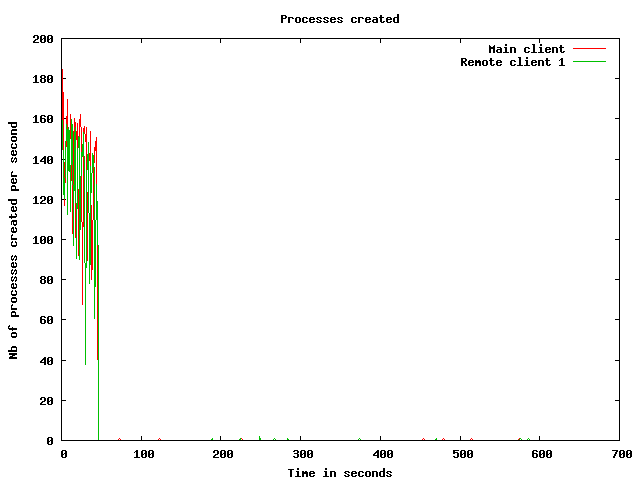
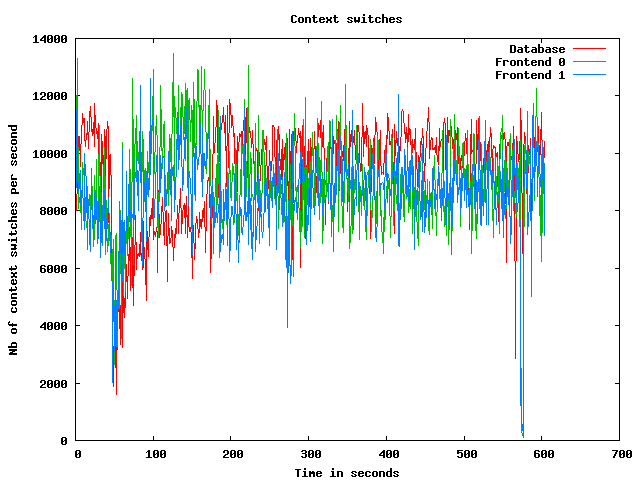
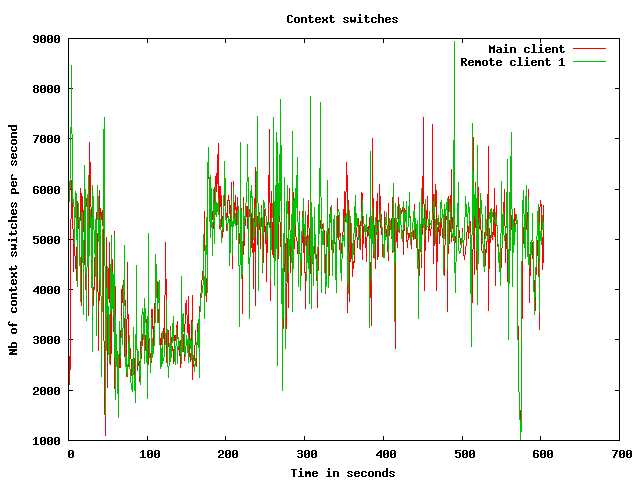
Processes usage graphs
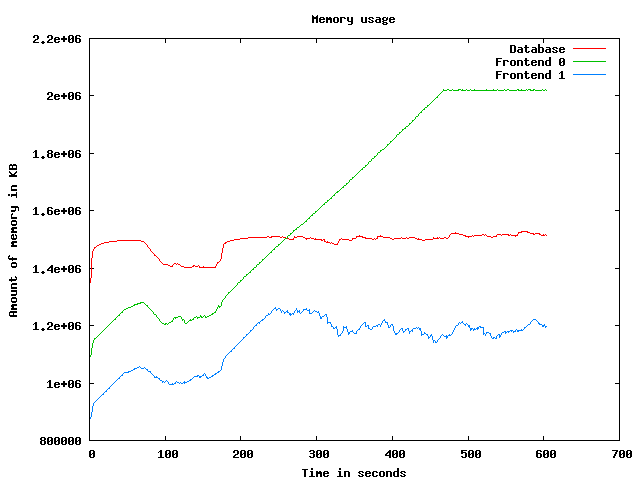
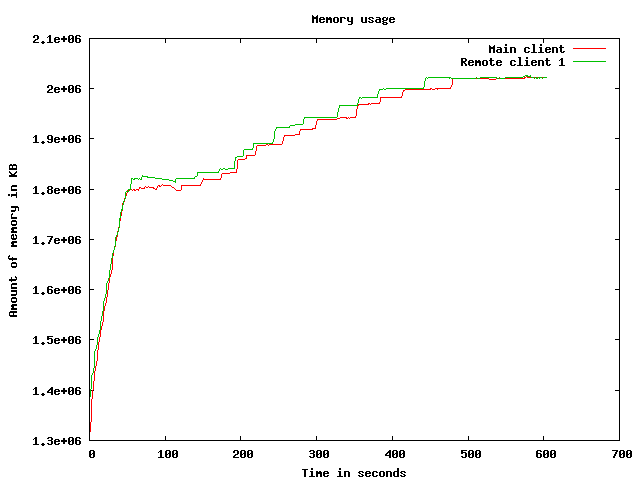
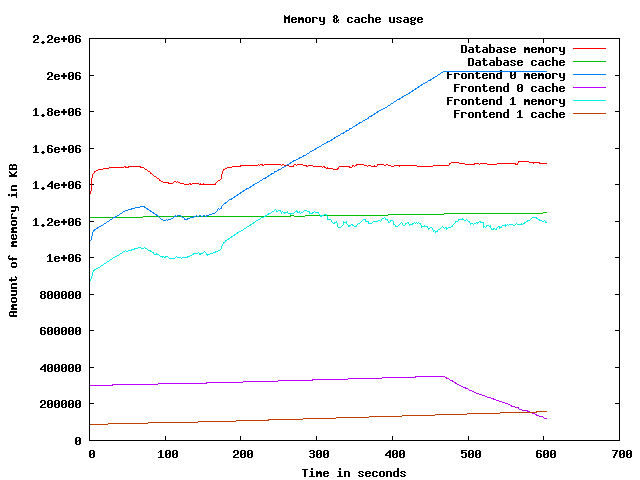
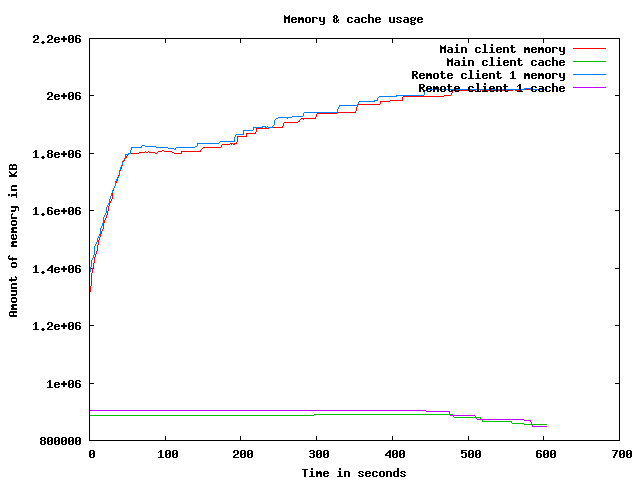
Memory usage graph
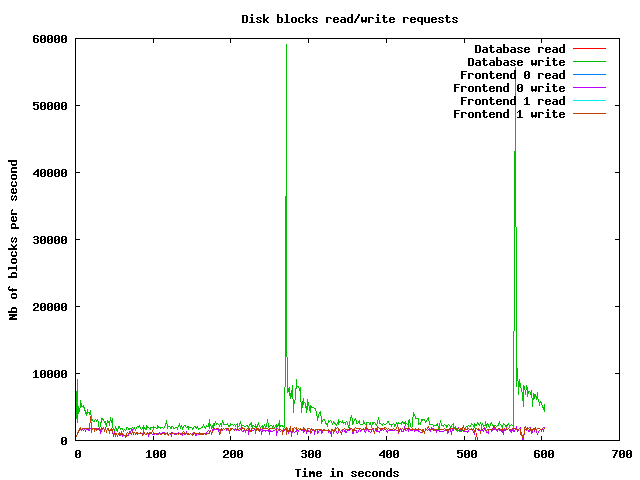
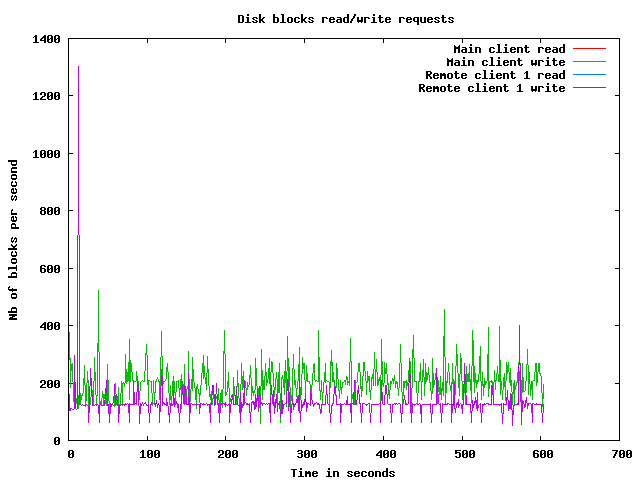
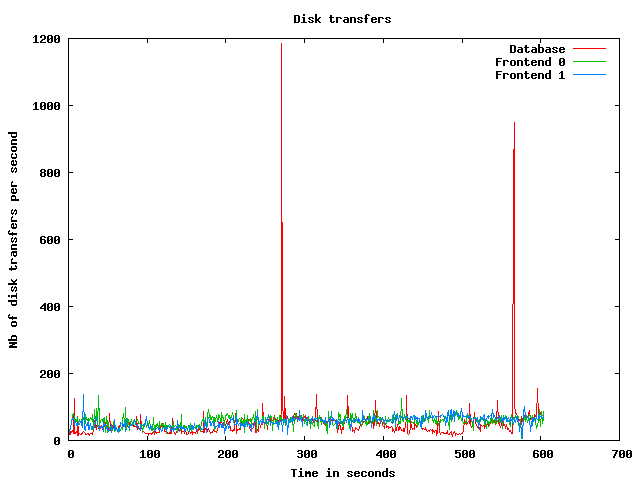
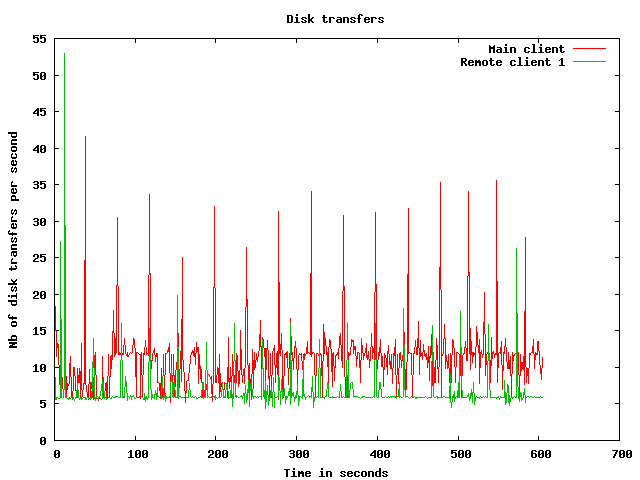
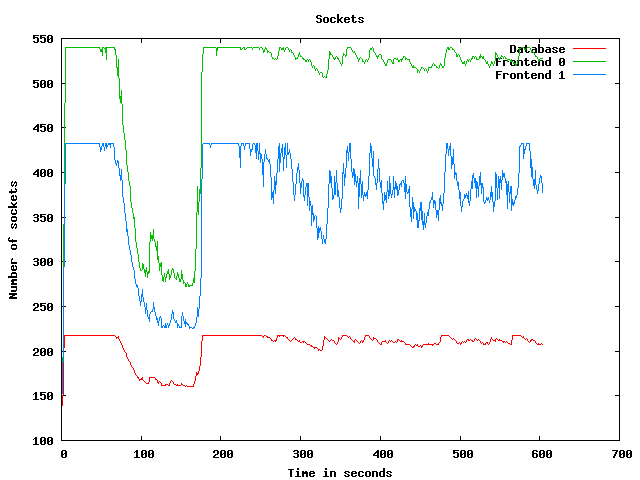
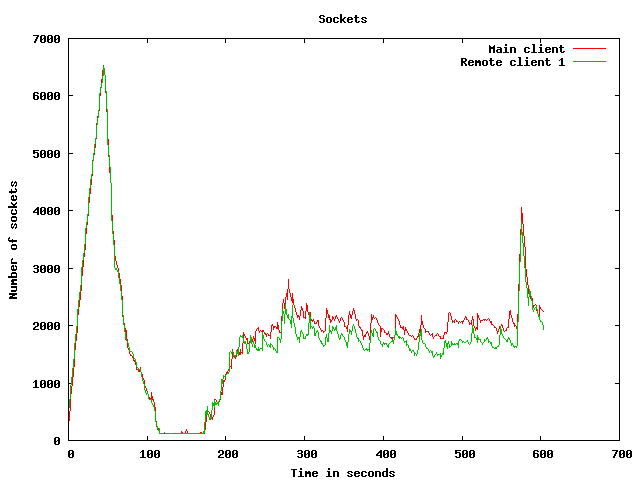
Disk usage graphs
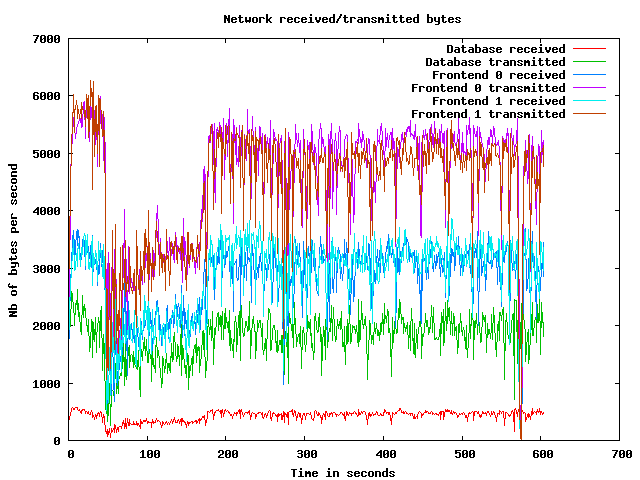
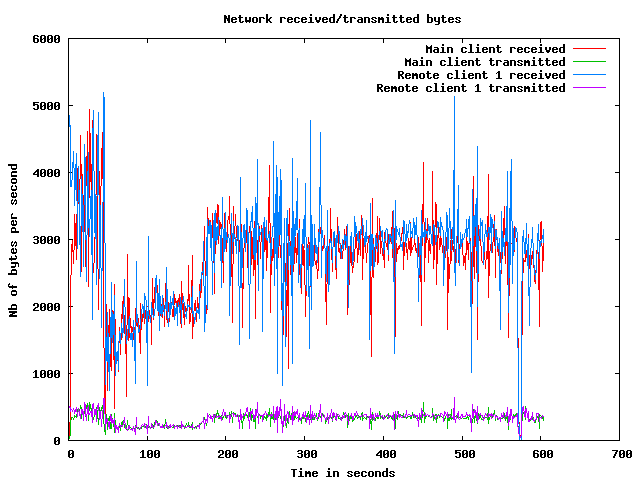
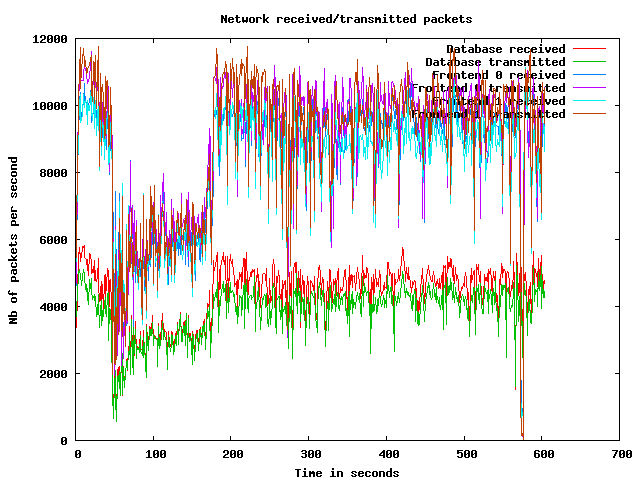
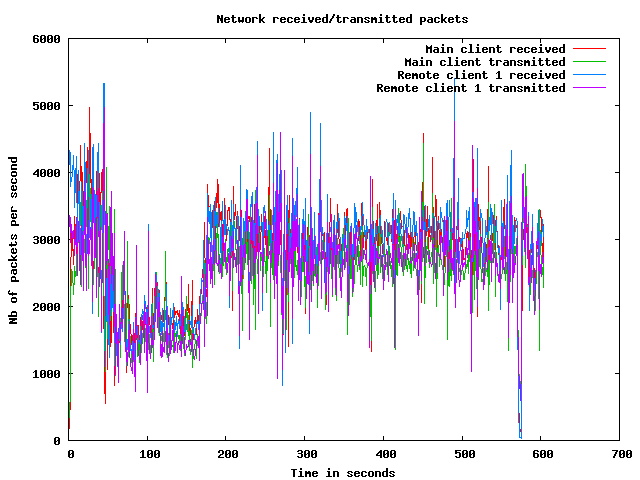
Network usage graphs
| Test start | 2009-3-19 13:40:31 |
| Up ramp start | 2009-3-19 13:41:18 |
| Runtime session start | 2009-3-19 13:43:18 |
| Down ramp start | 2009-3-19 13:50:48 |
| Test end | 2009-3-19 13:53:40 |
| Up ramp length | 2 minutes 0 millisecond (requested 120000 ms) |
| Runtime session length | 7 minutes 30 seconds 1 millisecond (requested 450000 ms) |
| Down ramp length | 30 seconds 0 millisecond (requested 30000 ms) |
| Total test length | 13 minutes 8 seconds 799 milliseconds |
| State name | % of total | Count | Errors | Minimum Time | Maximum Time | Average Time |
|---|---|---|---|---|---|---|
Home | 9 % | 9905 | 0 | 0 ms | 93378 ms | 8086 ms
|
Register | 1 % | 1443 | 0 | 0 ms | 93402 ms | 3598 ms
|
RegisterUser | 1 % | 1352 | 42 | 5 ms | 93038 ms | 2342 ms
|
Browse | 9 % | 10267 | 0 | 0 ms | 93377 ms | 3548 ms
|
BrowseCategories | 6 % | 6797 | 0 | 3 ms | 93382 ms | 2580 ms
|
SearchItemsInCategory | 14 % | 15755 | 0 | 3 ms | 93415 ms | 2288 ms
|
BrowseRegions | 2 % | 2850 | 0 | 3 ms | 93382 ms | 2697 ms
|
BrowseCategoriesInRegion | 2 % | 2658 | 0 | 3 ms | 93411 ms | 2769 ms
|
SearchItemsInRegion | 5 % | 5422 | 0 | 0 ms | 93363 ms | 2038 ms
|
ViewItem | 12 % | 13479 | 0 | 3 ms | 93428 ms | 2120 ms
|
ViewUserInfo | 2 % | 2595 | 0 | 3 ms | 93290 ms | 1915 ms
|
ViewBidHistory | 1 % | 1329 | 0 | 3 ms | 93331 ms | 2299 ms
|
BuyNowAuth | 1 % | 1195 | 0 | 2 ms | 93008 ms | 1926 ms
|
BuyNow | 1 % | 1080 | 141 | 4 ms | 93159 ms | 1900 ms
|
StoreBuyBow | 0 % | 815 | 0 | 5 ms | 93219 ms | 1723 ms
|
PutBidAuth | 4 % | 4470 | 0 | 0 ms | 93375 ms | 2116 ms
|
PutBid | 4 % | 4521 | 486 | 1 ms | 93333 ms | 1938 ms
|
StoreBid | 2 % | 2670 | 2 | 4 ms | 93236 ms | 1993 ms
|
PutCommentAuth | 0 % | 0 | 0 | 0 ms | 0 ms | 0 ms
|
PutComment | 0 % | 409 | 42 | 3 ms | 93014 ms | 1201 ms
|
StoreComment | 0 % | 325 | 0 | 5 ms | 93006 ms | 1400 ms
|
Sell | 0 % | 747 | 0 | 0 ms | 93046 ms | 3778 ms
|
SelectCategoryToSellItem | 0 % | 687 | 0 | 3 ms | 115432 ms | 3007 ms
|
SellItemForm | 0 % | 639 | 0 | 2 ms | 93038 ms | 2634 ms
|
RegisterItem | 0 % | 590 | 0 | 4 ms | 93010 ms | 1888 ms
|
AboutMe (auth form) | 2 % | 2198 | 0 | 0 ms | 93399 ms | 3481 ms
|
AboutMe | 2 % | 3131 | 0 | 4 ms | 93251 ms | 2879 ms
|
Back probability | 8 % | 8734 | 0 | 0 ms | 0 ms | 0 ms
|
End of Session | 1 % | 1148 | 0 | 0 ms | 0 ms | 0 ms
|
Total | 100 % | 107211 | 713 | - | - | 2740 ms
|
Average throughput | 899 req/s
| |||||
Completed sessions | 1037
| |||||
Total time | 58584 seconds
| |||||
Average session time | 56 seconds
| |||||
| State name | % of total | Count | Errors | Minimum Time | Maximum Time | Average Time |
|---|---|---|---|---|---|---|
Home | 4 % | 13754 | 0 | 0 ms | 381111 ms | 1069 ms
|
Register | 1 % | 3528 | 0 | 0 ms | 239308 ms | 1867 ms
|
RegisterUser | 1 % | 3471 | 146 | 5 ms | 324751 ms | 2266 ms
|
Browse | 6 % | 23900 | 0 | 0 ms | 391030 ms | 2175 ms
|
BrowseCategories | 4 % | 16606 | 0 | 3 ms | 390601 ms | 2035 ms
|
SearchItemsInCategory | 15 % | 53129 | 0 | 3 ms | 391078 ms | 2309 ms
|
BrowseRegions | 2 % | 7005 | 0 | 3 ms | 390649 ms | 2275 ms
|
BrowseCategoriesInRegion | 2 % | 6878 | 0 | 3 ms | 391061 ms | 2189 ms
|
SearchItemsInRegion | 5 % | 18246 | 0 | 0 ms | 393641 ms | 2241 ms
|
ViewItem | 14 % | 48784 | 0 | 3 ms | 390581 ms | 2310 ms
|
ViewUserInfo | 3 % | 11350 | 0 | 3 ms | 386837 ms | 2214 ms
|
ViewBidHistory | 1 % | 5981 | 0 | 3 ms | 386808 ms | 2823 ms
|
BuyNowAuth | 1 % | 4635 | 0 | 2 ms | 242592 ms | 1786 ms
|
BuyNow | 1 % | 4566 | 548 | 4 ms | 380128 ms | 2545 ms
|
StoreBuyBow | 1 % | 3955 | 2 | 5 ms | 380052 ms | 2728 ms
|
PutBidAuth | 4 % | 16893 | 0 | 0 ms | 390536 ms | 2205 ms
|
PutBid | 5 % | 19702 | 1985 | 4 ms | 391159 ms | 2187 ms
|
StoreBid | 3 % | 13039 | 9 | 5 ms | 298378 ms | 2167 ms
|
PutCommentAuth | 0 % | 0 | 0 | 0 ms | 0 ms | 0 ms
|
PutComment | 0 % | 1655 | 110 | 4 ms | 381855 ms | 2033 ms
|
StoreComment | 0 % | 1507 | 0 | 5 ms | 284078 ms | 2225 ms
|
Sell | 0 % | 1856 | 0 | 0 ms | 285555 ms | 2932 ms
|
SelectCategoryToSellItem | 0 % | 1823 | 0 | 4 ms | 236140 ms | 2091 ms
|
SellItemForm | 0 % | 1778 | 0 | 2 ms | 212524 ms | 1757 ms
|
RegisterItem | 0 % | 1745 | 0 | 5 ms | 194751 ms | 1870 ms
|
AboutMe (auth form) | 1 % | 5653 | 0 | 0 ms | 386617 ms | 2152 ms
|
AboutMe | 2 % | 9513 | 0 | 5 ms | 391215 ms | 2607 ms
|
Back probability | 10 % | 36441 | 0 | 0 ms | 0 ms | 0 ms
|
End of Session | 1 % | 4941 | 0 | 0 ms | 0 ms | 0 ms
|
Total | 100 % | 342334 | 2800 | - | - | 1920 ms
|
Average throughput | 766 req/s
| |||||
Completed sessions | 4974
| |||||
Total time | 1367311 seconds
| |||||
Average session time | 274 seconds
| |||||
| State name | % of total | Count | Errors | Minimum Time | Maximum Time | Average Time |
|---|---|---|---|---|---|---|
Home | 3 % | 534 | 0 | 0 ms | 211143 ms | 4164 ms
|
Register | 1 % | 157 | 0 | 0 ms | 93081 ms | 1872 ms
|
RegisterUser | 1 % | 142 | 11 | 5 ms | 190062 ms | 6217 ms
|
Browse | 6 % | 951 | 0 | 0 ms | 401013 ms | 9110 ms
|
BrowseCategories | 4 % | 636 | 0 | 3 ms | 401033 ms | 8574 ms
|
SearchItemsInCategory | 14 % | 1972 | 0 | 3 ms | 380012 ms | 7308 ms
|
BrowseRegions | 2 % | 283 | 0 | 3 ms | 211113 ms | 7763 ms
|
BrowseCategoriesInRegion | 2 % | 286 | 0 | 3 ms | 236188 ms | 9066 ms
|
SearchItemsInRegion | 5 % | 688 | 0 | 0 ms | 235656 ms | 6273 ms
|
ViewItem | 14 % | 1914 | 0 | 3 ms | 401043 ms | 8249 ms
|
ViewUserInfo | 3 % | 438 | 0 | 3 ms | 351343 ms | 8902 ms
|
ViewBidHistory | 1 % | 259 | 0 | 3 ms | 190178 ms | 3799 ms
|
BuyNowAuth | 1 % | 186 | 0 | 2 ms | 235426 ms | 9246 ms
|
BuyNow | 1 % | 183 | 20 | 5 ms | 411582 ms | 9369 ms
|
StoreBuyBow | 1 % | 171 | 0 | 5 ms | 235668 ms | 7005 ms
|
PutBidAuth | 4 % | 656 | 0 | 0 ms | 235481 ms | 7082 ms
|
PutBid | 5 % | 777 | 73 | 3 ms | 283589 ms | 8466 ms
|
StoreBid | 4 % | 556 | 1 | 5 ms | 235437 ms | 10488 ms
|
PutCommentAuth | 0 % | 0 | 0 | 0 ms | 0 ms | 0 ms
|
PutComment | 0 % | 73 | 7 | 4 ms | 211066 ms | 6133 ms
|
StoreComment | 0 % | 78 | 0 | 5 ms | 190117 ms | 3702 ms
|
Sell | 0 % | 77 | 0 | 0 ms | 124298 ms | 2903 ms
|
SelectCategoryToSellItem | 0 % | 73 | 0 | 4 ms | 211045 ms | 8433 ms
|
SellItemForm | 0 % | 82 | 0 | 2 ms | 211056 ms | 8260 ms
|
RegisterItem | 0 % | 87 | 0 | 4 ms | 93003 ms | 2671 ms
|
AboutMe (auth form) | 1 % | 223 | 0 | 0 ms | 190054 ms | 8562 ms
|
AboutMe | 2 % | 376 | 0 | 4 ms | 211176 ms | 7202 ms
|
Back probability | 11 % | 1534 | 0 | 0 ms | 0 ms | 0 ms
|
End of Session | 1 % | 229 | 0 | 0 ms | 0 ms | 0 ms
|
Total | 100 % | 13621 | 112 | - | - | 6590 ms
|
Average throughput | 457 req/s
| |||||
Completed sessions | 202
| |||||
Total time | 79034 seconds
| |||||
Average session time | 391 seconds
| |||||
| State name | % of total | Count | Errors | Minimum Time | Maximum Time | Average Time |
|---|---|---|---|---|---|---|
Home | 5 % | 24199 | 0 | 0 ms | 381111 ms | 4067 ms
|
Register | 1 % | 5134 | 0 | 0 ms | 379998 ms | 2609 ms
|
RegisterUser | 1 % | 4972 | 199 | 5 ms | 324751 ms | 2473 ms
|
Browse | 7 % | 35174 | 0 | 0 ms | 401013 ms | 3041 ms
|
BrowseCategories | 5 % | 24084 | 0 | 3 ms | 401033 ms | 2652 ms
|
SearchItemsInCategory | 15 % | 71300 | 0 | 3 ms | 391078 ms | 2658 ms
|
BrowseRegions | 2 % | 10152 | 0 | 3 ms | 390649 ms | 2850 ms
|
BrowseCategoriesInRegion | 2 % | 9843 | 0 | 3 ms | 391061 ms | 2819 ms
|
SearchItemsInRegion | 5 % | 24488 | 0 | 0 ms | 393641 ms | 2636 ms
|
ViewItem | 13 % | 64437 | 0 | 3 ms | 401043 ms | 2775 ms
|
ViewUserInfo | 3 % | 14464 | 0 | 3 ms | 386837 ms | 2644 ms
|
ViewBidHistory | 1 % | 7600 | 0 | 3 ms | 386808 ms | 3027 ms
|
BuyNowAuth | 1 % | 6033 | 0 | 2 ms | 380283 ms | 2259 ms
|
BuyNow | 1 % | 5836 | 711 | 4 ms | 411582 ms | 3138 ms
|
StoreBuyBow | 1 % | 4956 | 2 | 5 ms | 380052 ms | 3198 ms
|
PutBidAuth | 4 % | 22060 | 0 | 0 ms | 390536 ms | 2624 ms
|
PutBid | 5 % | 25113 | 2547 | 1 ms | 391159 ms | 2620 ms
|
StoreBid | 3 % | 16298 | 12 | 4 ms | 380360 ms | 2783 ms
|
PutCommentAuth | 0 % | 0 | 0 | 0 ms | 0 ms | 0 ms
|
PutComment | 0 % | 2145 | 159 | 3 ms | 381855 ms | 2225 ms
|
StoreComment | 0 % | 1914 | 0 | 5 ms | 284078 ms | 2385 ms
|
Sell | 0 % | 2686 | 0 | 0 ms | 285555 ms | 3334 ms
|
SelectCategoryToSellItem | 0 % | 2587 | 0 | 3 ms | 236140 ms | 3058 ms
|
SellItemForm | 0 % | 2508 | 0 | 2 ms | 212524 ms | 2490 ms
|
RegisterItem | 0 % | 2426 | 0 | 4 ms | 194751 ms | 2329 ms
|
AboutMe (auth form) | 1 % | 8085 | 0 | 0 ms | 386617 ms | 2921 ms
|
AboutMe | 2 % | 13136 | 0 | 4 ms | 391215 ms | 3037 ms
|
Back probability | 10 % | 46813 | 0 | 0 ms | 0 ms | 0 ms
|
End of Session | 1 % | 6334 | 0 | 0 ms | 0 ms | 0 ms
|
Total | 100 % | 464777 | 3630 | - | - | 2485 ms
|
Average throughput | 780 req/s
| |||||
Completed sessions | 6334
| |||||
Total time | 1559887 seconds
| |||||
Average session time | 246 seconds
| |||||
An error occured while waiting for remote processes termination (Skipping waits)
Command is: /usr/bin/scp farm6.csail.mit.edu:/tmp/client1 /home/drkp/sandbox/txcache/src/RUBiS-1.4.3/bench/2009-3-19@13:40:31//client1.bin
Command is: /usr/bin/ssh -x localhost /bin/bash -c 'LANG=en_GB.UTF-8 /usr/bin/sar -n DEV -n SOCK -rubcw 1 605 -f /home/drkp/sandbox/txcache/src/RUBiS-1.4.3/bench/2009-3-19@13:40:31//client1.bin > /home/drkp/sandbox/txcache/src/RUBiS-1.4.3/bench/2009-3-19@13:40:31//client1'
Command is: /usr/bin/scp farm14:/tmp/db_server0 /home/drkp/sandbox/txcache/src/RUBiS-1.4.3/bench/2009-3-19@13:40:31//db_server0.bin
Command is: /usr/bin/ssh -x localhost /bin/bash -c 'LANG=en_GB.UTF-8 /usr/bin/sar -n DEV -n SOCK -rubcw 1 605 -f /home/drkp/sandbox/txcache/src/RUBiS-1.4.3/bench/2009-3-19@13:40:31//db_server0.bin > /home/drkp/sandbox/txcache/src/RUBiS-1.4.3/bench/2009-3-19@13:40:31//db_server0'
Command is: /usr/bin/scp farm12.csail.mit.edu:/tmp/web_server0 /home/drkp/sandbox/txcache/src/RUBiS-1.4.3/bench/2009-3-19@13:40:31//web_server0.bin
Command is: /usr/bin/ssh -x localhost /bin/bash -c 'LANG=en_GB.UTF-8 /usr/bin/sar -n DEV -n SOCK -rubcw 1 605 -f /home/drkp/sandbox/txcache/src/RUBiS-1.4.3/bench/2009-3-19@13:40:31//web_server0.bin > /home/drkp/sandbox/txcache/src/RUBiS-1.4.3/bench/2009-3-19@13:40:31//web_server0'
Command is: /usr/bin/scp farm13.csail.mit.edu:/tmp/web_server1 /home/drkp/sandbox/txcache/src/RUBiS-1.4.3/bench/2009-3-19@13:40:31//web_server1.bin
Command is: /usr/bin/ssh -x localhost /bin/bash -c 'LANG=en_GB.UTF-8 /usr/bin/sar -n DEV -n SOCK -rubcw 1 605 -f /home/drkp/sandbox/txcache/src/RUBiS-1.4.3/bench/2009-3-19@13:40:31//web_server1.bin > /home/drkp/sandbox/txcache/src/RUBiS-1.4.3/bench/2009-3-19@13:40:31//web_server1'
Command is: /usr/bin/scp localhost:/tmp/client0 /home/drkp/sandbox/txcache/src/RUBiS-1.4.3/bench/2009-3-19@13:40:31//client0.bin
Command is: /usr/bin/ssh -x localhost /bin/bash -c 'LANG=en_GB.UTF-8 /usr/bin/sar -n DEV -n SOCK -rubcw 1 605 -f /home/drkp/sandbox/txcache/src/RUBiS-1.4.3/bench/2009-3-19@13:40:31//client0.bin > /home/drkp/sandbox/txcache/src/RUBiS-1.4.3/bench/2009-3-19@13:40:31//client0'
Command is: /usr/bin/scp farm6.csail.mit.edu:/tmp/trace_client1.html /home/drkp/sandbox/txcache/src/RUBiS-1.4.3/bench/2009-3-19@13:40:31//
Command is: /usr/bin/scp farm6.csail.mit.edu:/tmp/stat_client1.html /home/drkp/sandbox/txcache/src/RUBiS-1.4.3/bench/2009-3-19@13:40:31//
|
|
|
|
|
|
 | 
|
 | 
|
 | 
|
 | 
|
 | 
|
 | 
|
 | 
|
 | 
|
 | 
|