Node information
Test timing information
Up ramp statistics
Runtime session statistics
Down ramp statistics
Overall statistics
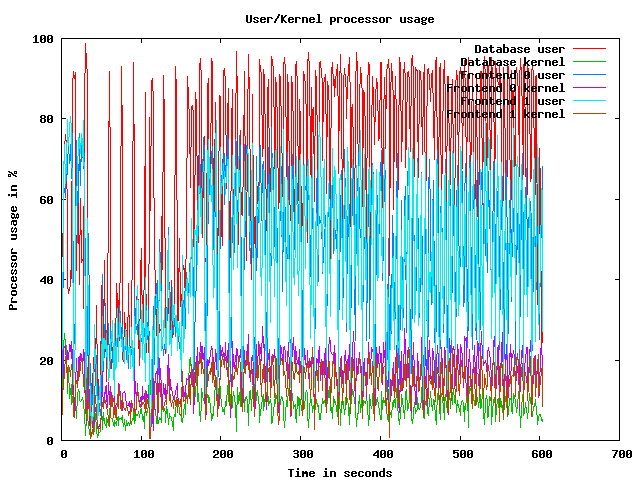
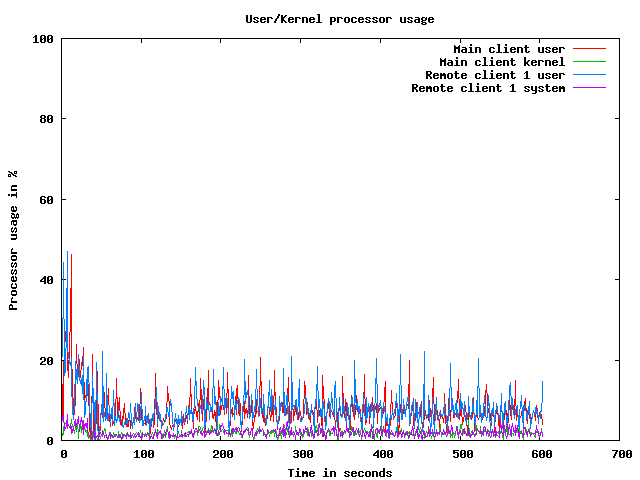
CPU usage graphs
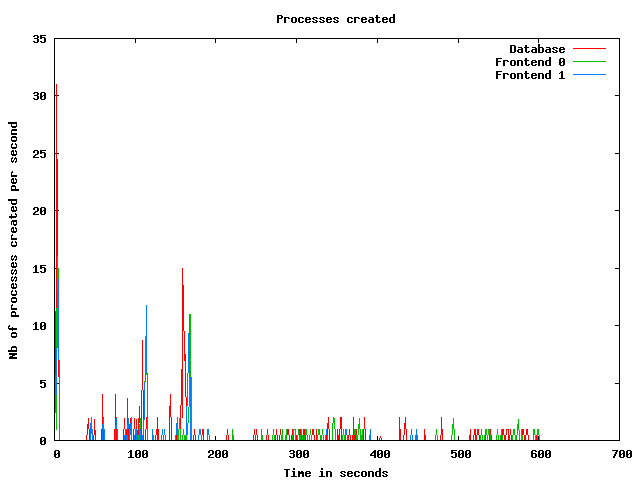
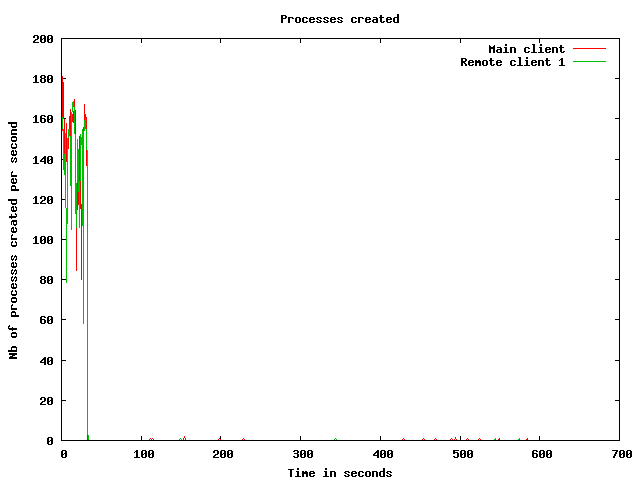
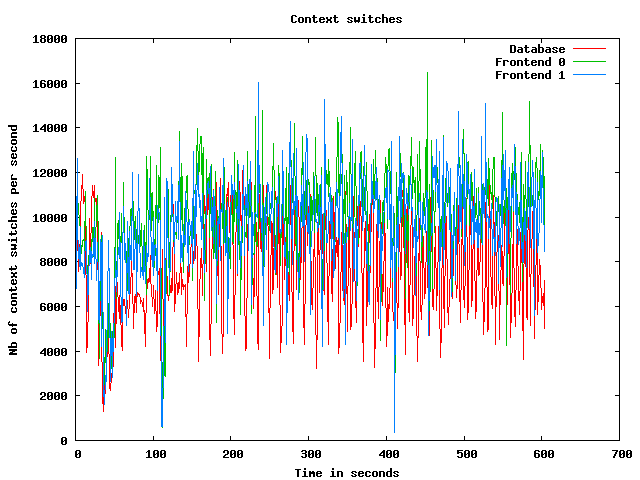
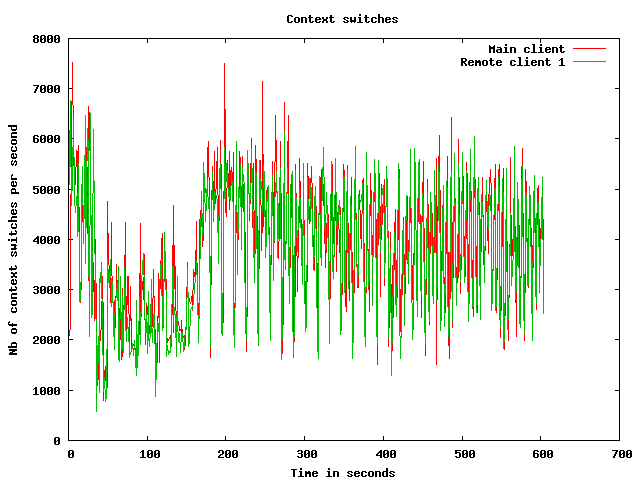
Processes usage graphs
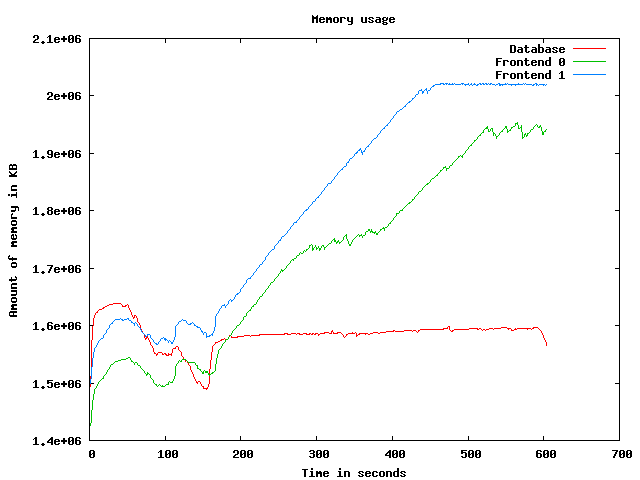
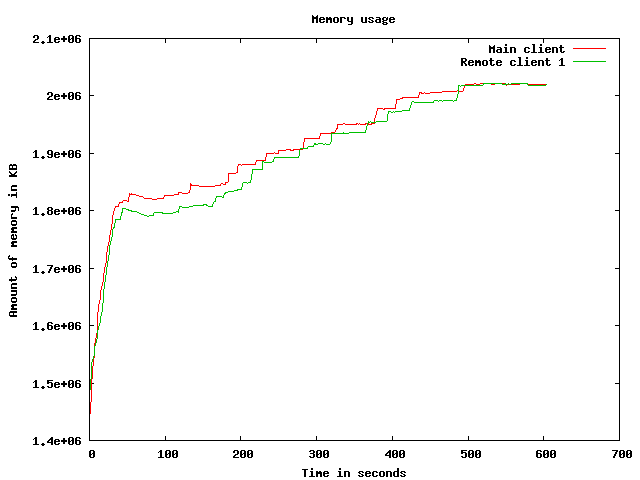
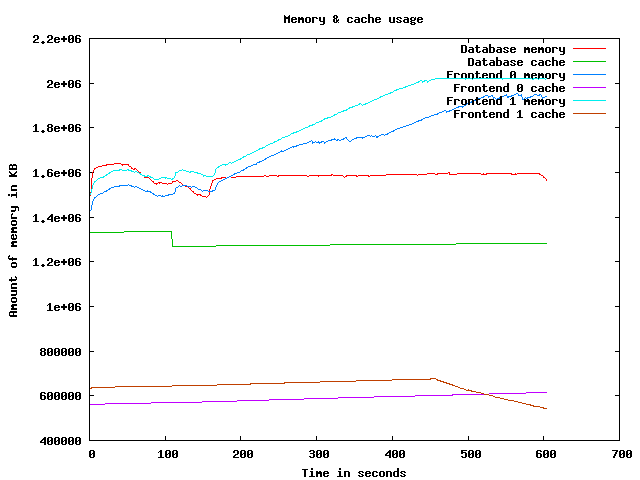
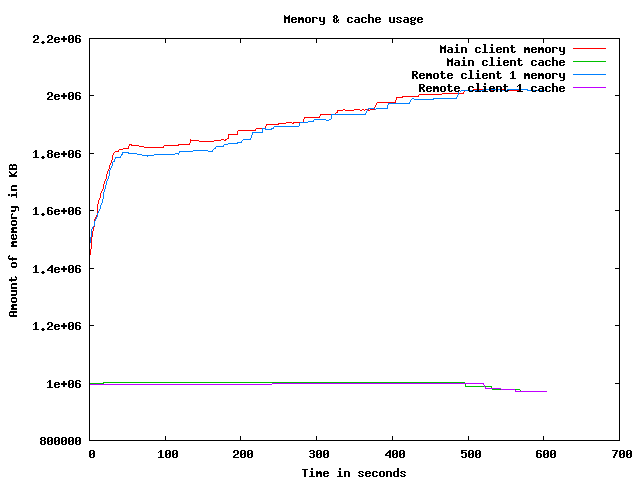
Memory usage graph
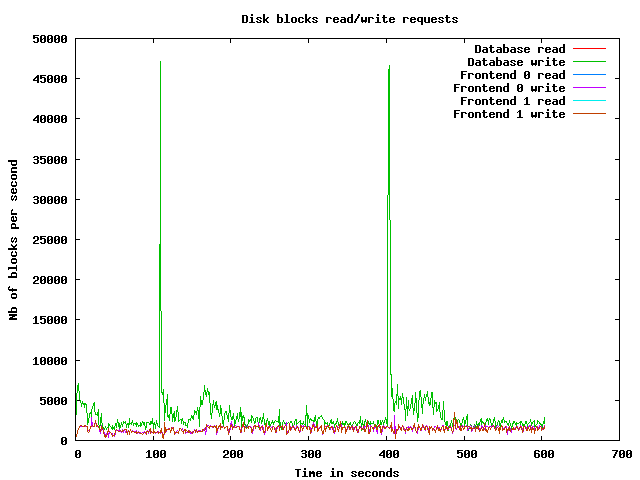
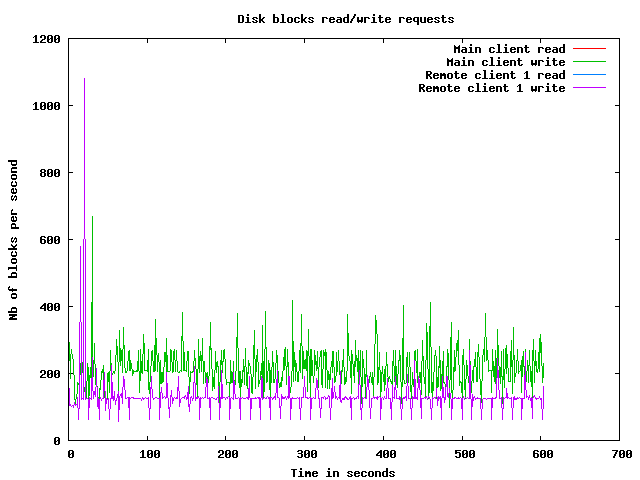
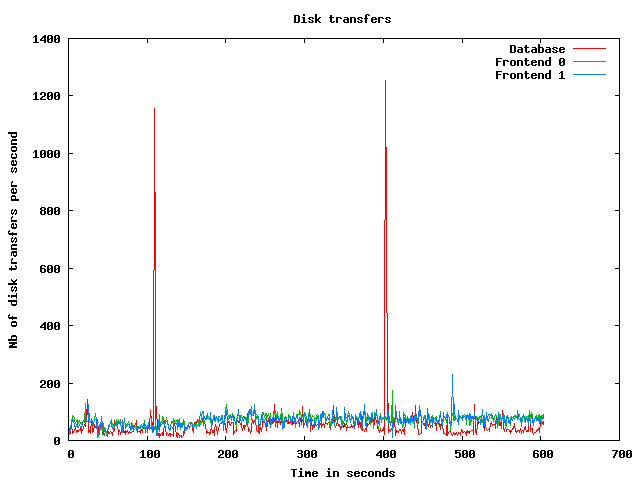
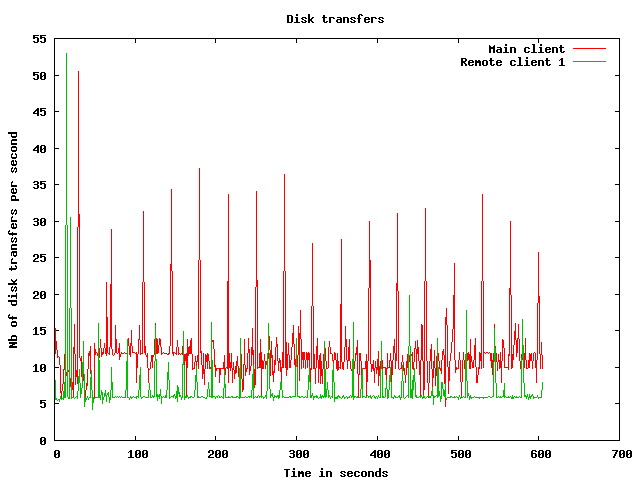
Disk usage graphs
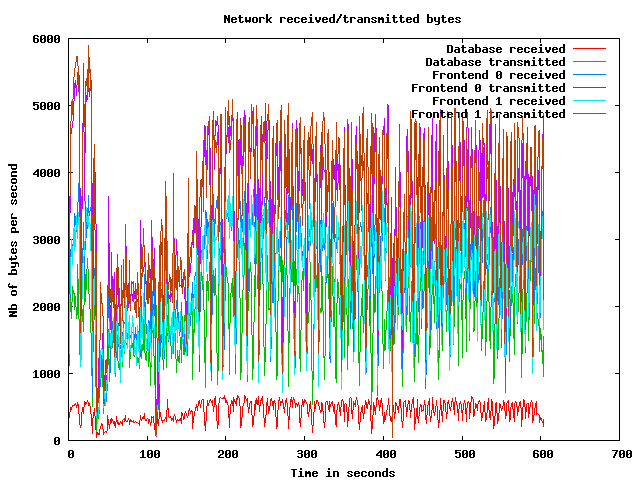
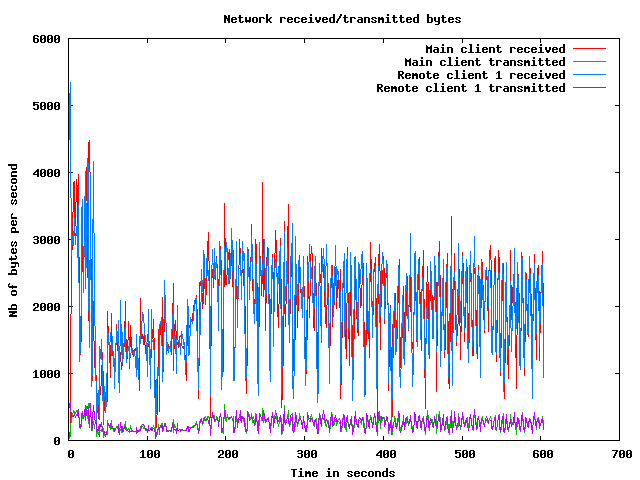
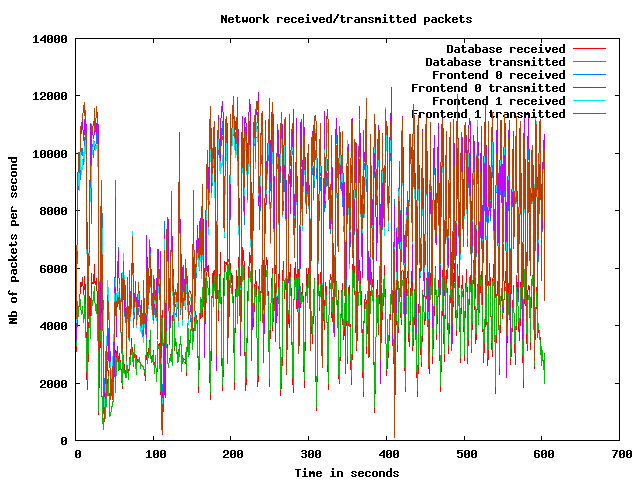
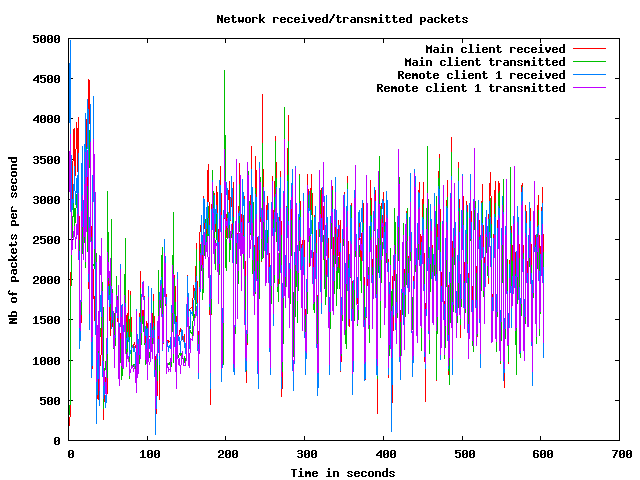
Network usage graphs
| Test start | 2009-3-19 15:52:29 |
| Up ramp start | 2009-3-19 15:53:3 |
| Runtime session start | 2009-3-19 15:55:3 |
| Down ramp start | 2009-3-19 16:2:33 |
| Test end | 2009-3-19 16:5:13 |
| Up ramp length | 2 minutes 0 millisecond (requested 120000 ms) |
| Runtime session length | 7 minutes 30 seconds 0 millisecond (requested 450000 ms) |
| Down ramp length | 30 seconds 1 millisecond (requested 30000 ms) |
| Total test length | 12 minutes 44 seconds 221 milliseconds |
| State name | % of total | Count | Errors | Minimum Time | Maximum Time | Average Time |
|---|---|---|---|---|---|---|
Home | 9 % | 7337 | 0 | 0 ms | 93083 ms | 9581 ms
|
Register | 1 % | 978 | 0 | 0 ms | 93022 ms | 3496 ms
|
RegisterUser | 1 % | 903 | 40 | 5 ms | 93006 ms | 2298 ms
|
Browse | 9 % | 7374 | 0 | 0 ms | 93037 ms | 3331 ms
|
BrowseCategories | 6 % | 4787 | 0 | 3 ms | 93051 ms | 2334 ms
|
SearchItemsInCategory | 14 % | 10828 | 0 | 3 ms | 93041 ms | 2077 ms
|
BrowseRegions | 2 % | 2093 | 0 | 3 ms | 93039 ms | 2375 ms
|
BrowseCategoriesInRegion | 2 % | 1923 | 0 | 3 ms | 93008 ms | 2291 ms
|
SearchItemsInRegion | 5 % | 3870 | 0 | 0 ms | 93123 ms | 2109 ms
|
ViewItem | 12 % | 9150 | 0 | 3 ms | 93051 ms | 1984 ms
|
ViewUserInfo | 2 % | 1621 | 0 | 3 ms | 93026 ms | 1745 ms
|
ViewBidHistory | 1 % | 841 | 0 | 3 ms | 45826 ms | 2489 ms
|
BuyNowAuth | 1 % | 775 | 0 | 2 ms | 93000 ms | 1864 ms
|
BuyNow | 0 % | 683 | 85 | 5 ms | 45208 ms | 1581 ms
|
StoreBuyBow | 0 % | 514 | 0 | 5 ms | 45567 ms | 1732 ms
|
PutBidAuth | 4 % | 3130 | 0 | 0 ms | 93008 ms | 2081 ms
|
PutBid | 4 % | 3064 | 370 | 4 ms | 93049 ms | 1618 ms
|
StoreBid | 2 % | 1789 | 1 | 5 ms | 93009 ms | 1755 ms
|
PutCommentAuth | 0 % | 0 | 0 | 0 ms | 0 ms | 0 ms
|
PutComment | 0 % | 275 | 25 | 4 ms | 45020 ms | 936 ms
|
StoreComment | 0 % | 220 | 0 | 5 ms | 45014 ms | 1362 ms
|
Sell | 0 % | 517 | 0 | 0 ms | 93023 ms | 3671 ms
|
SelectCategoryToSellItem | 0 % | 484 | 0 | 4 ms | 93007 ms | 2477 ms
|
SellItemForm | 0 % | 457 | 0 | 2 ms | 45519 ms | 1949 ms
|
RegisterItem | 0 % | 419 | 0 | 4 ms | 93011 ms | 2010 ms
|
AboutMe (auth form) | 2 % | 1579 | 0 | 0 ms | 93010 ms | 3667 ms
|
AboutMe | 2 % | 2136 | 0 | 4 ms | 93063 ms | 2247 ms
|
Back probability | 7 % | 5603 | 0 | 0 ms | 0 ms | 0 ms
|
End of Session | 0 % | 718 | 0 | 0 ms | 0 ms | 0 ms
|
Total | 100 % | 74068 | 521 | - | - | 2797 ms
|
Average throughput | 621 req/s
| |||||
Completed sessions | 635
| |||||
Total time | 37861 seconds
| |||||
Average session time | 59 seconds
| |||||
| State name | % of total | Count | Errors | Minimum Time | Maximum Time | Average Time |
|---|---|---|---|---|---|---|
Home | 4 % | 11016 | 0 | 0 ms | 199622 ms | 1112 ms
|
Register | 1 % | 2798 | 0 | 0 ms | 212904 ms | 2260 ms
|
RegisterUser | 1 % | 2771 | 144 | 5 ms | 380062 ms | 2288 ms
|
Browse | 7 % | 18600 | 0 | 0 ms | 249398 ms | 2095 ms
|
BrowseCategories | 4 % | 13009 | 0 | 3 ms | 241829 ms | 2377 ms
|
SearchItemsInCategory | 15 % | 41191 | 0 | 3 ms | 284627 ms | 2388 ms
|
BrowseRegions | 2 % | 5347 | 0 | 3 ms | 203193 ms | 2472 ms
|
BrowseCategoriesInRegion | 1 % | 5293 | 0 | 3 ms | 194725 ms | 2402 ms
|
SearchItemsInRegion | 5 % | 13755 | 0 | 0 ms | 380023 ms | 2344 ms
|
ViewItem | 14 % | 37493 | 0 | 3 ms | 249211 ms | 2318 ms
|
ViewUserInfo | 3 % | 8523 | 0 | 3 ms | 213502 ms | 2223 ms
|
ViewBidHistory | 1 % | 4651 | 0 | 3 ms | 201026 ms | 2991 ms
|
BuyNowAuth | 1 % | 3533 | 0 | 2 ms | 201537 ms | 2282 ms
|
BuyNow | 1 % | 3469 | 483 | 4 ms | 193516 ms | 2371 ms
|
StoreBuyBow | 1 % | 2919 | 4 | 5 ms | 203214 ms | 2449 ms
|
PutBidAuth | 4 % | 13064 | 0 | 0 ms | 249296 ms | 2179 ms
|
PutBid | 5 % | 15185 | 1542 | 4 ms | 226997 ms | 2280 ms
|
StoreBid | 3 % | 10098 | 10 | 5 ms | 380066 ms | 2384 ms
|
PutCommentAuth | 0 % | 0 | 0 | 0 ms | 0 ms | 0 ms
|
PutComment | 0 % | 1311 | 81 | 4 ms | 193762 ms | 1821 ms
|
StoreComment | 0 % | 1214 | 0 | 5 ms | 190115 ms | 2086 ms
|
Sell | 0 % | 1520 | 0 | 0 ms | 199650 ms | 2802 ms
|
SelectCategoryToSellItem | 0 % | 1492 | 0 | 4 ms | 193297 ms | 1706 ms
|
SellItemForm | 0 % | 1441 | 0 | 2 ms | 199628 ms | 2467 ms
|
RegisterItem | 0 % | 1414 | 0 | 5 ms | 194275 ms | 2700 ms
|
AboutMe (auth form) | 1 % | 4405 | 0 | 0 ms | 236242 ms | 2347 ms
|
AboutMe | 2 % | 7452 | 0 | 5 ms | 238974 ms | 2429 ms
|
Back probability | 10 % | 27980 | 0 | 0 ms | 0 ms | 0 ms
|
End of Session | 1 % | 3932 | 0 | 0 ms | 0 ms | 0 ms
|
Total | 100 % | 264876 | 2264 | - | - | 1981 ms
|
Average throughput | 593 req/s
| |||||
Completed sessions | 3949
| |||||
Total time | 1076827 seconds
| |||||
Average session time | 272 seconds
| |||||
| State name | % of total | Count | Errors | Minimum Time | Maximum Time | Average Time |
|---|---|---|---|---|---|---|
Home | 3 % | 401 | 0 | 0 ms | 195756 ms | 2655 ms
|
Register | 0 % | 103 | 0 | 0 ms | 380005 ms | 6928 ms
|
RegisterUser | 0 % | 103 | 5 | 5 ms | 389320 ms | 8316 ms
|
Browse | 7 % | 740 | 0 | 0 ms | 389295 ms | 6726 ms
|
BrowseCategories | 5 % | 575 | 0 | 3 ms | 389308 ms | 5972 ms
|
SearchItemsInCategory | 14 % | 1568 | 0 | 3 ms | 389302 ms | 6642 ms
|
BrowseRegions | 2 % | 212 | 0 | 3 ms | 120948 ms | 3972 ms
|
BrowseCategoriesInRegion | 1 % | 203 | 0 | 3 ms | 190014 ms | 4662 ms
|
SearchItemsInRegion | 4 % | 495 | 0 | 0 ms | 389293 ms | 7322 ms
|
ViewItem | 14 % | 1514 | 0 | 3 ms | 389360 ms | 4883 ms
|
ViewUserInfo | 3 % | 349 | 0 | 3 ms | 389305 ms | 3648 ms
|
ViewBidHistory | 1 % | 197 | 0 | 3 ms | 199325 ms | 2994 ms
|
BuyNowAuth | 1 % | 132 | 0 | 2 ms | 93373 ms | 5108 ms
|
BuyNow | 1 % | 130 | 21 | 5 ms | 389366 ms | 9703 ms
|
StoreBuyBow | 1 % | 118 | 0 | 5 ms | 190073 ms | 8402 ms
|
PutBidAuth | 5 % | 548 | 0 | 0 ms | 189991 ms | 2859 ms
|
PutBid | 5 % | 561 | 59 | 4 ms | 389329 ms | 7201 ms
|
StoreBid | 3 % | 403 | 0 | 5 ms | 389325 ms | 6213 ms
|
PutCommentAuth | 0 % | 0 | 0 | 0 ms | 0 ms | 0 ms
|
PutComment | 0 % | 57 | 3 | 4 ms | 93018 ms | 3113 ms
|
StoreComment | 0 % | 52 | 0 | 5 ms | 93005 ms | 5311 ms
|
Sell | 0 % | 72 | 0 | 0 ms | 93000 ms | 1521 ms
|
SelectCategoryToSellItem | 0 % | 69 | 0 | 4 ms | 389312 ms | 10375 ms
|
SellItemForm | 0 % | 74 | 0 | 2 ms | 45002 ms | 1278 ms
|
RegisterItem | 0 % | 58 | 0 | 4 ms | 93010 ms | 4079 ms
|
AboutMe (auth form) | 1 % | 185 | 0 | 0 ms | 199285 ms | 7121 ms
|
AboutMe | 3 % | 325 | 0 | 6 ms | 380532 ms | 6701 ms
|
Back probability | 10 % | 1121 | 0 | 0 ms | 0 ms | 0 ms
|
End of Session | 1 % | 154 | 0 | 0 ms | 0 ms | 0 ms
|
Total | 100 % | 10519 | 88 | - | - | 4928 ms
|
Average throughput | 353 req/s
| |||||
Completed sessions | 152
| |||||
Total time | 56551 seconds
| |||||
Average session time | 372 seconds
| |||||
| State name | % of total | Count | Errors | Minimum Time | Maximum Time | Average Time |
|---|---|---|---|---|---|---|
Home | 5 % | 18759 | 0 | 0 ms | 199622 ms | 4553 ms
|
Register | 1 % | 3884 | 0 | 0 ms | 380005 ms | 2813 ms
|
RegisterUser | 1 % | 3780 | 190 | 5 ms | 389320 ms | 2577 ms
|
Browse | 7 % | 26743 | 0 | 0 ms | 389295 ms | 2828 ms
|
BrowseCategories | 5 % | 18413 | 0 | 3 ms | 389308 ms | 2616 ms
|
SearchItemsInCategory | 15 % | 53890 | 0 | 3 ms | 389302 ms | 2663 ms
|
BrowseRegions | 2 % | 7658 | 0 | 3 ms | 380017 ms | 2781 ms
|
BrowseCategoriesInRegion | 2 % | 7431 | 0 | 3 ms | 194725 ms | 2750 ms
|
SearchItemsInRegion | 5 % | 18206 | 0 | 0 ms | 389293 ms | 2682 ms
|
ViewItem | 13 % | 48357 | 0 | 3 ms | 389360 ms | 2582 ms
|
ViewUserInfo | 3 % | 10539 | 0 | 3 ms | 389305 ms | 2411 ms
|
ViewBidHistory | 1 % | 5702 | 0 | 3 ms | 380188 ms | 3159 ms
|
BuyNowAuth | 1 % | 4447 | 0 | 2 ms | 379999 ms | 2694 ms
|
BuyNow | 1 % | 4292 | 589 | 4 ms | 389366 ms | 2705 ms
|
StoreBuyBow | 1 % | 3556 | 4 | 5 ms | 380007 ms | 2726 ms
|
PutBidAuth | 4 % | 16773 | 0 | 0 ms | 380000 ms | 2410 ms
|
PutBid | 5 % | 18875 | 1975 | 4 ms | 389329 ms | 2563 ms
|
StoreBid | 3 % | 12308 | 11 | 5 ms | 389325 ms | 2676 ms
|
PutCommentAuth | 0 % | 0 | 0 | 0 ms | 0 ms | 0 ms
|
PutComment | 0 % | 1646 | 109 | 4 ms | 193762 ms | 1887 ms
|
StoreComment | 0 % | 1488 | 0 | 5 ms | 190269 ms | 2342 ms
|
Sell | 0 % | 2116 | 0 | 0 ms | 199650 ms | 3049 ms
|
SelectCategoryToSellItem | 0 % | 2047 | 0 | 4 ms | 389312 ms | 2501 ms
|
SellItemForm | 0 % | 1977 | 0 | 2 ms | 199628 ms | 2849 ms
|
RegisterItem | 0 % | 1899 | 0 | 4 ms | 380003 ms | 3026 ms
|
AboutMe (auth form) | 1 % | 6183 | 0 | 0 ms | 379999 ms | 3249 ms
|
AboutMe | 2 % | 10005 | 0 | 4 ms | 380532 ms | 2742 ms
|
Back probability | 9 % | 34763 | 0 | 0 ms | 0 ms | 0 ms
|
End of Session | 1 % | 4808 | 0 | 0 ms | 0 ms | 0 ms
|
Total | 100 % | 350545 | 2878 | - | - | 2445 ms
|
Average throughput | 589 req/s
| |||||
Completed sessions | 4808
| |||||
Total time | 1203743 seconds
| |||||
Average session time | 250 seconds
| |||||
An error occured while waiting for remote processes termination (Skipping waits)
Command is: /usr/bin/scp farm6.csail.mit.edu:/tmp/client1 /home/drkp/sandbox/txcache/src/RUBiS-1.4.3/bench/2009-3-19@15:52:29//client1.bin
Command is: /usr/bin/ssh -x localhost /bin/bash -c 'LANG=en_GB.UTF-8 /usr/bin/sar -n DEV -n SOCK -rubcw 1 605 -f /home/drkp/sandbox/txcache/src/RUBiS-1.4.3/bench/2009-3-19@15:52:29//client1.bin > /home/drkp/sandbox/txcache/src/RUBiS-1.4.3/bench/2009-3-19@15:52:29//client1'
Command is: /usr/bin/scp farm14:/tmp/db_server0 /home/drkp/sandbox/txcache/src/RUBiS-1.4.3/bench/2009-3-19@15:52:29//db_server0.bin
Command is: /usr/bin/ssh -x localhost /bin/bash -c 'LANG=en_GB.UTF-8 /usr/bin/sar -n DEV -n SOCK -rubcw 1 605 -f /home/drkp/sandbox/txcache/src/RUBiS-1.4.3/bench/2009-3-19@15:52:29//db_server0.bin > /home/drkp/sandbox/txcache/src/RUBiS-1.4.3/bench/2009-3-19@15:52:29//db_server0'
Command is: /usr/bin/scp farm12.csail.mit.edu:/tmp/web_server0 /home/drkp/sandbox/txcache/src/RUBiS-1.4.3/bench/2009-3-19@15:52:29//web_server0.bin
Command is: /usr/bin/ssh -x localhost /bin/bash -c 'LANG=en_GB.UTF-8 /usr/bin/sar -n DEV -n SOCK -rubcw 1 605 -f /home/drkp/sandbox/txcache/src/RUBiS-1.4.3/bench/2009-3-19@15:52:29//web_server0.bin > /home/drkp/sandbox/txcache/src/RUBiS-1.4.3/bench/2009-3-19@15:52:29//web_server0'
Command is: /usr/bin/scp farm13.csail.mit.edu:/tmp/web_server1 /home/drkp/sandbox/txcache/src/RUBiS-1.4.3/bench/2009-3-19@15:52:29//web_server1.bin
Command is: /usr/bin/ssh -x localhost /bin/bash -c 'LANG=en_GB.UTF-8 /usr/bin/sar -n DEV -n SOCK -rubcw 1 605 -f /home/drkp/sandbox/txcache/src/RUBiS-1.4.3/bench/2009-3-19@15:52:29//web_server1.bin > /home/drkp/sandbox/txcache/src/RUBiS-1.4.3/bench/2009-3-19@15:52:29//web_server1'
Command is: /usr/bin/scp localhost:/tmp/client0 /home/drkp/sandbox/txcache/src/RUBiS-1.4.3/bench/2009-3-19@15:52:29//client0.bin
Command is: /usr/bin/ssh -x localhost /bin/bash -c 'LANG=en_GB.UTF-8 /usr/bin/sar -n DEV -n SOCK -rubcw 1 605 -f /home/drkp/sandbox/txcache/src/RUBiS-1.4.3/bench/2009-3-19@15:52:29//client0.bin > /home/drkp/sandbox/txcache/src/RUBiS-1.4.3/bench/2009-3-19@15:52:29//client0'
Command is: /usr/bin/scp farm6.csail.mit.edu:/tmp/trace_client1.html /home/drkp/sandbox/txcache/src/RUBiS-1.4.3/bench/2009-3-19@15:52:29//
Command is: /usr/bin/scp farm6.csail.mit.edu:/tmp/stat_client1.html /home/drkp/sandbox/txcache/src/RUBiS-1.4.3/bench/2009-3-19@15:52:29//
|
|
|
|
|
|
 | 
|
 | 
|
 | 
|
 | 
|
 | 
|
 | 
|
 | 
|
 | 
|
 | 
|