Node information
Test timing information
Up ramp statistics
Runtime session statistics
Down ramp statistics
Overall statistics
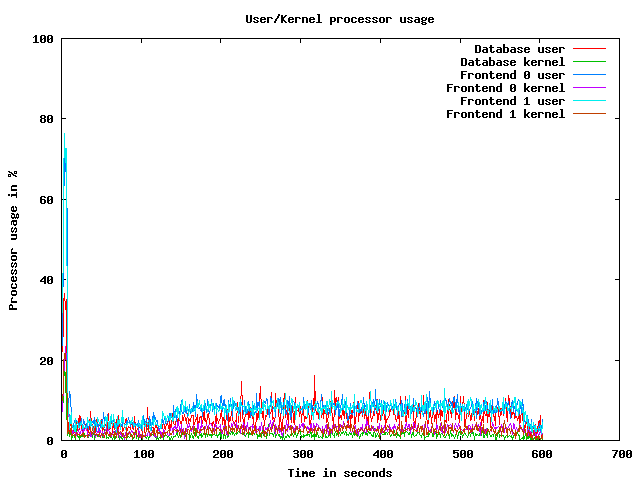
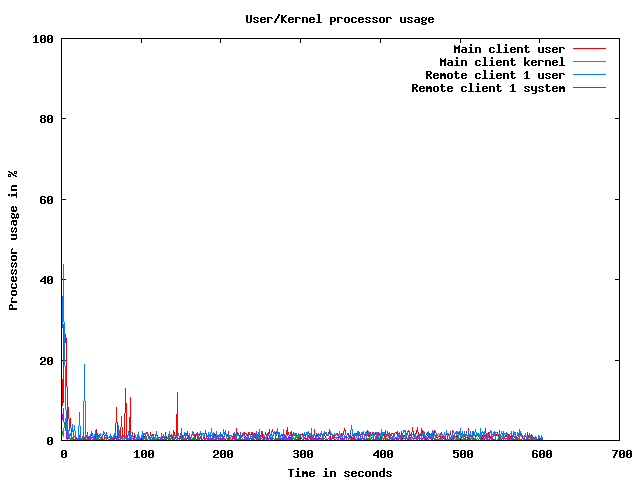
CPU usage graphs
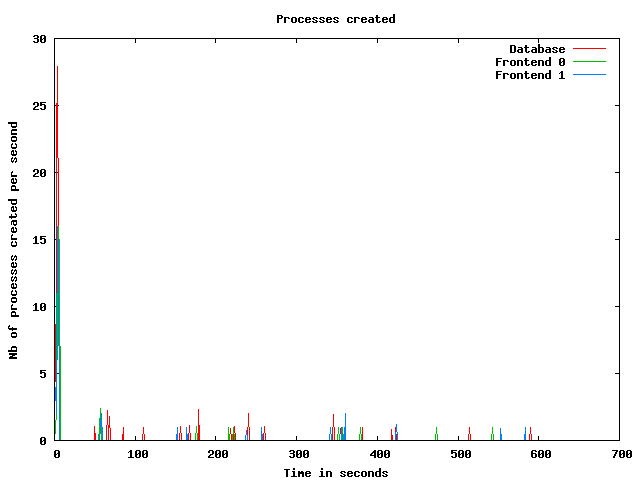
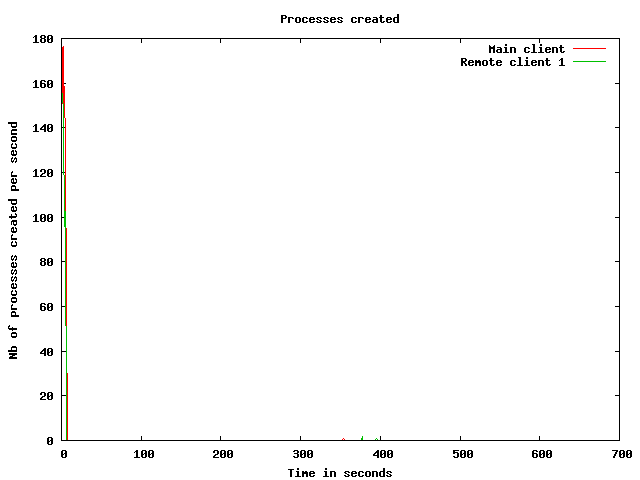
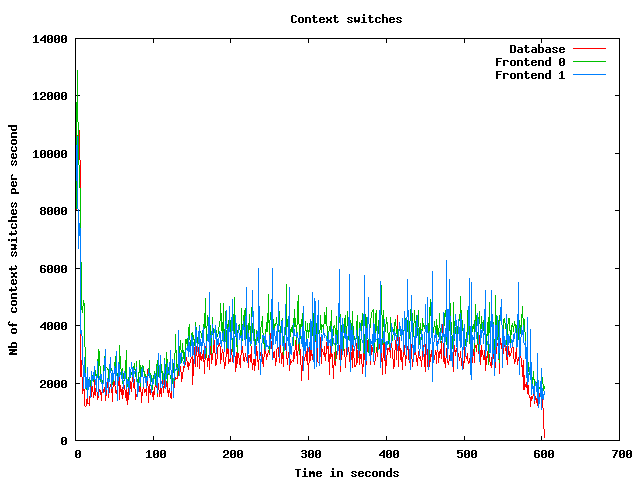
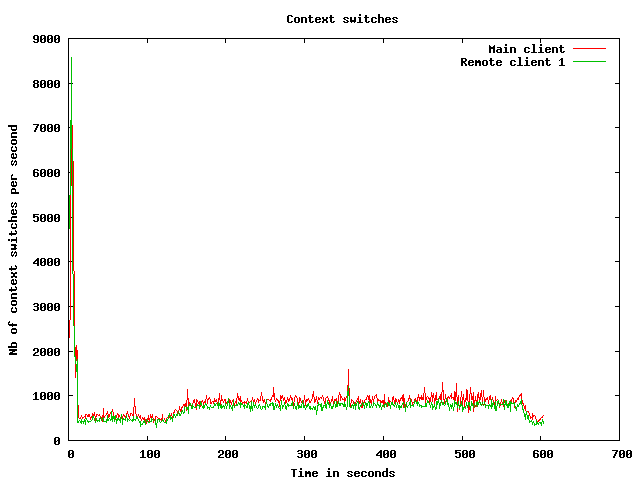
Processes usage graphs
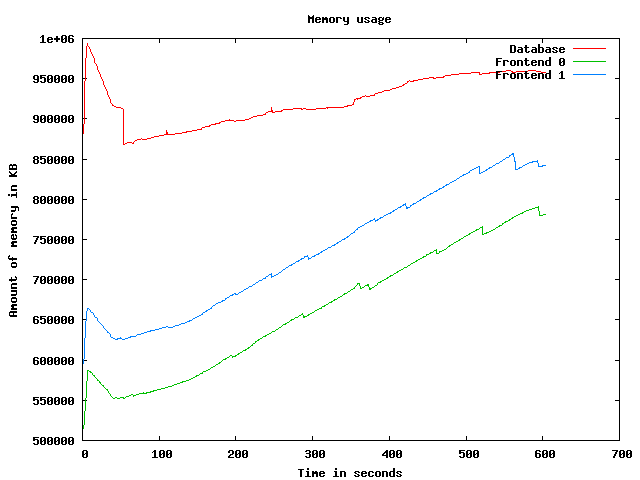
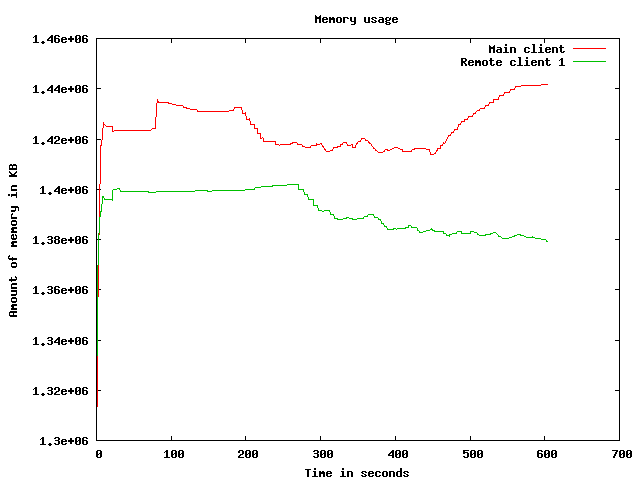
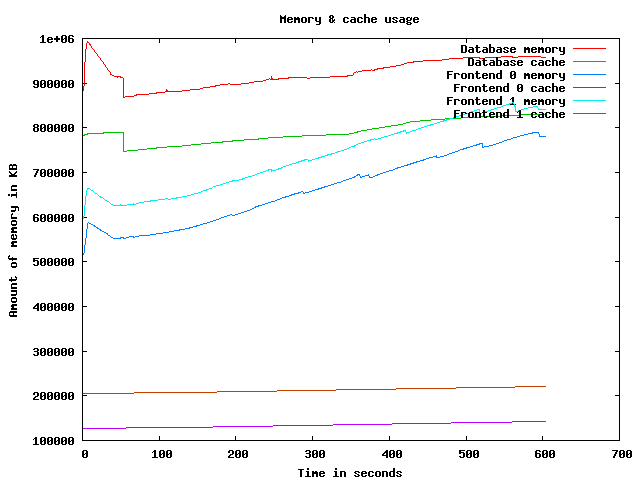
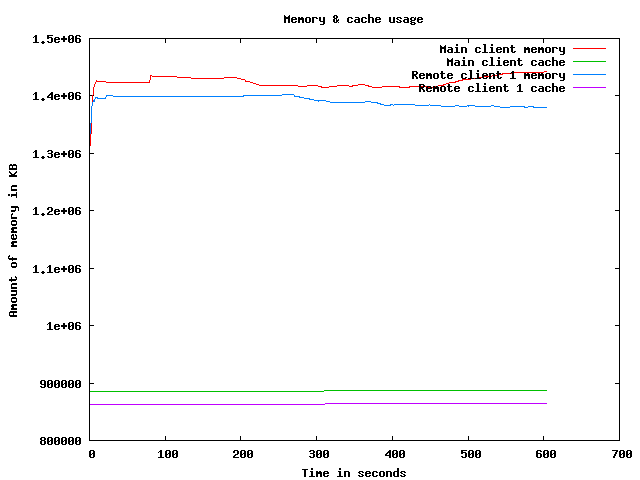
Memory usage graph
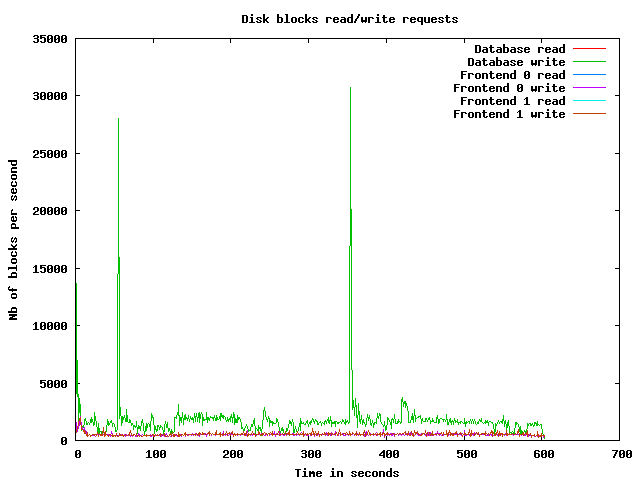
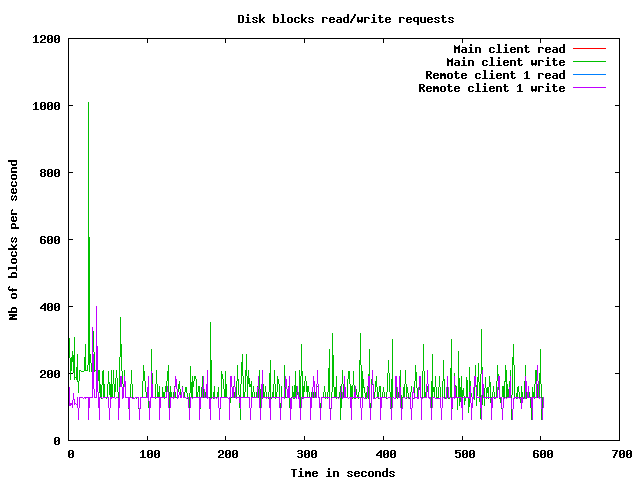
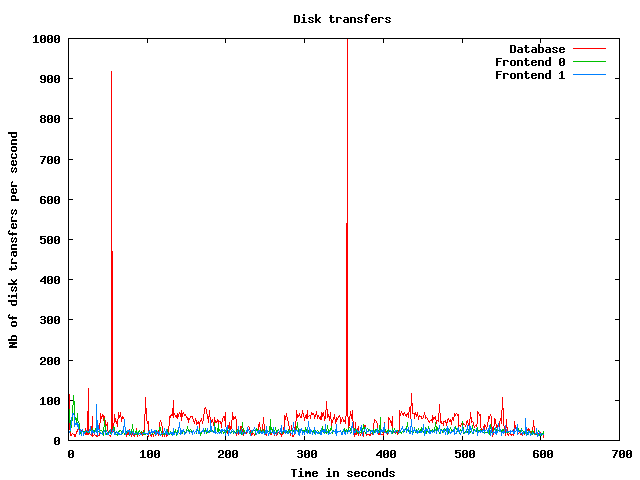
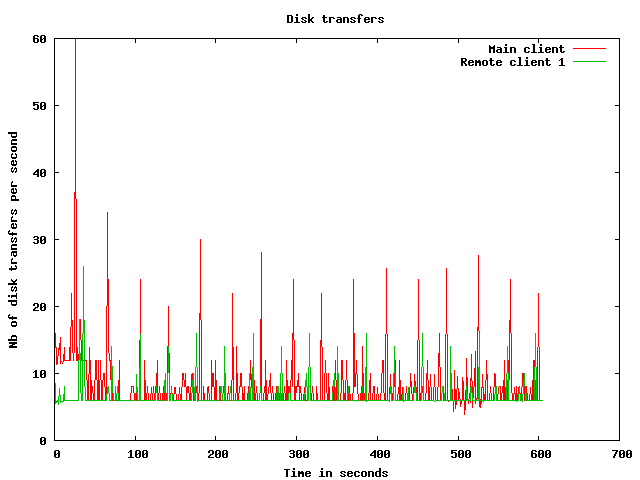
Disk usage graphs
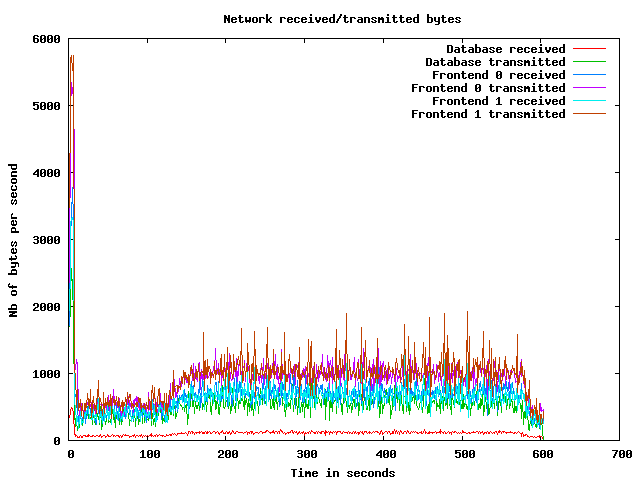
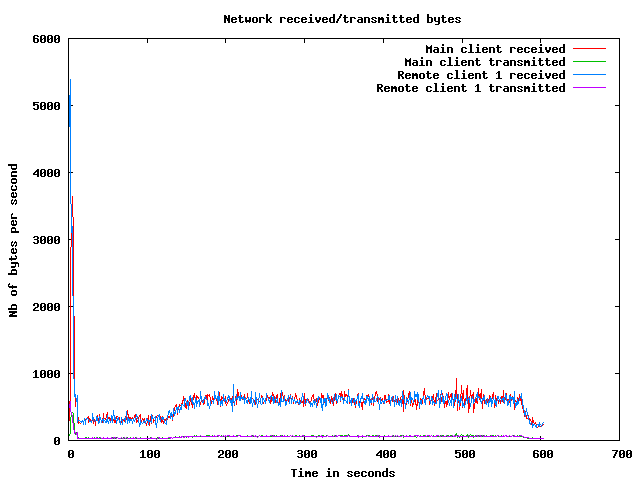
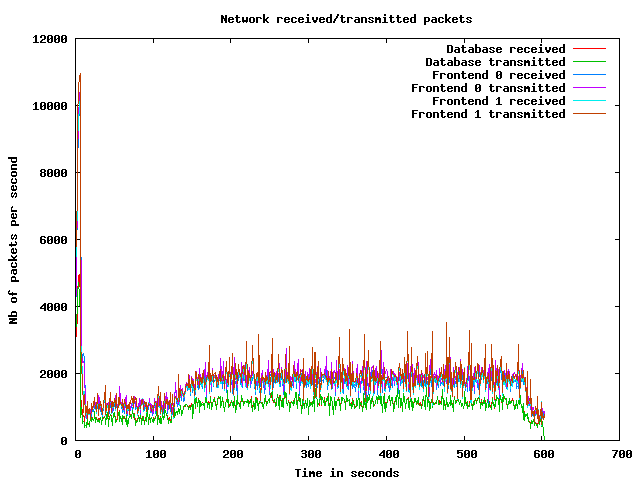
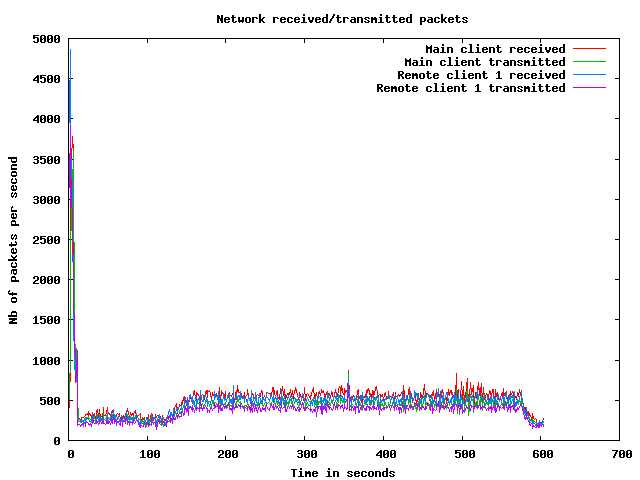
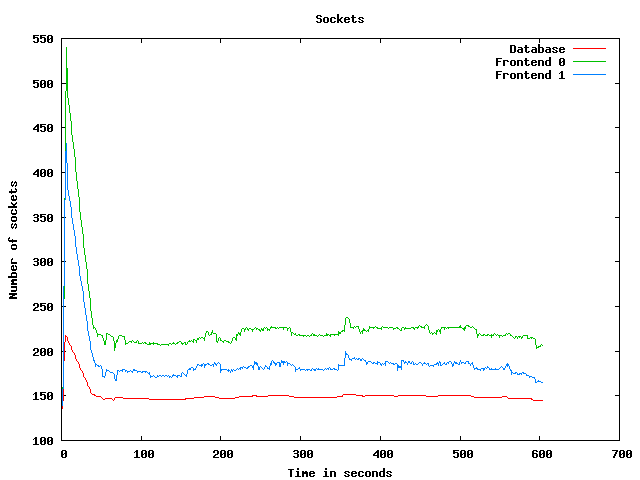
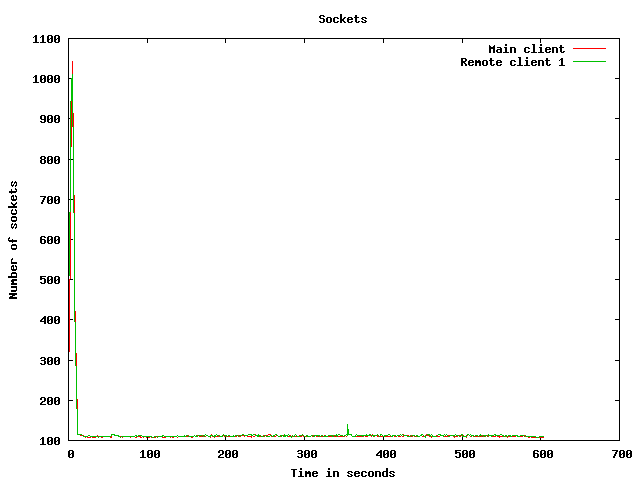
Network usage graphs
| Test start | 2009-3-19 14:8:24 |
| Up ramp start | 2009-3-19 14:8:31 |
| Runtime session start | 2009-3-19 14:10:31 |
| Down ramp start | 2009-3-19 14:18:1 |
| Test end | 2009-3-19 14:20:15 |
| Up ramp length | 2 minutes 1 millisecond (requested 120000 ms) |
| Runtime session length | 7 minutes 30 seconds 0 millisecond (requested 450000 ms) |
| Down ramp length | 30 seconds 0 millisecond (requested 30000 ms) |
| Total test length | 11 minutes 51 seconds 627 milliseconds |
| State name | % of total | Count | Errors | Minimum Time | Maximum Time | Average Time |
|---|---|---|---|---|---|---|
Home | 10 % | 1555 | 0 | 0 ms | 9103 ms | 1513 ms
|
Register | 1 % | 200 | 0 | 0 ms | 9104 ms | 570 ms
|
RegisterUser | 1 % | 190 | 2 | 5 ms | 9019 ms | 215 ms
|
Browse | 9 % | 1521 | 0 | 0 ms | 9097 ms | 514 ms
|
BrowseCategories | 6 % | 993 | 0 | 3 ms | 9111 ms | 389 ms
|
SearchItemsInCategory | 14 % | 2183 | 0 | 0 ms | 9010 ms | 185 ms
|
BrowseRegions | 2 % | 430 | 0 | 3 ms | 9101 ms | 301 ms
|
BrowseCategoriesInRegion | 2 % | 401 | 0 | 3 ms | 9008 ms | 251 ms
|
SearchItemsInRegion | 4 % | 762 | 0 | 0 ms | 9000 ms | 121 ms
|
ViewItem | 12 % | 1885 | 0 | 3 ms | 9021 ms | 147 ms
|
ViewUserInfo | 2 % | 344 | 0 | 3 ms | 9111 ms | 94 ms
|
ViewBidHistory | 1 % | 158 | 0 | 3 ms | 3033 ms | 86 ms
|
BuyNowAuth | 0 % | 143 | 0 | 2 ms | 9111 ms | 203 ms
|
BuyNow | 0 % | 120 | 21 | 4 ms | 3137 ms | 125 ms
|
StoreBuyBow | 0 % | 88 | 0 | 4 ms | 1155 ms | 33 ms
|
PutBidAuth | 4 % | 661 | 0 | 0 ms | 8998 ms | 126 ms
|
PutBid | 4 % | 628 | 83 | 4 ms | 3280 ms | 95 ms
|
StoreBid | 2 % | 370 | 0 | 4 ms | 3092 ms | 94 ms
|
PutCommentAuth | 0 % | 0 | 0 | 0 ms | 0 ms | 0 ms
|
PutComment | 0 % | 57 | 3 | 3 ms | 4353 ms | 209 ms
|
StoreComment | 0 % | 45 | 0 | 5 ms | 2999 ms | 73 ms
|
Sell | 0 % | 119 | 0 | 0 ms | 9000 ms | 489 ms
|
SelectCategoryToSellItem | 0 % | 110 | 0 | 3 ms | 9002 ms | 233 ms
|
SellItemForm | 0 % | 101 | 0 | 2 ms | 9004 ms | 272 ms
|
RegisterItem | 0 % | 90 | 0 | 4 ms | 3010 ms | 59 ms
|
AboutMe (auth form) | 2 % | 349 | 0 | 0 ms | 9105 ms | 516 ms
|
AboutMe | 3 % | 502 | 0 | 4 ms | 9014 ms | 174 ms
|
Back probability | 7 % | 1139 | 0 | 0 ms | 0 ms | 0 ms
|
End of Session | 1 % | 165 | 0 | 0 ms | 0 ms | 0 ms
|
Total | 100 % | 15309 | 109 | - | - | 347 ms
|
Average throughput | 128 req/s
| |||||
Completed sessions | 148
| |||||
Total time | 8038 seconds
| |||||
Average session time | 54 seconds
| |||||
| State name | % of total | Count | Errors | Minimum Time | Maximum Time | Average Time |
|---|---|---|---|---|---|---|
Home | 4 % | 3674 | 0 | 0 ms | 606 ms | 0 ms
|
Register | 1 % | 796 | 0 | 0 ms | 18 ms | 0 ms
|
RegisterUser | 1 % | 781 | 1 | 5 ms | 620 ms | 10 ms
|
Browse | 7 % | 5428 | 0 | 0 ms | 601 ms | 1 ms
|
BrowseCategories | 5 % | 3760 | 0 | 3 ms | 297 ms | 5 ms
|
SearchItemsInCategory | 15 % | 11392 | 0 | 0 ms | 589 ms | 5 ms
|
BrowseRegions | 2 % | 1594 | 0 | 3 ms | 249 ms | 5 ms
|
BrowseCategoriesInRegion | 2 % | 1575 | 0 | 3 ms | 612 ms | 5 ms
|
SearchItemsInRegion | 5 % | 3782 | 0 | 0 ms | 277 ms | 11 ms
|
ViewItem | 14 % | 10581 | 0 | 3 ms | 652 ms | 9 ms
|
ViewUserInfo | 3 % | 2398 | 0 | 3 ms | 615 ms | 7 ms
|
ViewBidHistory | 1 % | 1231 | 0 | 3 ms | 344 ms | 17 ms
|
BuyNowAuth | 1 % | 986 | 0 | 2 ms | 17 ms | 3 ms
|
BuyNow | 1 % | 978 | 156 | 3 ms | 248 ms | 8 ms
|
StoreBuyBow | 1 % | 804 | 0 | 4 ms | 490 ms | 8 ms
|
PutBidAuth | 4 % | 3614 | 0 | 0 ms | 615 ms | 3 ms
|
PutBid | 5 % | 4089 | 512 | 3 ms | 618 ms | 9 ms
|
StoreBid | 3 % | 2626 | 0 | 4 ms | 525 ms | 8 ms
|
PutCommentAuth | 0 % | 0 | 0 | 0 ms | 0 ms | 0 ms
|
PutComment | 0 % | 341 | 31 | 3 ms | 37 ms | 7 ms
|
StoreComment | 0 % | 312 | 0 | 4 ms | 677 ms | 9 ms
|
Sell | 0 % | 405 | 0 | 0 ms | 15 ms | 0 ms
|
SelectCategoryToSellItem | 0 % | 403 | 0 | 3 ms | 28 ms | 6 ms
|
SellItemForm | 0 % | 395 | 0 | 2 ms | 13 ms | 3 ms
|
RegisterItem | 0 % | 387 | 0 | 4 ms | 692 ms | 10 ms
|
AboutMe (auth form) | 1 % | 1299 | 0 | 0 ms | 114 ms | 0 ms
|
AboutMe | 2 % | 2200 | 0 | 3 ms | 759 ms | 21 ms
|
Back probability | 10 % | 7524 | 0 | 0 ms | 0 ms | 0 ms
|
End of Session | 1 % | 1078 | 0 | 0 ms | 0 ms | 0 ms
|
Total | 100 % | 74433 | 700 | - | - | 6 ms
|
Average throughput | 166 req/s
| |||||
Completed sessions | 1083
| |||||
Total time | 263537 seconds
| |||||
Average session time | 243 seconds
| |||||
| State name | % of total | Count | Errors | Minimum Time | Maximum Time | Average Time |
|---|---|---|---|---|---|---|
Home | 4 % | 108 | 0 | 0 ms | 2 ms | 0 ms
|
Register | 1 % | 35 | 0 | 0 ms | 3 ms | 0 ms
|
RegisterUser | 1 % | 27 | 0 | 5 ms | 21 ms | 7 ms
|
Browse | 7 % | 175 | 0 | 0 ms | 3 ms | 0 ms
|
BrowseCategories | 5 % | 121 | 0 | 3 ms | 17 ms | 4 ms
|
SearchItemsInCategory | 15 % | 380 | 0 | 0 ms | 23 ms | 5 ms
|
BrowseRegions | 2 % | 52 | 0 | 3 ms | 9 ms | 4 ms
|
BrowseCategoriesInRegion | 2 % | 58 | 0 | 3 ms | 10 ms | 4 ms
|
SearchItemsInRegion | 4 % | 120 | 0 | 0 ms | 82 ms | 12 ms
|
ViewItem | 13 % | 335 | 0 | 3 ms | 73 ms | 7 ms
|
ViewUserInfo | 3 % | 75 | 0 | 3 ms | 13 ms | 6 ms
|
ViewBidHistory | 1 % | 38 | 0 | 4 ms | 38 ms | 19 ms
|
BuyNowAuth | 1 % | 27 | 0 | 2 ms | 11 ms | 2 ms
|
BuyNow | 0 % | 24 | 1 | 5 ms | 16 ms | 8 ms
|
StoreBuyBow | 1 % | 28 | 0 | 4 ms | 10 ms | 6 ms
|
PutBidAuth | 4 % | 120 | 0 | 0 ms | 7 ms | 2 ms
|
PutBid | 5 % | 123 | 16 | 3 ms | 22 ms | 7 ms
|
StoreBid | 3 % | 77 | 0 | 4 ms | 21 ms | 8 ms
|
PutCommentAuth | 0 % | 0 | 0 | 0 ms | 0 ms | 0 ms
|
PutComment | 0 % | 9 | 0 | 5 ms | 11 ms | 6 ms
|
StoreComment | 0 % | 8 | 0 | 5 ms | 7 ms | 6 ms
|
Sell | 0 % | 15 | 0 | 0 ms | 1 ms | 0 ms
|
SelectCategoryToSellItem | 0 % | 13 | 0 | 4 ms | 11 ms | 9 ms
|
SellItemForm | 0 % | 22 | 0 | 2 ms | 4 ms | 2 ms
|
RegisterItem | 0 % | 17 | 0 | 5 ms | 9 ms | 3 ms
|
AboutMe (auth form) | 1 % | 47 | 0 | 0 ms | 2 ms | 0 ms
|
AboutMe | 3 % | 80 | 0 | 4 ms | 38 ms | 15 ms
|
Back probability | 9 % | 241 | 0 | 0 ms | 0 ms | 0 ms
|
End of Session | 1 % | 37 | 0 | 0 ms | 0 ms | 0 ms
|
Total | 100 % | 2412 | 17 | - | - | 5 ms
|
Average throughput | 80 req/s
| |||||
Completed sessions | 28
| |||||
Total time | 12084 seconds
| |||||
Average session time | 431 seconds
| |||||
| State name | % of total | Count | Errors | Minimum Time | Maximum Time | Average Time |
|---|---|---|---|---|---|---|
Home | 5 % | 5337 | 0 | 0 ms | 9103 ms | 441 ms
|
Register | 1 % | 1031 | 0 | 0 ms | 9104 ms | 111 ms
|
RegisterUser | 1 % | 998 | 3 | 5 ms | 9019 ms | 49 ms
|
Browse | 7 % | 7124 | 0 | 0 ms | 9097 ms | 110 ms
|
BrowseCategories | 5 % | 4874 | 0 | 3 ms | 9111 ms | 83 ms
|
SearchItemsInCategory | 15 % | 14000 | 0 | 0 ms | 9010 ms | 33 ms
|
BrowseRegions | 2 % | 2076 | 0 | 3 ms | 9101 ms | 66 ms
|
BrowseCategoriesInRegion | 2 % | 2034 | 0 | 3 ms | 9008 ms | 54 ms
|
SearchItemsInRegion | 5 % | 4675 | 0 | 0 ms | 9000 ms | 29 ms
|
ViewItem | 13 % | 12825 | 0 | 3 ms | 9021 ms | 29 ms
|
ViewUserInfo | 3 % | 2830 | 0 | 3 ms | 9111 ms | 18 ms
|
ViewBidHistory | 1 % | 1430 | 0 | 3 ms | 3033 ms | 25 ms
|
BuyNowAuth | 1 % | 1156 | 0 | 2 ms | 9111 ms | 28 ms
|
BuyNow | 1 % | 1122 | 178 | 3 ms | 3137 ms | 20 ms
|
StoreBuyBow | 0 % | 920 | 0 | 4 ms | 1155 ms | 10 ms
|
PutBidAuth | 4 % | 4395 | 0 | 0 ms | 8998 ms | 22 ms
|
PutBid | 5 % | 4851 | 611 | 3 ms | 3280 ms | 20 ms
|
StoreBid | 3 % | 3073 | 0 | 4 ms | 3092 ms | 18 ms
|
PutCommentAuth | 0 % | 0 | 0 | 0 ms | 0 ms | 0 ms
|
PutComment | 0 % | 407 | 34 | 3 ms | 4353 ms | 35 ms
|
StoreComment | 0 % | 365 | 0 | 4 ms | 2999 ms | 17 ms
|
Sell | 0 % | 539 | 0 | 0 ms | 9000 ms | 108 ms
|
SelectCategoryToSellItem | 0 % | 526 | 0 | 3 ms | 9002 ms | 54 ms
|
SellItemForm | 0 % | 518 | 0 | 2 ms | 9004 ms | 55 ms
|
RegisterItem | 0 % | 494 | 0 | 4 ms | 3010 ms | 19 ms
|
AboutMe (auth form) | 1 % | 1695 | 0 | 0 ms | 9105 ms | 107 ms
|
AboutMe | 3 % | 2797 | 0 | 3 ms | 9014 ms | 48 ms
|
Back probability | 9 % | 8904 | 0 | 0 ms | 0 ms | 0 ms
|
End of Session | 1 % | 1280 | 0 | 0 ms | 0 ms | 0 ms
|
Total | 100 % | 92276 | 826 | - | - | 62 ms
|
Average throughput | 155 req/s
| |||||
Completed sessions | 1280
| |||||
Total time | 291115 seconds
| |||||
Average session time | 227 seconds
| |||||
An error occured while waiting for remote processes termination (Skipping waits)
Command is: /usr/bin/scp farm6.csail.mit.edu:/tmp/client1 /home/drkp/sandbox/txcache/src/RUBiS-1.4.3/bench/2009-3-19@14:8:24//client1.bin
Command is: /usr/bin/ssh -x localhost /bin/bash -c 'LANG=en_GB.UTF-8 /usr/bin/sar -n DEV -n SOCK -rubcw 1 605 -f /home/drkp/sandbox/txcache/src/RUBiS-1.4.3/bench/2009-3-19@14:8:24//client1.bin > /home/drkp/sandbox/txcache/src/RUBiS-1.4.3/bench/2009-3-19@14:8:24//client1'
Command is: /usr/bin/scp farm14:/tmp/db_server0 /home/drkp/sandbox/txcache/src/RUBiS-1.4.3/bench/2009-3-19@14:8:24//db_server0.bin
Command is: /usr/bin/ssh -x localhost /bin/bash -c 'LANG=en_GB.UTF-8 /usr/bin/sar -n DEV -n SOCK -rubcw 1 605 -f /home/drkp/sandbox/txcache/src/RUBiS-1.4.3/bench/2009-3-19@14:8:24//db_server0.bin > /home/drkp/sandbox/txcache/src/RUBiS-1.4.3/bench/2009-3-19@14:8:24//db_server0'
Command is: /usr/bin/scp farm12.csail.mit.edu:/tmp/web_server0 /home/drkp/sandbox/txcache/src/RUBiS-1.4.3/bench/2009-3-19@14:8:24//web_server0.bin
Command is: /usr/bin/ssh -x localhost /bin/bash -c 'LANG=en_GB.UTF-8 /usr/bin/sar -n DEV -n SOCK -rubcw 1 605 -f /home/drkp/sandbox/txcache/src/RUBiS-1.4.3/bench/2009-3-19@14:8:24//web_server0.bin > /home/drkp/sandbox/txcache/src/RUBiS-1.4.3/bench/2009-3-19@14:8:24//web_server0'
Command is: /usr/bin/scp farm13.csail.mit.edu:/tmp/web_server1 /home/drkp/sandbox/txcache/src/RUBiS-1.4.3/bench/2009-3-19@14:8:24//web_server1.bin
Command is: /usr/bin/ssh -x localhost /bin/bash -c 'LANG=en_GB.UTF-8 /usr/bin/sar -n DEV -n SOCK -rubcw 1 605 -f /home/drkp/sandbox/txcache/src/RUBiS-1.4.3/bench/2009-3-19@14:8:24//web_server1.bin > /home/drkp/sandbox/txcache/src/RUBiS-1.4.3/bench/2009-3-19@14:8:24//web_server1'
Command is: /usr/bin/scp localhost:/tmp/client0 /home/drkp/sandbox/txcache/src/RUBiS-1.4.3/bench/2009-3-19@14:8:24//client0.bin
Command is: /usr/bin/ssh -x localhost /bin/bash -c 'LANG=en_GB.UTF-8 /usr/bin/sar -n DEV -n SOCK -rubcw 1 605 -f /home/drkp/sandbox/txcache/src/RUBiS-1.4.3/bench/2009-3-19@14:8:24//client0.bin > /home/drkp/sandbox/txcache/src/RUBiS-1.4.3/bench/2009-3-19@14:8:24//client0'
Command is: /usr/bin/scp farm6.csail.mit.edu:/tmp/trace_client1.html /home/drkp/sandbox/txcache/src/RUBiS-1.4.3/bench/2009-3-19@14:8:24//
Command is: /usr/bin/scp farm6.csail.mit.edu:/tmp/stat_client1.html /home/drkp/sandbox/txcache/src/RUBiS-1.4.3/bench/2009-3-19@14:8:24//
|
|
|
|
|
|
 | 
|
 | 
|
 | 
|
 | 
|
 | 
|
 | 
|
 | 
|
 | 
|
 | 
|