Node information
Test timing information
Up ramp statistics
Runtime session statistics
Down ramp statistics
Overall statistics
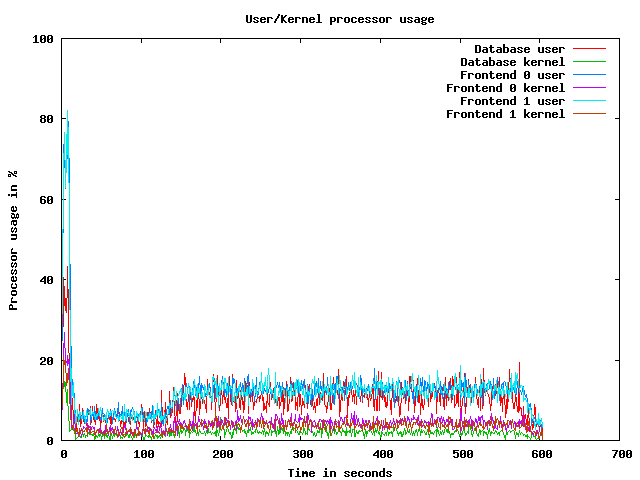
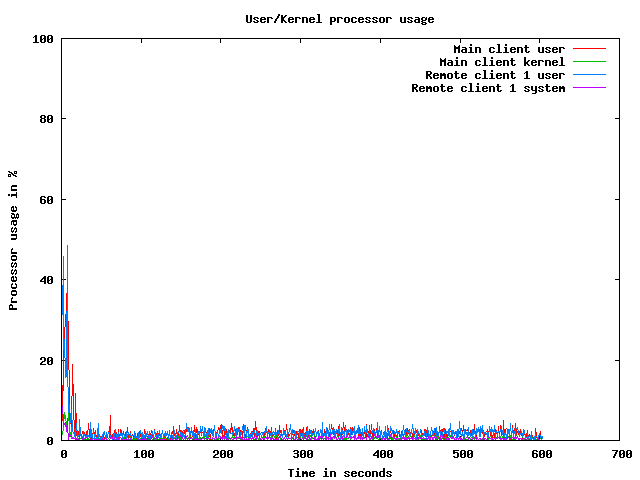
CPU usage graphs
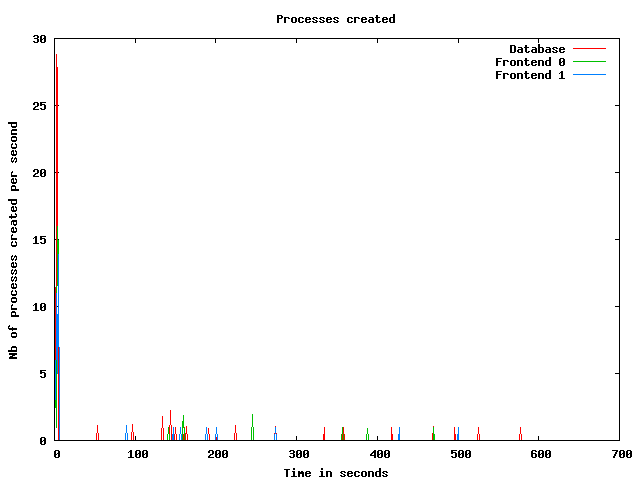
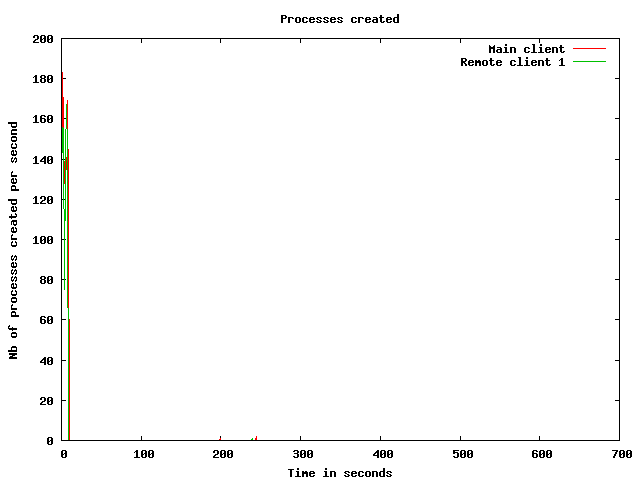
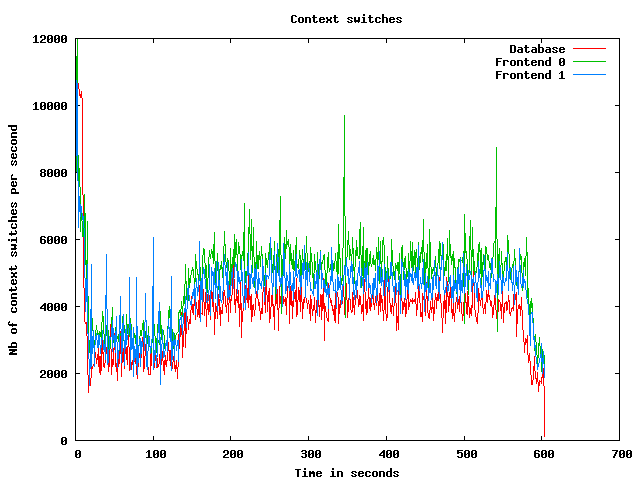
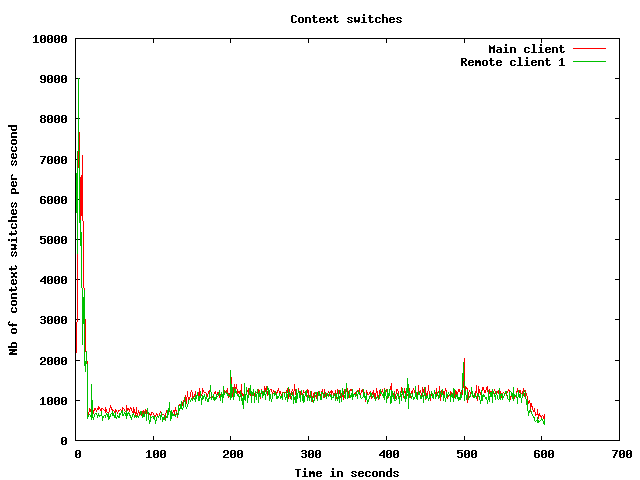
Processes usage graphs
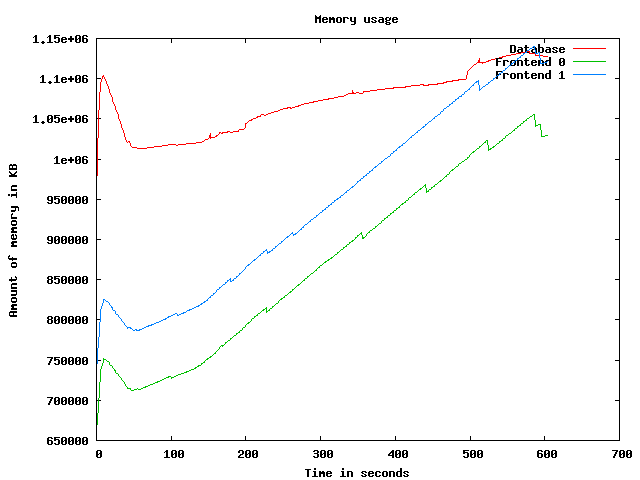
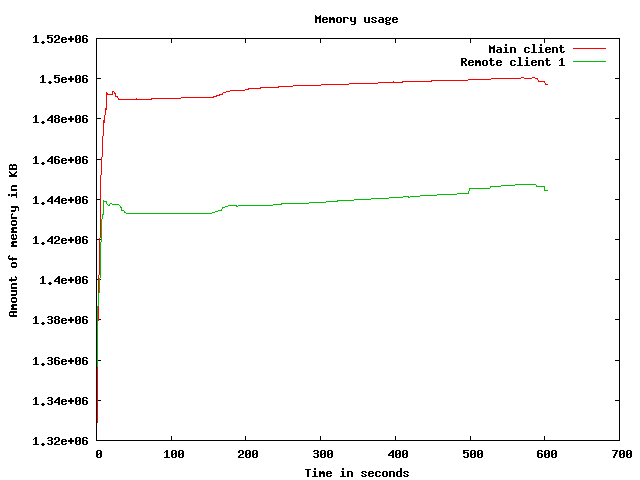
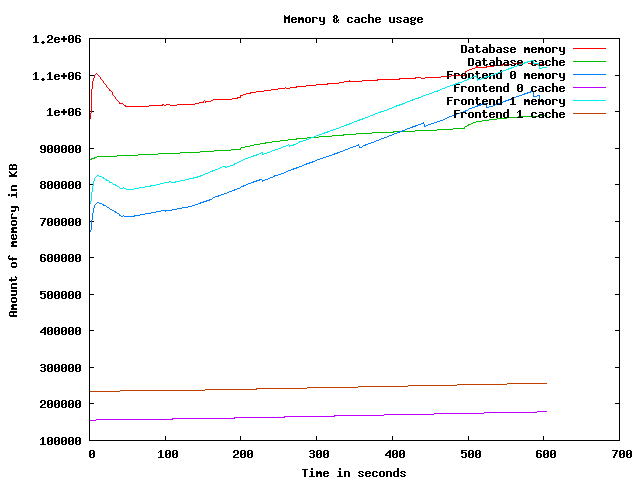
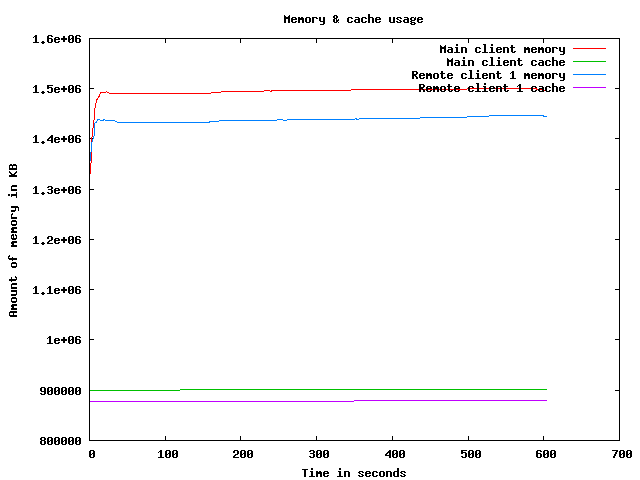
Memory usage graph
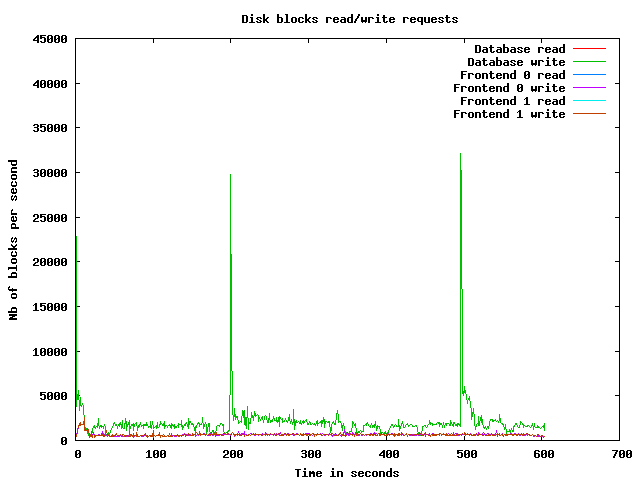
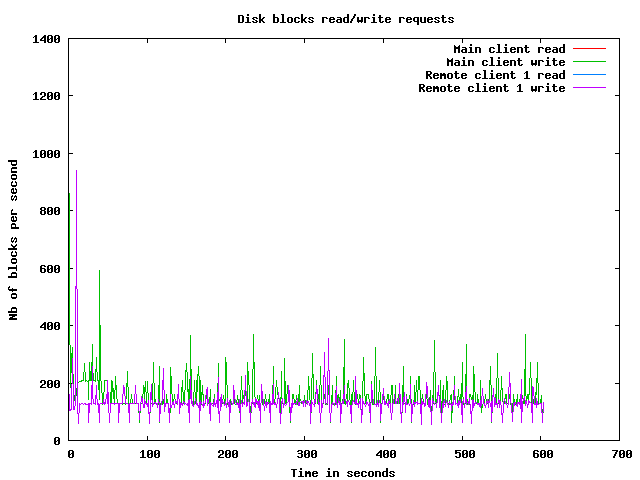
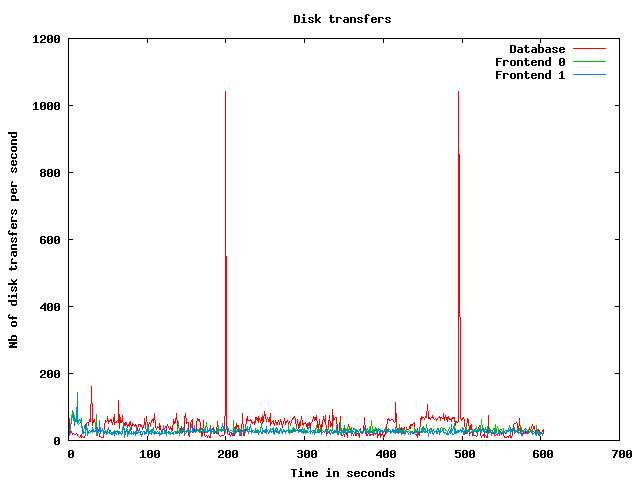
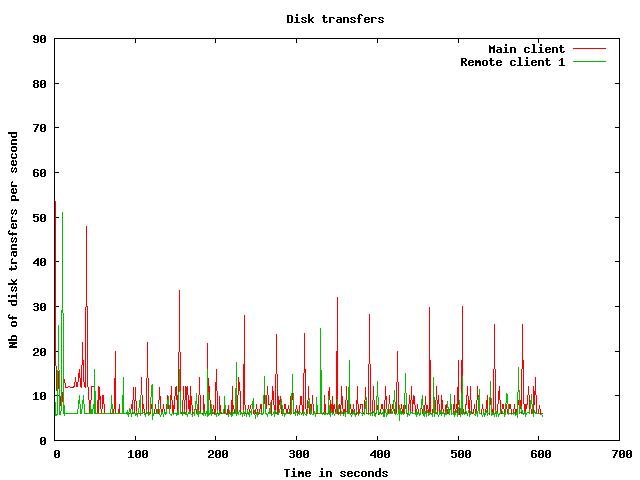
Disk usage graphs
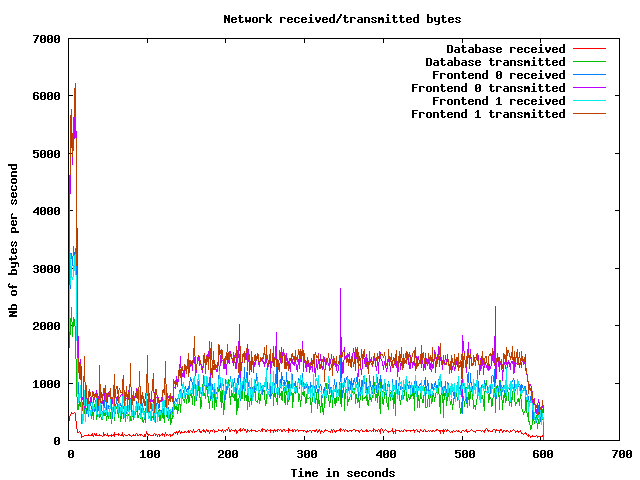
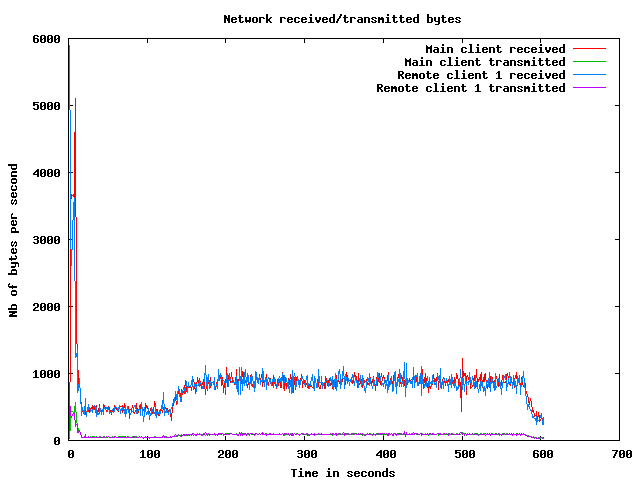
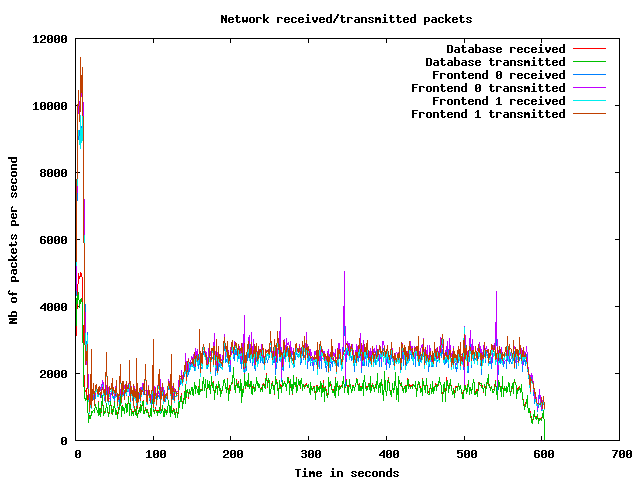
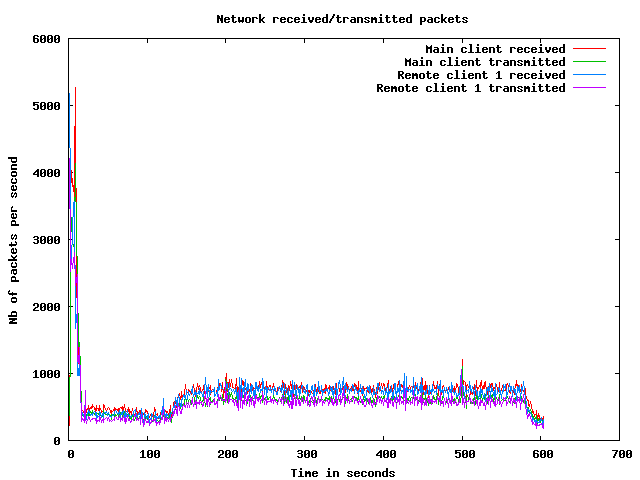
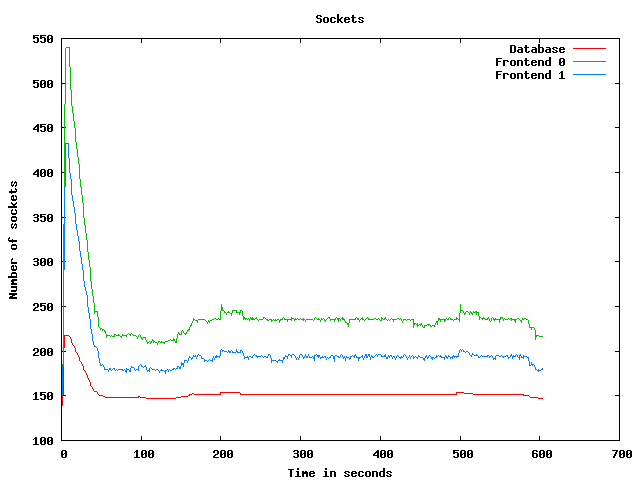
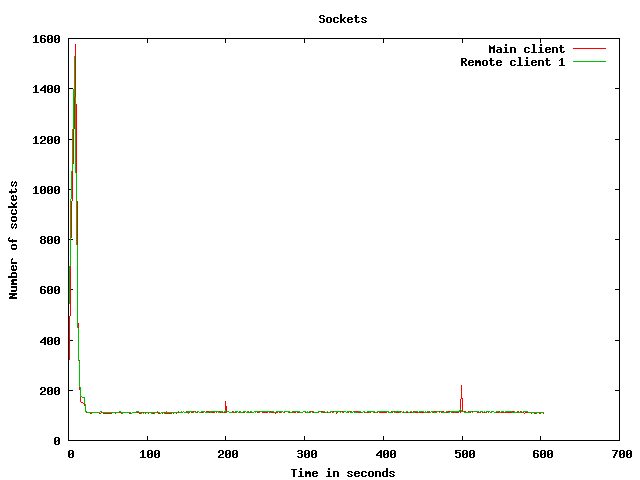
Network usage graphs
| Test start | 2009-3-19 14:20:59 |
| Up ramp start | 2009-3-19 14:21:11 |
| Runtime session start | 2009-3-19 14:23:11 |
| Down ramp start | 2009-3-19 14:30:41 |
| Test end | 2009-3-19 14:32:54 |
| Up ramp length | 2 minutes 0 millisecond (requested 120000 ms) |
| Runtime session length | 7 minutes 30 seconds 1 millisecond (requested 450000 ms) |
| Down ramp length | 30 seconds 0 millisecond (requested 30000 ms) |
| Total test length | 11 minutes 54 seconds 573 milliseconds |
| State name | % of total | Count | Errors | Minimum Time | Maximum Time | Average Time |
|---|---|---|---|---|---|---|
Home | 9 % | 2551 | 0 | 0 ms | 21008 ms | 1634 ms
|
Register | 1 % | 367 | 0 | 0 ms | 9064 ms | 601 ms
|
RegisterUser | 1 % | 350 | 1 | 5 ms | 9031 ms | 397 ms
|
Browse | 9 % | 2510 | 0 | 0 ms | 9195 ms | 431 ms
|
BrowseCategories | 6 % | 1670 | 0 | 3 ms | 9162 ms | 412 ms
|
SearchItemsInCategory | 14 % | 3834 | 0 | 0 ms | 9183 ms | 295 ms
|
BrowseRegions | 2 % | 697 | 0 | 3 ms | 9135 ms | 536 ms
|
BrowseCategoriesInRegion | 2 % | 648 | 0 | 3 ms | 9197 ms | 375 ms
|
SearchItemsInRegion | 4 % | 1283 | 0 | 0 ms | 9137 ms | 268 ms
|
ViewItem | 12 % | 3278 | 0 | 3 ms | 9202 ms | 248 ms
|
ViewUserInfo | 2 % | 590 | 0 | 3 ms | 9030 ms | 216 ms
|
ViewBidHistory | 1 % | 313 | 0 | 3 ms | 9029 ms | 133 ms
|
BuyNowAuth | 1 % | 266 | 0 | 2 ms | 9085 ms | 360 ms
|
BuyNow | 0 % | 242 | 42 | 4 ms | 9016 ms | 246 ms
|
StoreBuyBow | 0 % | 181 | 0 | 4 ms | 9011 ms | 319 ms
|
PutBidAuth | 4 % | 1134 | 0 | 0 ms | 9020 ms | 260 ms
|
PutBid | 4 % | 1119 | 153 | 4 ms | 9042 ms | 198 ms
|
StoreBid | 2 % | 615 | 0 | 4 ms | 9027 ms | 211 ms
|
PutCommentAuth | 0 % | 0 | 0 | 0 ms | 0 ms | 0 ms
|
PutComment | 0 % | 89 | 13 | 3 ms | 9008 ms | 232 ms
|
StoreComment | 0 % | 68 | 0 | 4 ms | 9006 ms | 155 ms
|
Sell | 0 % | 190 | 0 | 0 ms | 9135 ms | 554 ms
|
SelectCategoryToSellItem | 0 % | 169 | 0 | 3 ms | 9006 ms | 341 ms
|
SellItemForm | 0 % | 157 | 0 | 2 ms | 9005 ms | 236 ms
|
RegisterItem | 0 % | 147 | 0 | 4 ms | 9011 ms | 505 ms
|
AboutMe (auth form) | 2 % | 574 | 0 | 0 ms | 9020 ms | 382 ms
|
AboutMe | 3 % | 821 | 0 | 4 ms | 9235 ms | 379 ms
|
Back probability | 7 % | 2011 | 0 | 0 ms | 0 ms | 0 ms
|
End of Session | 1 % | 292 | 0 | 0 ms | 0 ms | 0 ms
|
Total | 100 % | 26166 | 209 | - | - | 420 ms
|
Average throughput | 219 req/s
| |||||
Completed sessions | 259
| |||||
Total time | 11472 seconds
| |||||
Average session time | 44 seconds
| |||||
| State name | % of total | Count | Errors | Minimum Time | Maximum Time | Average Time |
|---|---|---|---|---|---|---|
Home | 4 % | 5306 | 0 | 0 ms | 527 ms | 0 ms
|
Register | 1 % | 1149 | 0 | 0 ms | 477 ms | 1 ms
|
RegisterUser | 1 % | 1115 | 11 | 4 ms | 829 ms | 13 ms
|
Browse | 7 % | 8103 | 0 | 0 ms | 492 ms | 1 ms
|
BrowseCategories | 5 % | 5701 | 0 | 3 ms | 505 ms | 6 ms
|
SearchItemsInCategory | 15 % | 17731 | 0 | 0 ms | 588 ms | 7 ms
|
BrowseRegions | 2 % | 2316 | 0 | 3 ms | 519 ms | 7 ms
|
BrowseCategoriesInRegion | 2 % | 2280 | 0 | 3 ms | 527 ms | 6 ms
|
SearchItemsInRegion | 4 % | 5527 | 0 | 0 ms | 687 ms | 15 ms
|
ViewItem | 14 % | 15670 | 0 | 3 ms | 895 ms | 11 ms
|
ViewUserInfo | 3 % | 3464 | 0 | 3 ms | 481 ms | 9 ms
|
ViewBidHistory | 1 % | 1881 | 0 | 3 ms | 644 ms | 20 ms
|
BuyNowAuth | 1 % | 1448 | 0 | 2 ms | 528 ms | 4 ms
|
BuyNow | 1 % | 1425 | 217 | 3 ms | 530 ms | 10 ms
|
StoreBuyBow | 1 % | 1170 | 0 | 4 ms | 839 ms | 11 ms
|
PutBidAuth | 4 % | 5447 | 0 | 0 ms | 480 ms | 4 ms
|
PutBid | 5 % | 6225 | 765 | 3 ms | 592 ms | 11 ms
|
StoreBid | 3 % | 4036 | 0 | 4 ms | 886 ms | 10 ms
|
PutCommentAuth | 0 % | 0 | 0 | 0 ms | 0 ms | 0 ms
|
PutComment | 0 % | 507 | 42 | 3 ms | 421 ms | 9 ms
|
StoreComment | 0 % | 460 | 0 | 4 ms | 670 ms | 11 ms
|
Sell | 0 % | 665 | 0 | 0 ms | 426 ms | 2 ms
|
SelectCategoryToSellItem | 0 % | 656 | 0 | 3 ms | 474 ms | 9 ms
|
SellItemForm | 0 % | 643 | 0 | 2 ms | 274 ms | 4 ms
|
RegisterItem | 0 % | 629 | 0 | 4 ms | 944 ms | 12 ms
|
AboutMe (auth form) | 1 % | 1855 | 0 | 0 ms | 519 ms | 2 ms
|
AboutMe | 2 % | 3077 | 0 | 4 ms | 437 ms | 23 ms
|
Back probability | 10 % | 11331 | 0 | 0 ms | 0 ms | 0 ms
|
End of Session | 1 % | 1569 | 0 | 0 ms | 0 ms | 0 ms
|
Total | 100 % | 111386 | 1035 | - | - | 7 ms
|
Average throughput | 249 req/s
| |||||
Completed sessions | 1576
| |||||
Total time | 389893 seconds
| |||||
Average session time | 247 seconds
| |||||
| State name | % of total | Count | Errors | Minimum Time | Maximum Time | Average Time |
|---|---|---|---|---|---|---|
Home | 5 % | 210 | 0 | 0 ms | 3 ms | 0 ms
|
Register | 1 % | 40 | 0 | 0 ms | 11 ms | 0 ms
|
RegisterUser | 0 % | 33 | 0 | 5 ms | 34 ms | 8 ms
|
Browse | 7 % | 286 | 0 | 0 ms | 23 ms | 0 ms
|
BrowseCategories | 4 % | 164 | 0 | 3 ms | 18 ms | 4 ms
|
SearchItemsInCategory | 14 % | 538 | 0 | 0 ms | 37 ms | 6 ms
|
BrowseRegions | 2 % | 89 | 0 | 3 ms | 11 ms | 4 ms
|
BrowseCategoriesInRegion | 2 % | 81 | 0 | 3 ms | 16 ms | 5 ms
|
SearchItemsInRegion | 4 % | 174 | 0 | 0 ms | 135 ms | 10 ms
|
ViewItem | 13 % | 526 | 0 | 3 ms | 137 ms | 8 ms
|
ViewUserInfo | 3 % | 125 | 0 | 3 ms | 19 ms | 6 ms
|
ViewBidHistory | 1 % | 57 | 0 | 3 ms | 42 ms | 17 ms
|
BuyNowAuth | 1 % | 51 | 0 | 2 ms | 12 ms | 3 ms
|
BuyNow | 1 % | 46 | 5 | 4 ms | 20 ms | 9 ms
|
StoreBuyBow | 1 % | 52 | 0 | 4 ms | 15 ms | 5 ms
|
PutBidAuth | 4 % | 174 | 0 | 0 ms | 14 ms | 3 ms
|
PutBid | 5 % | 212 | 40 | 3 ms | 40 ms | 10 ms
|
StoreBid | 4 % | 161 | 0 | 4 ms | 30 ms | 6 ms
|
PutCommentAuth | 0 % | 0 | 0 | 0 ms | 0 ms | 0 ms
|
PutComment | 0 % | 23 | 1 | 4 ms | 12 ms | 4 ms
|
StoreComment | 0 % | 14 | 0 | 5 ms | 7 ms | 3 ms
|
Sell | 0 % | 20 | 0 | 0 ms | 1 ms | 0 ms
|
SelectCategoryToSellItem | 0 % | 21 | 0 | 4 ms | 13 ms | 5 ms
|
SellItemForm | 0 % | 19 | 0 | 2 ms | 5 ms | 4 ms
|
RegisterItem | 0 % | 28 | 0 | 4 ms | 18 ms | 6 ms
|
AboutMe (auth form) | 1 % | 64 | 0 | 0 ms | 5 ms | 0 ms
|
AboutMe | 2 % | 109 | 0 | 4 ms | 68 ms | 20 ms
|
Back probability | 10 % | 389 | 0 | 0 ms | 0 ms | 0 ms
|
End of Session | 1 % | 56 | 0 | 0 ms | 0 ms | 0 ms
|
Total | 100 % | 3762 | 46 | - | - | 5 ms
|
Average throughput | 126 req/s
| |||||
Completed sessions | 59
| |||||
Total time | 22527 seconds
| |||||
Average session time | 381 seconds
| |||||
| State name | % of total | Count | Errors | Minimum Time | Maximum Time | Average Time |
|---|---|---|---|---|---|---|
Home | 5 % | 8067 | 0 | 0 ms | 21008 ms | 517 ms
|
Register | 1 % | 1556 | 0 | 0 ms | 9064 ms | 143 ms
|
RegisterUser | 1 % | 1498 | 12 | 4 ms | 9031 ms | 102 ms
|
Browse | 7 % | 10899 | 0 | 0 ms | 9195 ms | 100 ms
|
BrowseCategories | 5 % | 7535 | 0 | 3 ms | 9162 ms | 96 ms
|
SearchItemsInCategory | 15 % | 22185 | 0 | 0 ms | 9183 ms | 57 ms
|
BrowseRegions | 2 % | 3102 | 0 | 3 ms | 9135 ms | 126 ms
|
BrowseCategoriesInRegion | 2 % | 3009 | 0 | 3 ms | 9197 ms | 86 ms
|
SearchItemsInRegion | 4 % | 6998 | 0 | 0 ms | 9137 ms | 61 ms
|
ViewItem | 13 % | 19510 | 0 | 3 ms | 9202 ms | 50 ms
|
ViewUserInfo | 2 % | 4185 | 0 | 3 ms | 9030 ms | 38 ms
|
ViewBidHistory | 1 % | 2258 | 0 | 3 ms | 9029 ms | 35 ms
|
BuyNowAuth | 1 % | 1765 | 0 | 2 ms | 9085 ms | 58 ms
|
BuyNow | 1 % | 1713 | 264 | 3 ms | 9016 ms | 43 ms
|
StoreBuyBow | 0 % | 1403 | 0 | 4 ms | 9011 ms | 51 ms
|
PutBidAuth | 4 % | 6755 | 0 | 0 ms | 9020 ms | 47 ms
|
PutBid | 5 % | 7575 | 958 | 3 ms | 9042 ms | 39 ms
|
StoreBid | 3 % | 4812 | 0 | 4 ms | 9027 ms | 36 ms
|
PutCommentAuth | 0 % | 0 | 0 | 0 ms | 0 ms | 0 ms
|
PutComment | 0 % | 619 | 56 | 3 ms | 9008 ms | 41 ms
|
StoreComment | 0 % | 542 | 0 | 4 ms | 9006 ms | 29 ms
|
Sell | 0 % | 875 | 0 | 0 ms | 9135 ms | 122 ms
|
SelectCategoryToSellItem | 0 % | 846 | 0 | 3 ms | 9006 ms | 75 ms
|
SellItemForm | 0 % | 819 | 0 | 2 ms | 9005 ms | 48 ms
|
RegisterItem | 0 % | 804 | 0 | 4 ms | 9011 ms | 102 ms
|
AboutMe (auth form) | 1 % | 2493 | 0 | 0 ms | 9020 ms | 89 ms
|
AboutMe | 2 % | 4031 | 0 | 4 ms | 9235 ms | 96 ms
|
Back probability | 9 % | 13731 | 0 | 0 ms | 0 ms | 0 ms
|
End of Session | 1 % | 1917 | 0 | 0 ms | 0 ms | 0 ms
|
Total | 100 % | 141502 | 1290 | - | - | 83 ms
|
Average throughput | 237 req/s
| |||||
Completed sessions | 1917
| |||||
Total time | 433898 seconds
| |||||
Average session time | 226 seconds
| |||||
An error occured while waiting for remote processes termination (Skipping waits)
Command is: /usr/bin/scp farm6.csail.mit.edu:/tmp/client1 /home/drkp/sandbox/txcache/src/RUBiS-1.4.3/bench/2009-3-19@14:20:59//client1.bin
Command is: /usr/bin/ssh -x localhost /bin/bash -c 'LANG=en_GB.UTF-8 /usr/bin/sar -n DEV -n SOCK -rubcw 1 605 -f /home/drkp/sandbox/txcache/src/RUBiS-1.4.3/bench/2009-3-19@14:20:59//client1.bin > /home/drkp/sandbox/txcache/src/RUBiS-1.4.3/bench/2009-3-19@14:20:59//client1'
Command is: /usr/bin/scp farm14:/tmp/db_server0 /home/drkp/sandbox/txcache/src/RUBiS-1.4.3/bench/2009-3-19@14:20:59//db_server0.bin
Command is: /usr/bin/ssh -x localhost /bin/bash -c 'LANG=en_GB.UTF-8 /usr/bin/sar -n DEV -n SOCK -rubcw 1 605 -f /home/drkp/sandbox/txcache/src/RUBiS-1.4.3/bench/2009-3-19@14:20:59//db_server0.bin > /home/drkp/sandbox/txcache/src/RUBiS-1.4.3/bench/2009-3-19@14:20:59//db_server0'
Command is: /usr/bin/scp farm12.csail.mit.edu:/tmp/web_server0 /home/drkp/sandbox/txcache/src/RUBiS-1.4.3/bench/2009-3-19@14:20:59//web_server0.bin
Command is: /usr/bin/ssh -x localhost /bin/bash -c 'LANG=en_GB.UTF-8 /usr/bin/sar -n DEV -n SOCK -rubcw 1 605 -f /home/drkp/sandbox/txcache/src/RUBiS-1.4.3/bench/2009-3-19@14:20:59//web_server0.bin > /home/drkp/sandbox/txcache/src/RUBiS-1.4.3/bench/2009-3-19@14:20:59//web_server0'
Command is: /usr/bin/scp farm13.csail.mit.edu:/tmp/web_server1 /home/drkp/sandbox/txcache/src/RUBiS-1.4.3/bench/2009-3-19@14:20:59//web_server1.bin
Command is: /usr/bin/ssh -x localhost /bin/bash -c 'LANG=en_GB.UTF-8 /usr/bin/sar -n DEV -n SOCK -rubcw 1 605 -f /home/drkp/sandbox/txcache/src/RUBiS-1.4.3/bench/2009-3-19@14:20:59//web_server1.bin > /home/drkp/sandbox/txcache/src/RUBiS-1.4.3/bench/2009-3-19@14:20:59//web_server1'
Command is: /usr/bin/scp localhost:/tmp/client0 /home/drkp/sandbox/txcache/src/RUBiS-1.4.3/bench/2009-3-19@14:20:59//client0.bin
Command is: /usr/bin/ssh -x localhost /bin/bash -c 'LANG=en_GB.UTF-8 /usr/bin/sar -n DEV -n SOCK -rubcw 1 605 -f /home/drkp/sandbox/txcache/src/RUBiS-1.4.3/bench/2009-3-19@14:20:59//client0.bin > /home/drkp/sandbox/txcache/src/RUBiS-1.4.3/bench/2009-3-19@14:20:59//client0'
Command is: /usr/bin/scp farm6.csail.mit.edu:/tmp/trace_client1.html /home/drkp/sandbox/txcache/src/RUBiS-1.4.3/bench/2009-3-19@14:20:59//
Command is: /usr/bin/scp farm6.csail.mit.edu:/tmp/stat_client1.html /home/drkp/sandbox/txcache/src/RUBiS-1.4.3/bench/2009-3-19@14:20:59//
|
|
|
|
|
|
 | 
|
 | 
|
 | 
|
 | 
|
 | 
|
 | 
|
 | 
|
 | 
|
 | 
|