Node information
Test timing information
Up ramp statistics
Runtime session statistics
Down ramp statistics
Overall statistics
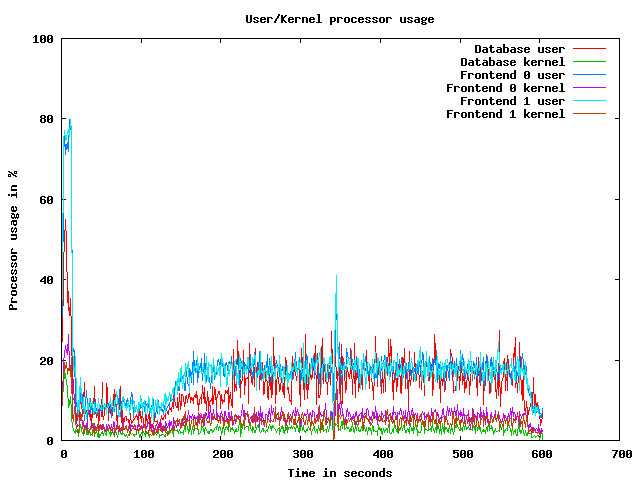
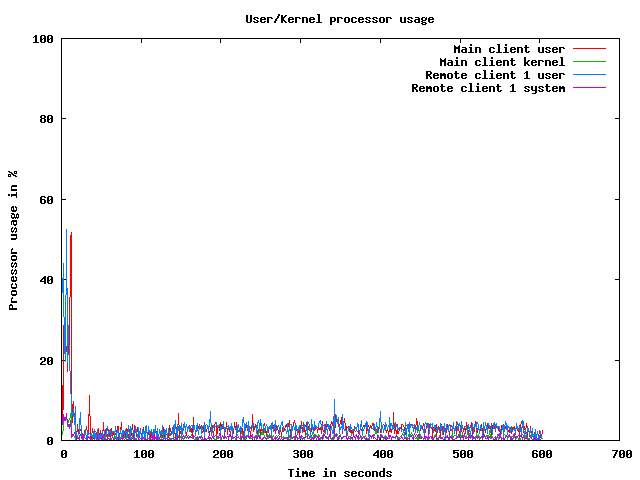
CPU usage graphs
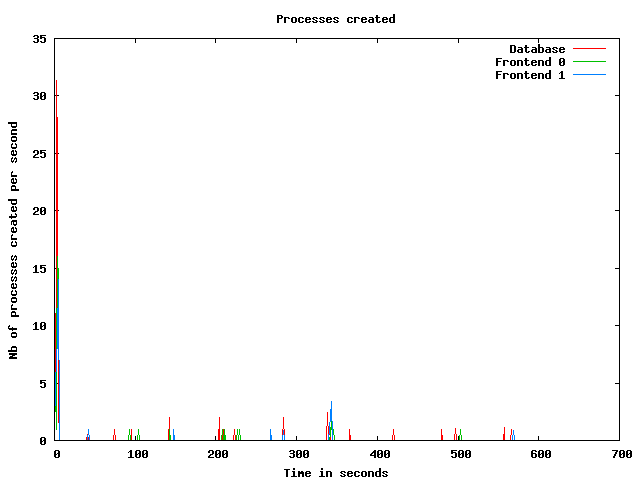
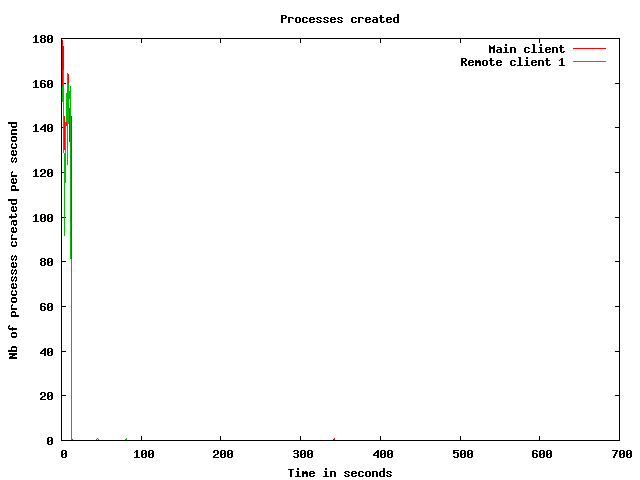
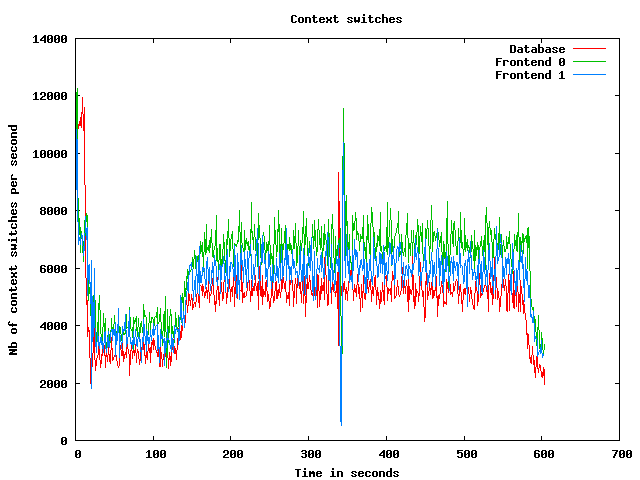
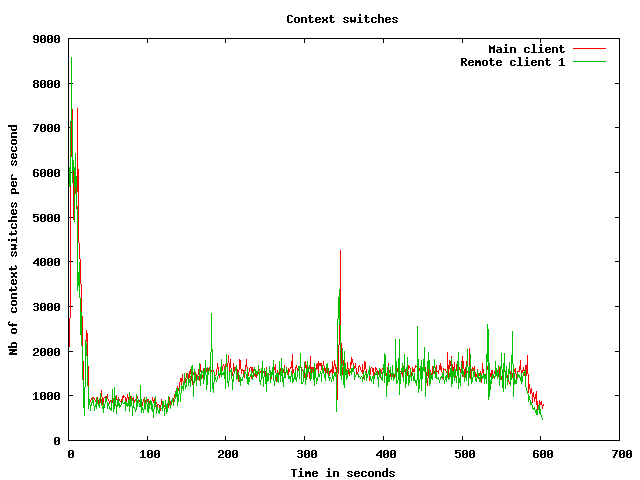
Processes usage graphs
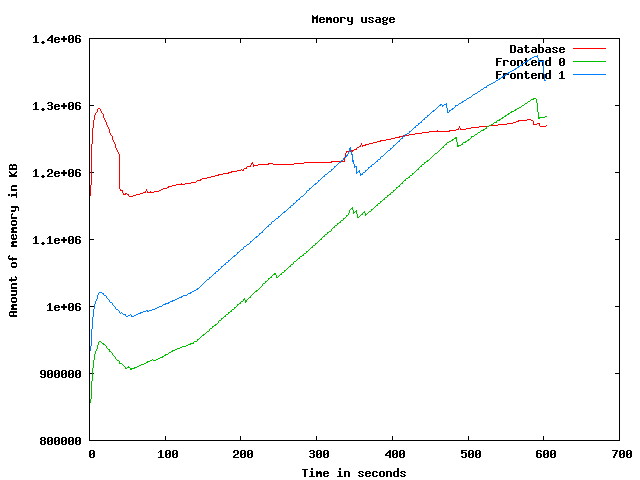
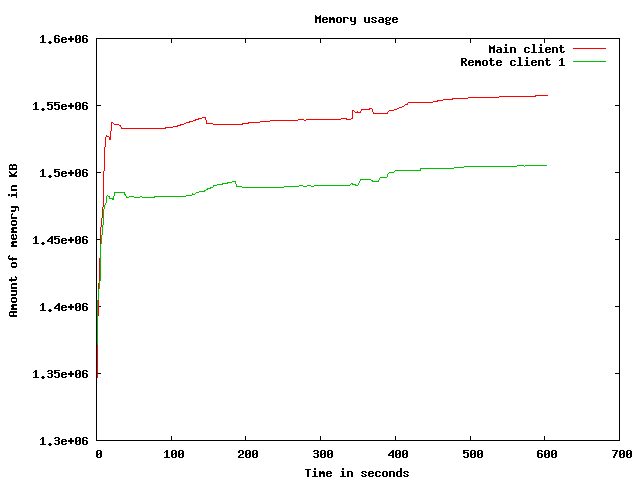
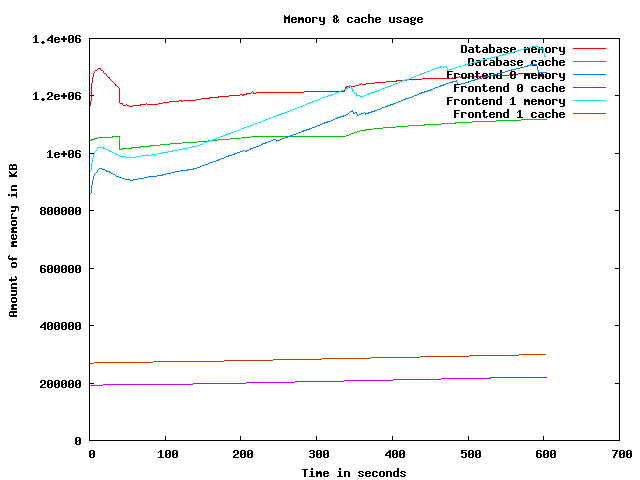
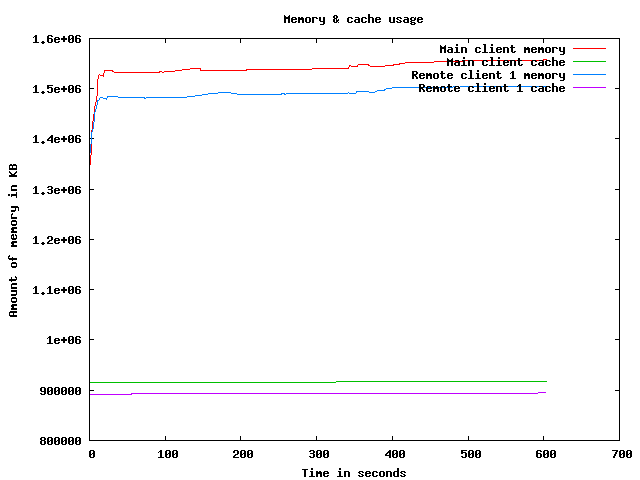
Memory usage graph
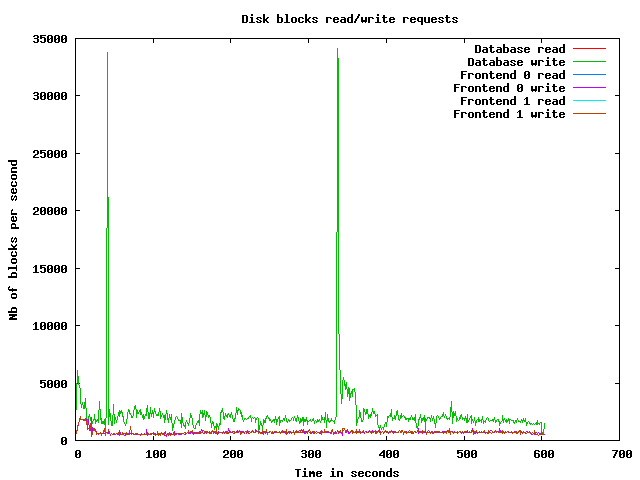
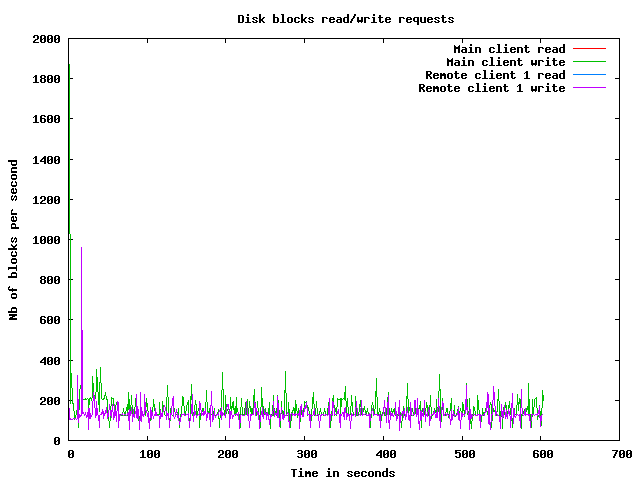
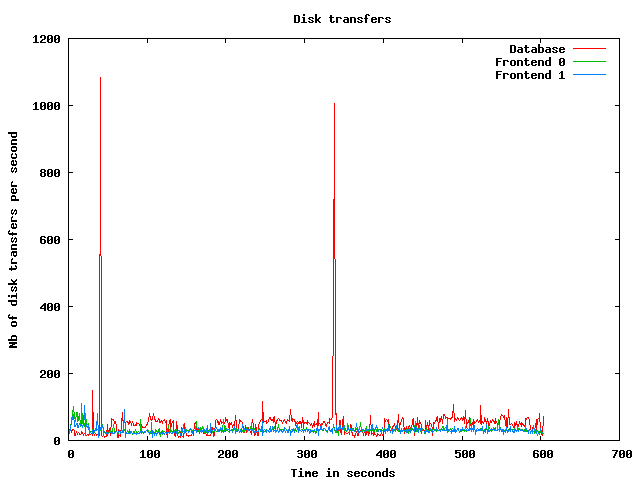
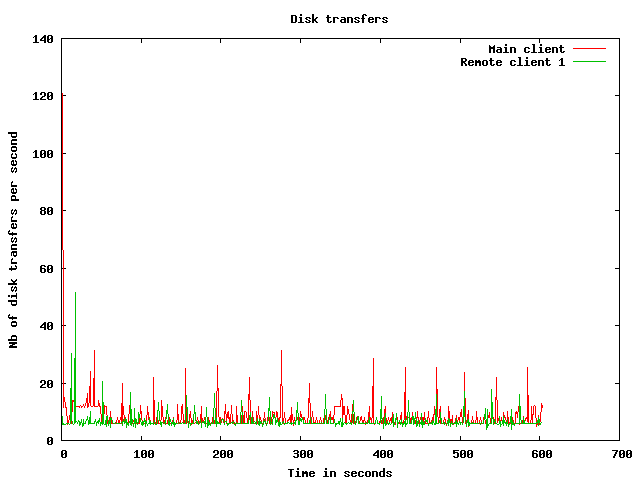
Disk usage graphs
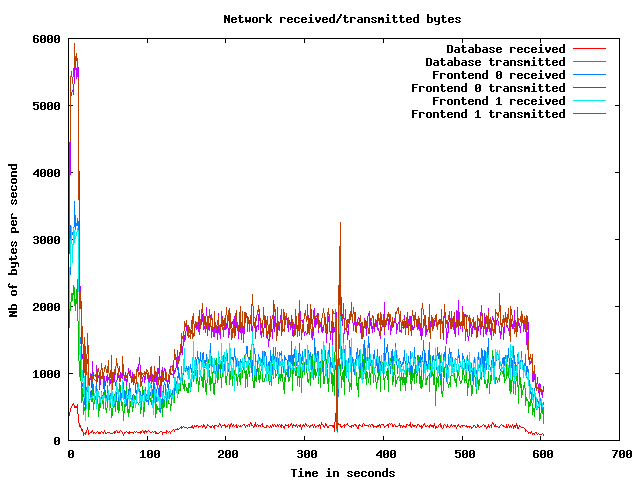
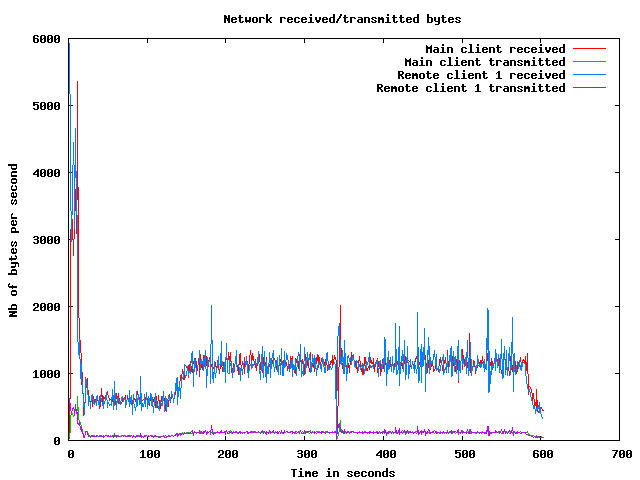
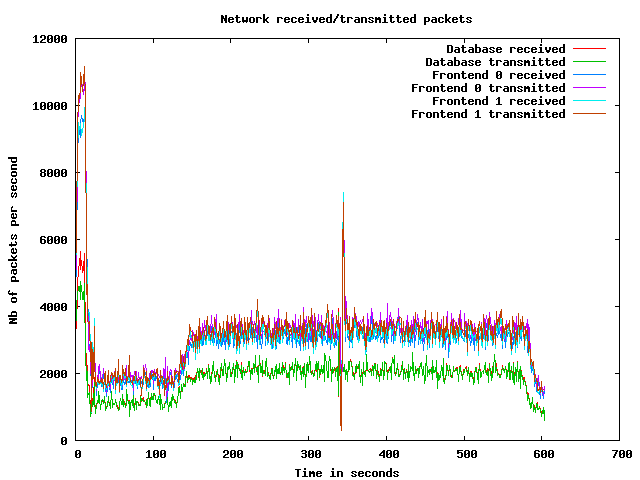
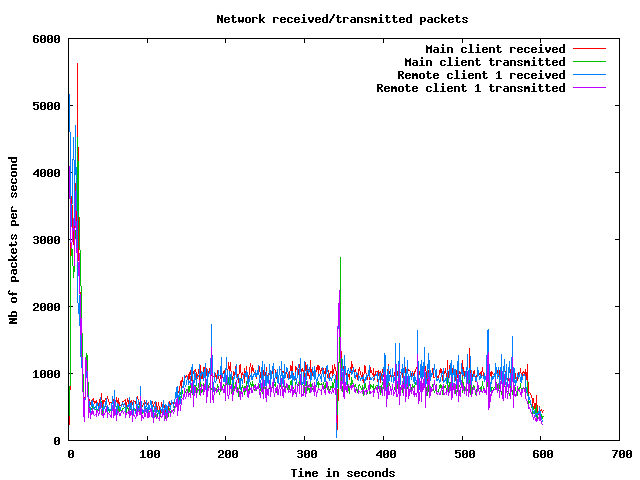
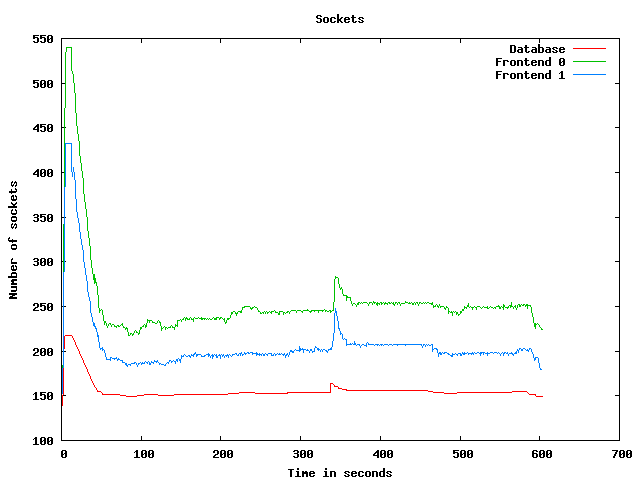
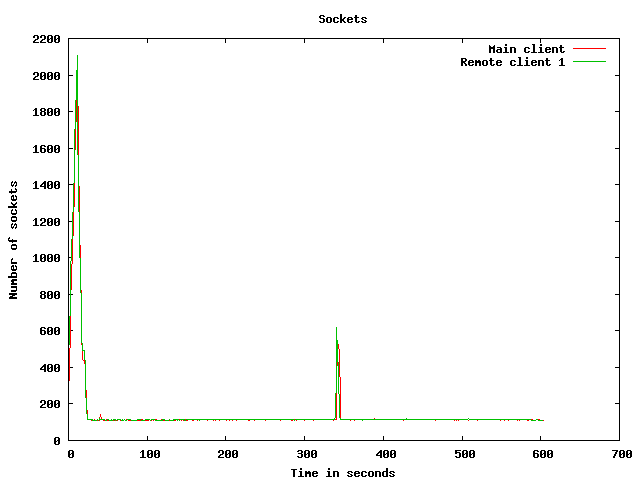
Network usage graphs
| Test start | 2009-3-19 14:33:38 |
| Up ramp start | 2009-3-19 14:33:52 |
| Runtime session start | 2009-3-19 14:35:52 |
| Down ramp start | 2009-3-19 14:43:22 |
| Test end | 2009-3-19 14:45:40 |
| Up ramp length | 2 minutes 0 millisecond (requested 120000 ms) |
| Runtime session length | 7 minutes 30 seconds 1 millisecond (requested 450000 ms) |
| Down ramp length | 30 seconds 0 millisecond (requested 30000 ms) |
| Total test length | 12 minutes 1 second 868 milliseconds |
| State name | % of total | Count | Errors | Minimum Time | Maximum Time | Average Time |
|---|---|---|---|---|---|---|
Home | 9 % | 3340 | 0 | 0 ms | 21026 ms | 2369 ms
|
Register | 1 % | 492 | 0 | 0 ms | 21008 ms | 611 ms
|
RegisterUser | 1 % | 460 | 4 | 5 ms | 21036 ms | 505 ms
|
Browse | 9 % | 3310 | 0 | 0 ms | 21019 ms | 699 ms
|
BrowseCategories | 6 % | 2179 | 0 | 3 ms | 21015 ms | 594 ms
|
SearchItemsInCategory | 14 % | 5126 | 0 | 0 ms | 21027 ms | 381 ms
|
BrowseRegions | 2 % | 934 | 0 | 3 ms | 21018 ms | 552 ms
|
BrowseCategoriesInRegion | 2 % | 881 | 0 | 3 ms | 21026 ms | 398 ms
|
SearchItemsInRegion | 4 % | 1726 | 0 | 0 ms | 21028 ms | 406 ms
|
ViewItem | 12 % | 4398 | 0 | 3 ms | 21032 ms | 283 ms
|
ViewUserInfo | 2 % | 828 | 0 | 3 ms | 21003 ms | 311 ms
|
ViewBidHistory | 1 % | 410 | 0 | 3 ms | 13884 ms | 299 ms
|
BuyNowAuth | 1 % | 379 | 0 | 2 ms | 21034 ms | 384 ms
|
BuyNow | 0 % | 334 | 64 | 5 ms | 21005 ms | 351 ms
|
StoreBuyBow | 0 % | 242 | 0 | 4 ms | 9008 ms | 191 ms
|
PutBidAuth | 4 % | 1454 | 0 | 0 ms | 21005 ms | 291 ms
|
PutBid | 4 % | 1411 | 195 | 3 ms | 21015 ms | 358 ms
|
StoreBid | 2 % | 813 | 1 | 4 ms | 21007 ms | 285 ms
|
PutCommentAuth | 0 % | 0 | 0 | 0 ms | 0 ms | 0 ms
|
PutComment | 0 % | 104 | 9 | 4 ms | 21022 ms | 379 ms
|
StoreComment | 0 % | 80 | 0 | 5 ms | 21008 ms | 789 ms
|
Sell | 0 % | 241 | 0 | 0 ms | 21018 ms | 655 ms
|
SelectCategoryToSellItem | 0 % | 230 | 0 | 3 ms | 21000 ms | 422 ms
|
SellItemForm | 0 % | 216 | 0 | 2 ms | 9958 ms | 390 ms
|
RegisterItem | 0 % | 203 | 0 | 4 ms | 21014 ms | 457 ms
|
AboutMe (auth form) | 2 % | 751 | 0 | 0 ms | 21007 ms | 611 ms
|
AboutMe | 2 % | 1033 | 0 | 4 ms | 21052 ms | 567 ms
|
Back probability | 7 % | 2726 | 0 | 0 ms | 0 ms | 0 ms
|
End of Session | 1 % | 372 | 0 | 0 ms | 0 ms | 0 ms
|
Total | 100 % | 34673 | 273 | - | - | 579 ms
|
Average throughput | 291 req/s
| |||||
Completed sessions | 338
| |||||
Total time | 17111 seconds
| |||||
Average session time | 50 seconds
| |||||
| State name | % of total | Count | Errors | Minimum Time | Maximum Time | Average Time |
|---|---|---|---|---|---|---|
Home | 4 % | 6795 | 0 | 0 ms | 3012 ms | 3 ms
|
Register | 1 % | 1552 | 0 | 0 ms | 3008 ms | 12 ms
|
RegisterUser | 1 % | 1537 | 21 | 5 ms | 3021 ms | 23 ms
|
Browse | 7 % | 10590 | 0 | 0 ms | 3026 ms | 14 ms
|
BrowseCategories | 5 % | 7490 | 0 | 3 ms | 3028 ms | 16 ms
|
SearchItemsInCategory | 15 % | 23692 | 0 | 0 ms | 3132 ms | 19 ms
|
BrowseRegions | 2 % | 3004 | 0 | 3 ms | 3023 ms | 15 ms
|
BrowseCategoriesInRegion | 1 % | 2931 | 0 | 3 ms | 3022 ms | 17 ms
|
SearchItemsInRegion | 4 % | 7005 | 0 | 0 ms | 3057 ms | 24 ms
|
ViewItem | 14 % | 21204 | 0 | 3 ms | 3306 ms | 23 ms
|
ViewUserInfo | 3 % | 4936 | 0 | 3 ms | 3062 ms | 22 ms
|
ViewBidHistory | 1 % | 2482 | 0 | 3 ms | 3358 ms | 35 ms
|
BuyNowAuth | 1 % | 1957 | 0 | 2 ms | 3010 ms | 9 ms
|
BuyNow | 1 % | 1937 | 299 | 3 ms | 3046 ms | 28 ms
|
StoreBuyBow | 1 % | 1611 | 0 | 4 ms | 3044 ms | 21 ms
|
PutBidAuth | 4 % | 7211 | 0 | 0 ms | 3034 ms | 16 ms
|
PutBid | 5 % | 8254 | 1016 | 3 ms | 3054 ms | 27 ms
|
StoreBid | 3 % | 5329 | 1 | 4 ms | 3028 ms | 22 ms
|
PutCommentAuth | 0 % | 0 | 0 | 0 ms | 0 ms | 0 ms
|
PutComment | 0 % | 701 | 65 | 3 ms | 3017 ms | 17 ms
|
StoreComment | 0 % | 628 | 0 | 4 ms | 3018 ms | 14 ms
|
Sell | 0 % | 855 | 0 | 0 ms | 3002 ms | 11 ms
|
SelectCategoryToSellItem | 0 % | 837 | 0 | 3 ms | 3030 ms | 23 ms
|
SellItemForm | 0 % | 824 | 0 | 2 ms | 3030 ms | 7 ms
|
RegisterItem | 0 % | 806 | 0 | 4 ms | 3050 ms | 19 ms
|
AboutMe (auth form) | 1 % | 2469 | 0 | 0 ms | 3008 ms | 17 ms
|
AboutMe | 2 % | 4327 | 0 | 4 ms | 3106 ms | 36 ms
|
Back probability | 10 % | 15439 | 0 | 0 ms | 0 ms | 0 ms
|
End of Session | 1 % | 2019 | 0 | 0 ms | 0 ms | 0 ms
|
Total | 100 % | 148422 | 1402 | - | - | 17 ms
|
Average throughput | 332 req/s
| |||||
Completed sessions | 2020
| |||||
Total time | 497381 seconds
| |||||
Average session time | 246 seconds
| |||||
| State name | % of total | Count | Errors | Minimum Time | Maximum Time | Average Time |
|---|---|---|---|---|---|---|
Home | 3 % | 194 | 0 | 0 ms | 7 ms | 0 ms
|
Register | 1 % | 53 | 0 | 0 ms | 28 ms | 1 ms
|
RegisterUser | 1 % | 53 | 0 | 5 ms | 20 ms | 7 ms
|
Browse | 7 % | 346 | 0 | 0 ms | 13 ms | 0 ms
|
BrowseCategories | 4 % | 237 | 0 | 3 ms | 29 ms | 5 ms
|
SearchItemsInCategory | 15 % | 785 | 0 | 0 ms | 227 ms | 7 ms
|
BrowseRegions | 1 % | 91 | 0 | 3 ms | 32 ms | 7 ms
|
BrowseCategoriesInRegion | 2 % | 109 | 0 | 3 ms | 15 ms | 4 ms
|
SearchItemsInRegion | 5 % | 250 | 0 | 0 ms | 122 ms | 14 ms
|
ViewItem | 14 % | 733 | 0 | 3 ms | 96 ms | 9 ms
|
ViewUserInfo | 3 % | 159 | 0 | 3 ms | 33 ms | 7 ms
|
ViewBidHistory | 1 % | 69 | 0 | 3 ms | 70 ms | 20 ms
|
BuyNowAuth | 1 % | 56 | 0 | 2 ms | 11 ms | 4 ms
|
BuyNow | 1 % | 64 | 7 | 4 ms | 20 ms | 7 ms
|
StoreBuyBow | 0 % | 45 | 0 | 4 ms | 13 ms | 7 ms
|
PutBidAuth | 5 % | 251 | 0 | 0 ms | 31 ms | 3 ms
|
PutBid | 5 % | 287 | 30 | 4 ms | 29 ms | 9 ms
|
StoreBid | 3 % | 187 | 0 | 4 ms | 25 ms | 7 ms
|
PutCommentAuth | 0 % | 0 | 0 | 0 ms | 0 ms | 0 ms
|
PutComment | 0 % | 27 | 0 | 4 ms | 20 ms | 6 ms
|
StoreComment | 0 % | 19 | 0 | 5 ms | 16 ms | 4 ms
|
Sell | 0 % | 17 | 0 | 0 ms | 2 ms | 0 ms
|
SelectCategoryToSellItem | 0 % | 19 | 0 | 4 ms | 18 ms | 7 ms
|
SellItemForm | 0 % | 19 | 0 | 2 ms | 10 ms | 4 ms
|
RegisterItem | 0 % | 20 | 0 | 4 ms | 10 ms | 9 ms
|
AboutMe (auth form) | 1 % | 76 | 0 | 0 ms | 3 ms | 0 ms
|
AboutMe | 2 % | 145 | 0 | 4 ms | 54 ms | 21 ms
|
Back probability | 10 % | 539 | 0 | 0 ms | 0 ms | 0 ms
|
End of Session | 1 % | 63 | 0 | 0 ms | 0 ms | 0 ms
|
Total | 100 % | 4913 | 37 | - | - | 6 ms
|
Average throughput | 165 req/s
| |||||
Completed sessions | 69
| |||||
Total time | 22866 seconds
| |||||
Average session time | 331 seconds
| |||||
| State name | % of total | Count | Errors | Minimum Time | Maximum Time | Average Time |
|---|---|---|---|---|---|---|
Home | 5 % | 10329 | 0 | 0 ms | 21026 ms | 768 ms
|
Register | 1 % | 2097 | 0 | 0 ms | 21008 ms | 152 ms
|
RegisterUser | 1 % | 2050 | 25 | 5 ms | 21036 ms | 131 ms
|
Browse | 7 % | 14246 | 0 | 0 ms | 21019 ms | 173 ms
|
BrowseCategories | 5 % | 9906 | 0 | 3 ms | 21015 ms | 143 ms
|
SearchItemsInCategory | 15 % | 29705 | 0 | 0 ms | 21027 ms | 81 ms
|
BrowseRegions | 2 % | 4029 | 0 | 3 ms | 21018 ms | 139 ms
|
BrowseCategoriesInRegion | 2 % | 3921 | 0 | 3 ms | 21026 ms | 102 ms
|
SearchItemsInRegion | 4 % | 9006 | 0 | 0 ms | 21028 ms | 97 ms
|
ViewItem | 14 % | 26375 | 0 | 3 ms | 21032 ms | 66 ms
|
ViewUserInfo | 3 % | 5935 | 0 | 3 ms | 21003 ms | 62 ms
|
ViewBidHistory | 1 % | 2971 | 0 | 3 ms | 13884 ms | 71 ms
|
BuyNowAuth | 1 % | 2392 | 0 | 2 ms | 21034 ms | 69 ms
|
BuyNow | 1 % | 2335 | 370 | 3 ms | 21005 ms | 74 ms
|
StoreBuyBow | 1 % | 1898 | 0 | 4 ms | 9008 ms | 42 ms
|
PutBidAuth | 4 % | 8916 | 0 | 0 ms | 21005 ms | 61 ms
|
PutBid | 5 % | 9974 | 1241 | 3 ms | 21015 ms | 73 ms
|
StoreBid | 3 % | 6329 | 2 | 4 ms | 21007 ms | 55 ms
|
PutCommentAuth | 0 % | 0 | 0 | 0 ms | 0 ms | 0 ms
|
PutComment | 0 % | 832 | 74 | 3 ms | 21022 ms | 62 ms
|
StoreComment | 0 % | 727 | 0 | 4 ms | 21008 ms | 99 ms
|
Sell | 0 % | 1113 | 0 | 0 ms | 21018 ms | 150 ms
|
SelectCategoryToSellItem | 0 % | 1086 | 0 | 3 ms | 21000 ms | 107 ms
|
SellItemForm | 0 % | 1059 | 0 | 2 ms | 9958 ms | 85 ms
|
RegisterItem | 0 % | 1029 | 0 | 4 ms | 21014 ms | 105 ms
|
AboutMe (auth form) | 1 % | 3296 | 0 | 0 ms | 21007 ms | 152 ms
|
AboutMe | 2 % | 5531 | 0 | 4 ms | 21052 ms | 134 ms
|
Back probability | 9 % | 18705 | 0 | 0 ms | 0 ms | 0 ms
|
End of Session | 1 % | 2454 | 0 | 0 ms | 0 ms | 0 ms
|
Total | 100 % | 188246 | 1712 | - | - | 120 ms
|
Average throughput | 316 req/s
| |||||
Completed sessions | 2454
| |||||
Total time | 549368 seconds
| |||||
Average session time | 223 seconds
| |||||
An error occured while waiting for remote processes termination (Skipping waits)
Command is: /usr/bin/scp farm6.csail.mit.edu:/tmp/client1 /home/drkp/sandbox/txcache/src/RUBiS-1.4.3/bench/2009-3-19@14:33:38//client1.bin
Command is: /usr/bin/ssh -x localhost /bin/bash -c 'LANG=en_GB.UTF-8 /usr/bin/sar -n DEV -n SOCK -rubcw 1 605 -f /home/drkp/sandbox/txcache/src/RUBiS-1.4.3/bench/2009-3-19@14:33:38//client1.bin > /home/drkp/sandbox/txcache/src/RUBiS-1.4.3/bench/2009-3-19@14:33:38//client1'
Command is: /usr/bin/scp farm14:/tmp/db_server0 /home/drkp/sandbox/txcache/src/RUBiS-1.4.3/bench/2009-3-19@14:33:38//db_server0.bin
Command is: /usr/bin/ssh -x localhost /bin/bash -c 'LANG=en_GB.UTF-8 /usr/bin/sar -n DEV -n SOCK -rubcw 1 605 -f /home/drkp/sandbox/txcache/src/RUBiS-1.4.3/bench/2009-3-19@14:33:38//db_server0.bin > /home/drkp/sandbox/txcache/src/RUBiS-1.4.3/bench/2009-3-19@14:33:38//db_server0'
Command is: /usr/bin/scp farm12.csail.mit.edu:/tmp/web_server0 /home/drkp/sandbox/txcache/src/RUBiS-1.4.3/bench/2009-3-19@14:33:38//web_server0.bin
Command is: /usr/bin/ssh -x localhost /bin/bash -c 'LANG=en_GB.UTF-8 /usr/bin/sar -n DEV -n SOCK -rubcw 1 605 -f /home/drkp/sandbox/txcache/src/RUBiS-1.4.3/bench/2009-3-19@14:33:38//web_server0.bin > /home/drkp/sandbox/txcache/src/RUBiS-1.4.3/bench/2009-3-19@14:33:38//web_server0'
Command is: /usr/bin/scp farm13.csail.mit.edu:/tmp/web_server1 /home/drkp/sandbox/txcache/src/RUBiS-1.4.3/bench/2009-3-19@14:33:38//web_server1.bin
Command is: /usr/bin/ssh -x localhost /bin/bash -c 'LANG=en_GB.UTF-8 /usr/bin/sar -n DEV -n SOCK -rubcw 1 605 -f /home/drkp/sandbox/txcache/src/RUBiS-1.4.3/bench/2009-3-19@14:33:38//web_server1.bin > /home/drkp/sandbox/txcache/src/RUBiS-1.4.3/bench/2009-3-19@14:33:38//web_server1'
Command is: /usr/bin/scp localhost:/tmp/client0 /home/drkp/sandbox/txcache/src/RUBiS-1.4.3/bench/2009-3-19@14:33:38//client0.bin
Command is: /usr/bin/ssh -x localhost /bin/bash -c 'LANG=en_GB.UTF-8 /usr/bin/sar -n DEV -n SOCK -rubcw 1 605 -f /home/drkp/sandbox/txcache/src/RUBiS-1.4.3/bench/2009-3-19@14:33:38//client0.bin > /home/drkp/sandbox/txcache/src/RUBiS-1.4.3/bench/2009-3-19@14:33:38//client0'
Command is: /usr/bin/scp farm6.csail.mit.edu:/tmp/trace_client1.html /home/drkp/sandbox/txcache/src/RUBiS-1.4.3/bench/2009-3-19@14:33:38//
Command is: /usr/bin/scp farm6.csail.mit.edu:/tmp/stat_client1.html /home/drkp/sandbox/txcache/src/RUBiS-1.4.3/bench/2009-3-19@14:33:38//
|
|
|
|
|
|
 | 
|
 | 
|
 | 
|
 | 
|
 | 
|
 | 
|
 | 
|
 | 
|
 | 
|