Node information
Test timing information
Up ramp statistics
Runtime session statistics
Down ramp statistics
Overall statistics
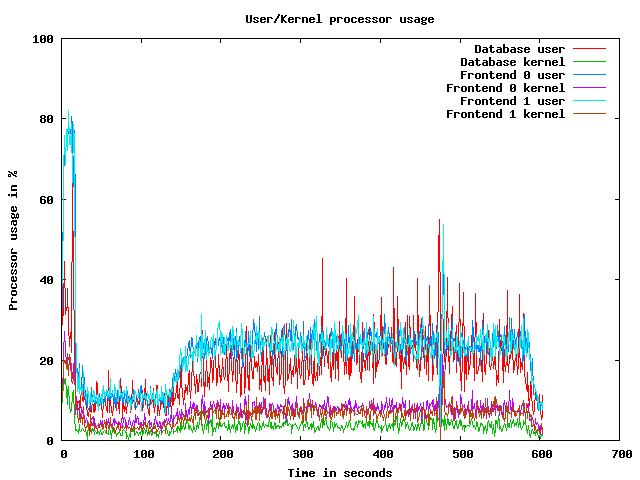
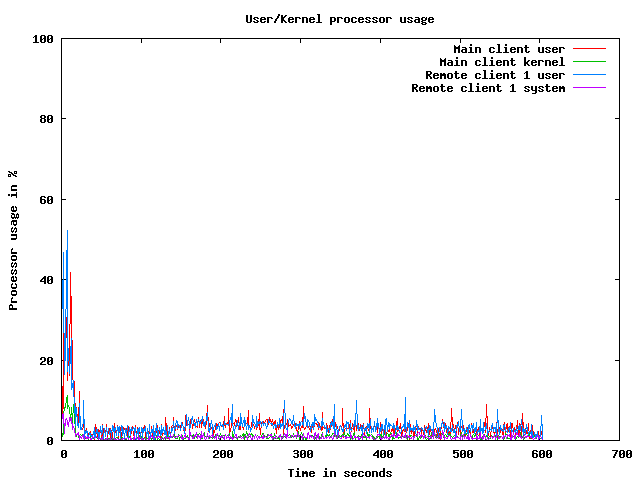
CPU usage graphs
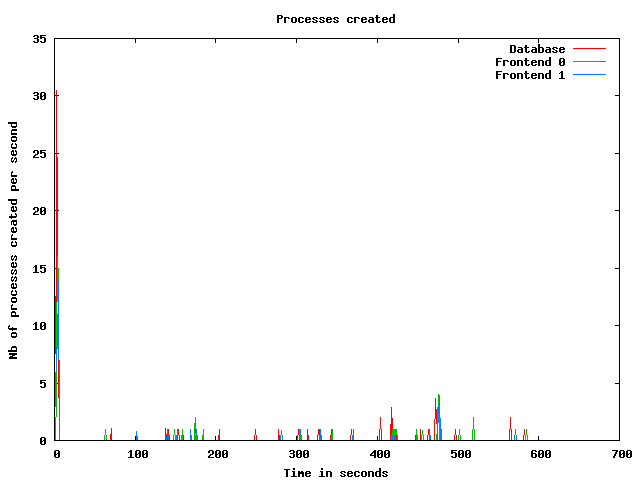
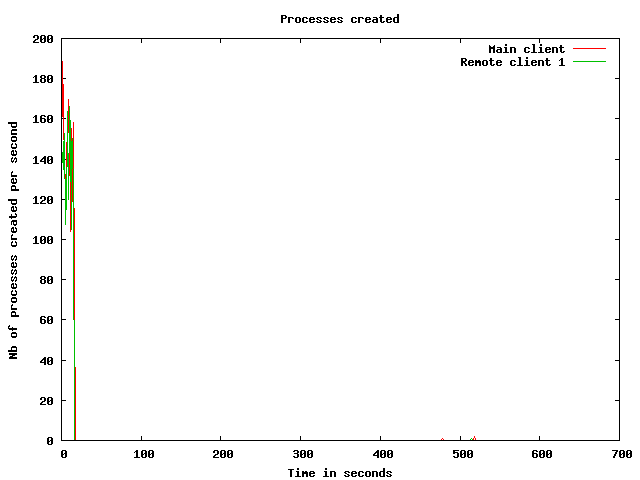
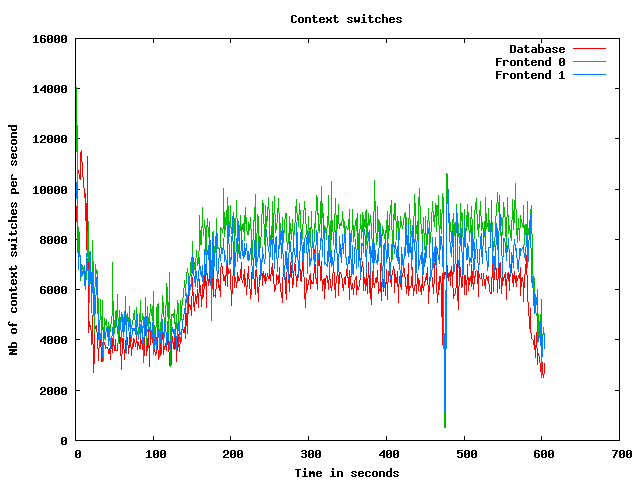
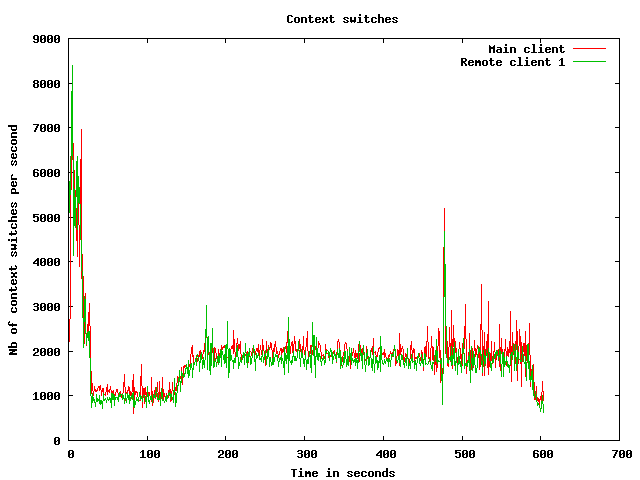
Processes usage graphs
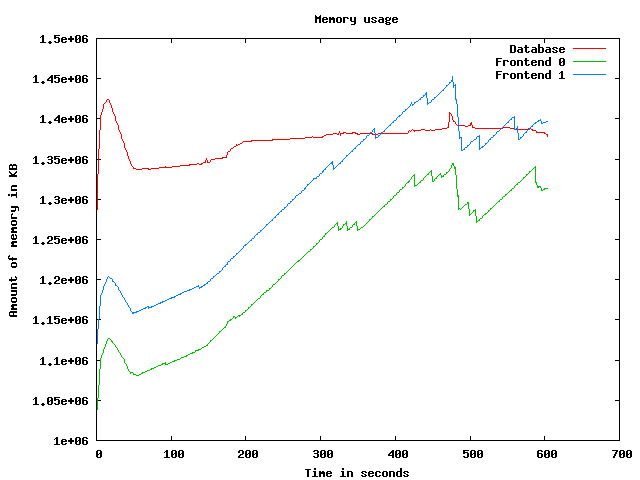
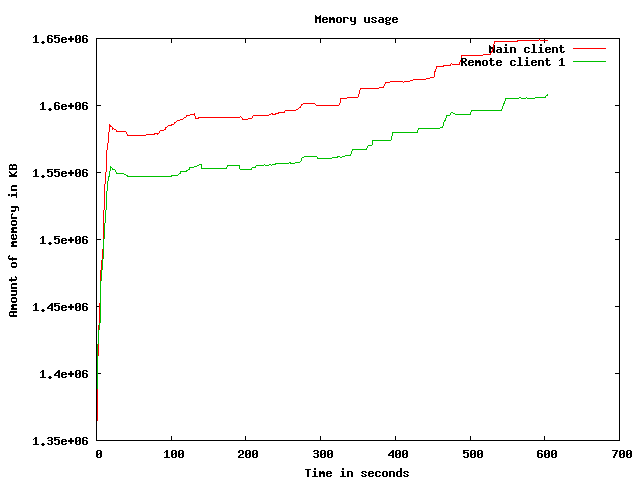
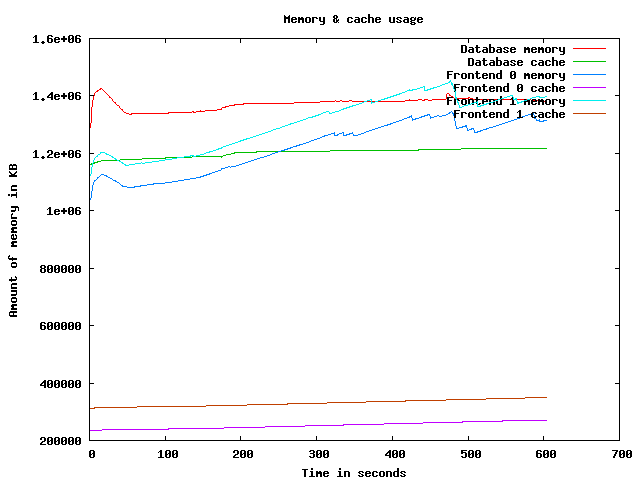
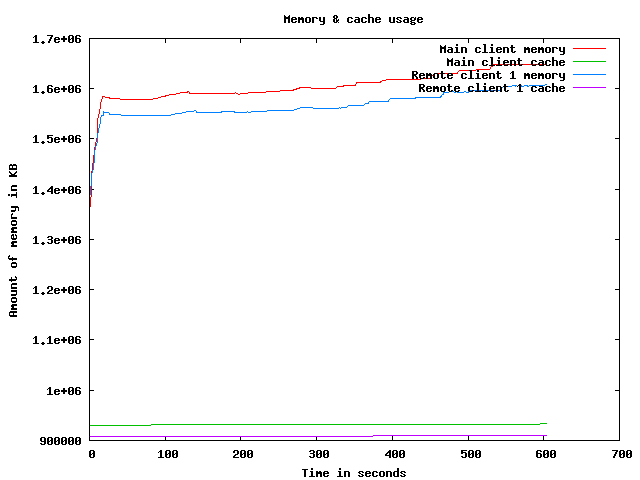
Memory usage graph
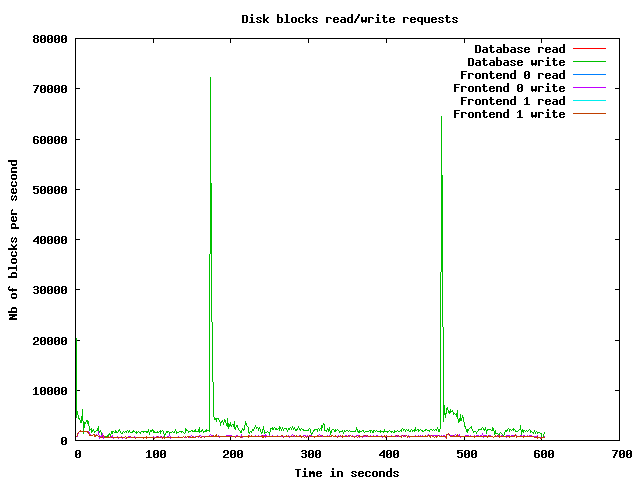
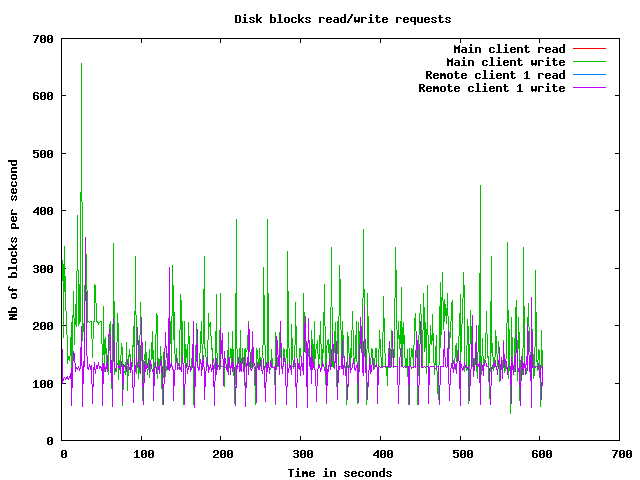
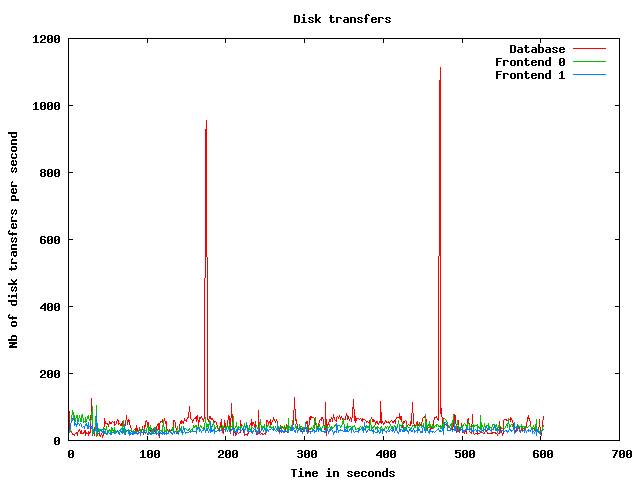
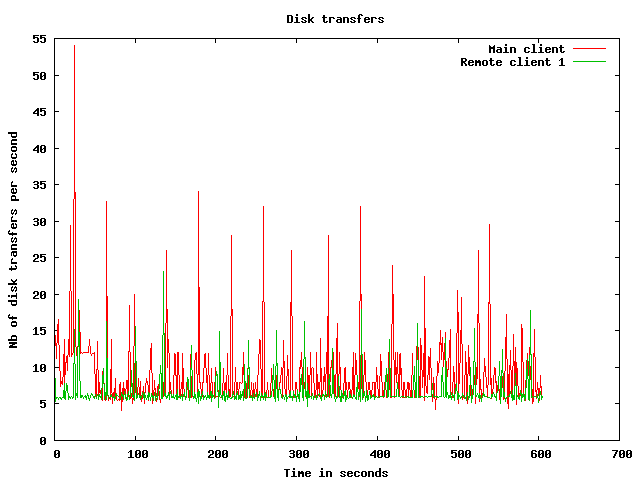
Disk usage graphs
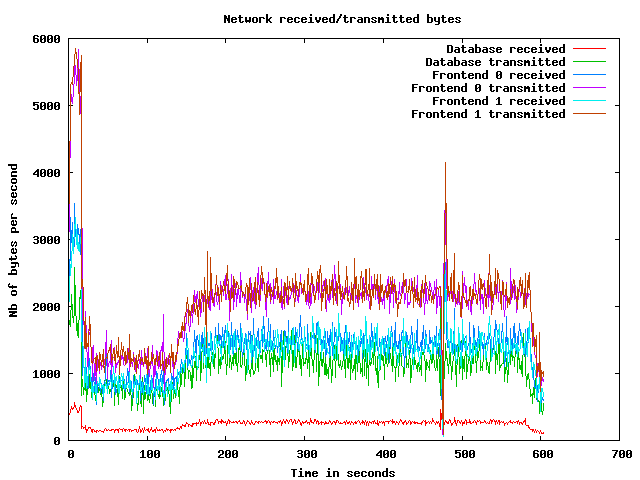
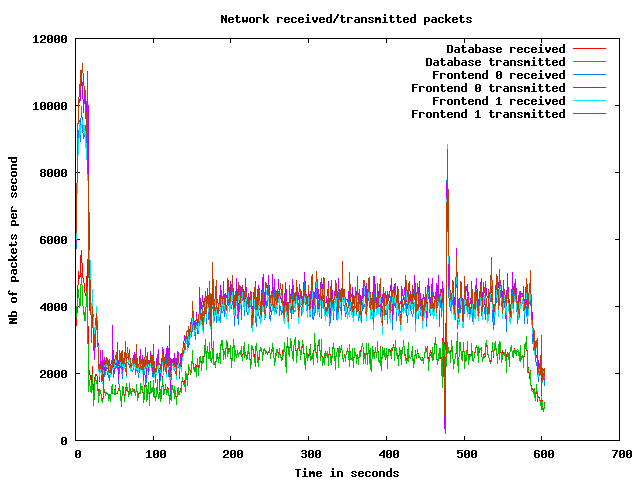
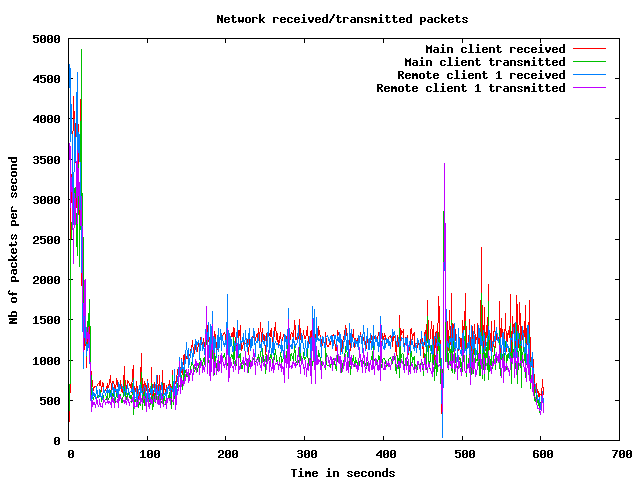
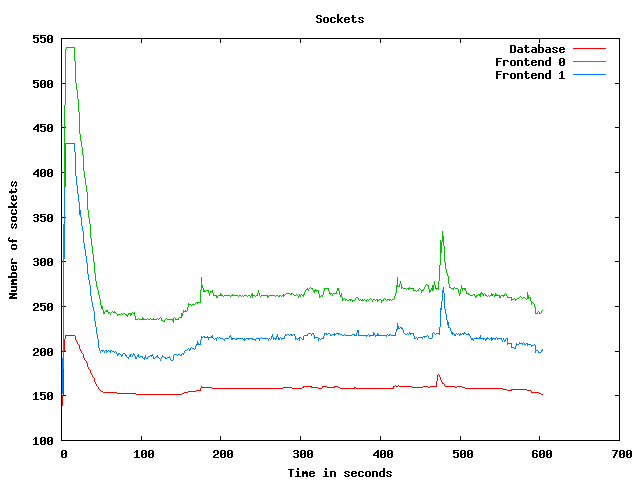
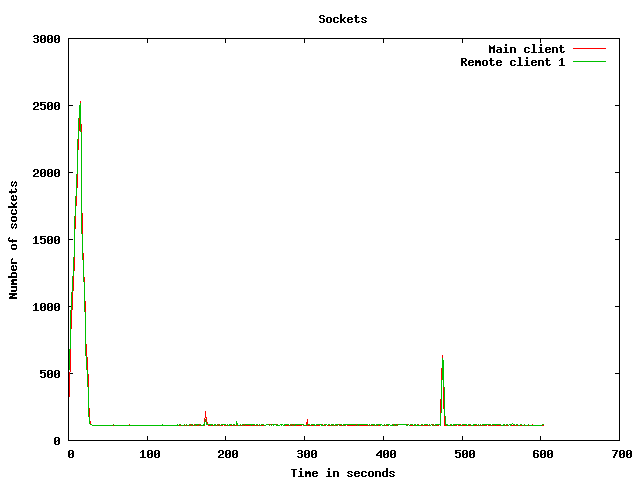
Network usage graphs
| Test start | 2009-3-19 14:46:24 |
| Up ramp start | 2009-3-19 14:46:42 |
| Runtime session start | 2009-3-19 14:48:42 |
| Down ramp start | 2009-3-19 14:56:12 |
| Test end | 2009-3-19 14:58:34 |
| Up ramp length | 2 minutes 1 millisecond (requested 120000 ms) |
| Runtime session length | 7 minutes 30 seconds 0 millisecond (requested 450000 ms) |
| Down ramp length | 30 seconds 0 millisecond (requested 30000 ms) |
| Total test length | 12 minutes 10 seconds 182 milliseconds |
| State name | % of total | Count | Errors | Minimum Time | Maximum Time | Average Time |
|---|---|---|---|---|---|---|
Home | 9 % | 4082 | 0 | 0 ms | 21237 ms | 2810 ms
|
Register | 1 % | 572 | 0 | 0 ms | 21027 ms | 980 ms
|
RegisterUser | 1 % | 535 | 10 | 5 ms | 21025 ms | 610 ms
|
Browse | 9 % | 4163 | 0 | 0 ms | 21088 ms | 877 ms
|
BrowseCategories | 6 % | 2751 | 0 | 3 ms | 27944 ms | 707 ms
|
SearchItemsInCategory | 14 % | 6448 | 0 | 0 ms | 21140 ms | 507 ms
|
BrowseRegions | 2 % | 1125 | 0 | 3 ms | 21099 ms | 560 ms
|
BrowseCategoriesInRegion | 2 % | 1048 | 0 | 3 ms | 21013 ms | 581 ms
|
SearchItemsInRegion | 4 % | 2098 | 0 | 0 ms | 21052 ms | 551 ms
|
ViewItem | 12 % | 5518 | 0 | 3 ms | 21122 ms | 470 ms
|
ViewUserInfo | 2 % | 1070 | 0 | 3 ms | 21012 ms | 320 ms
|
ViewBidHistory | 1 % | 485 | 0 | 3 ms | 21057 ms | 281 ms
|
BuyNowAuth | 1 % | 460 | 0 | 2 ms | 20997 ms | 203 ms
|
BuyNow | 0 % | 416 | 59 | 3 ms | 21011 ms | 504 ms
|
StoreBuyBow | 0 % | 317 | 0 | 4 ms | 21003 ms | 357 ms
|
PutBidAuth | 4 % | 1857 | 0 | 0 ms | 21044 ms | 424 ms
|
PutBid | 4 % | 1821 | 246 | 1 ms | 21026 ms | 376 ms
|
StoreBid | 2 % | 1095 | 0 | 4 ms | 21016 ms | 437 ms
|
PutCommentAuth | 0 % | 0 | 0 | 0 ms | 0 ms | 0 ms
|
PutComment | 0 % | 140 | 10 | 4 ms | 16047 ms | 175 ms
|
StoreComment | 0 % | 113 | 0 | 4 ms | 9823 ms | 416 ms
|
Sell | 0 % | 323 | 0 | 0 ms | 21008 ms | 824 ms
|
SelectCategoryToSellItem | 0 % | 304 | 0 | 3 ms | 21008 ms | 620 ms
|
SellItemForm | 0 % | 283 | 0 | 2 ms | 21013 ms | 603 ms
|
RegisterItem | 0 % | 265 | 0 | 4 ms | 21012 ms | 774 ms
|
AboutMe (auth form) | 2 % | 929 | 0 | 0 ms | 21022 ms | 799 ms
|
AboutMe | 3 % | 1321 | 0 | 4 ms | 21055 ms | 658 ms
|
Back probability | 7 % | 3446 | 0 | 0 ms | 0 ms | 0 ms
|
End of Session | 1 % | 455 | 0 | 0 ms | 0 ms | 0 ms
|
Total | 100 % | 43440 | 325 | - | - | 721 ms
|
Average throughput | 364 req/s
| |||||
Completed sessions | 416
| |||||
Total time | 19718 seconds
| |||||
Average session time | 47 seconds
| |||||
| State name | % of total | Count | Errors | Minimum Time | Maximum Time | Average Time |
|---|---|---|---|---|---|---|
Home | 4 % | 8589 | 0 | 0 ms | 3042 ms | 5 ms
|
Register | 1 % | 2000 | 0 | 0 ms | 3012 ms | 11 ms
|
RegisterUser | 1 % | 1949 | 28 | 4 ms | 3067 ms | 25 ms
|
Browse | 7 % | 13193 | 0 | 0 ms | 3051 ms | 9 ms
|
BrowseCategories | 4 % | 9206 | 0 | 3 ms | 3075 ms | 19 ms
|
SearchItemsInCategory | 15 % | 29165 | 0 | 0 ms | 3133 ms | 19 ms
|
BrowseRegions | 2 % | 3860 | 0 | 3 ms | 3042 ms | 14 ms
|
BrowseCategoriesInRegion | 2 % | 3811 | 0 | 3 ms | 3045 ms | 18 ms
|
SearchItemsInRegion | 5 % | 9352 | 0 | 0 ms | 3092 ms | 26 ms
|
ViewItem | 14 % | 26424 | 0 | 3 ms | 3095 ms | 24 ms
|
ViewUserInfo | 3 % | 5720 | 0 | 3 ms | 3048 ms | 21 ms
|
ViewBidHistory | 1 % | 3266 | 0 | 3 ms | 3282 ms | 41 ms
|
BuyNowAuth | 1 % | 2372 | 0 | 2 ms | 3006 ms | 10 ms
|
BuyNow | 1 % | 2325 | 375 | 3 ms | 3065 ms | 17 ms
|
StoreBuyBow | 1 % | 1894 | 1 | 4 ms | 3015 ms | 19 ms
|
PutBidAuth | 4 % | 9214 | 0 | 0 ms | 3030 ms | 16 ms
|
PutBid | 5 % | 10522 | 1318 | 3 ms | 3100 ms | 25 ms
|
StoreBid | 3 % | 6752 | 2 | 4 ms | 3052 ms | 23 ms
|
PutCommentAuth | 0 % | 0 | 0 | 0 ms | 0 ms | 0 ms
|
PutComment | 0 % | 938 | 81 | 3 ms | 3044 ms | 27 ms
|
StoreComment | 0 % | 838 | 0 | 4 ms | 3026 ms | 15 ms
|
Sell | 0 % | 1028 | 0 | 0 ms | 3007 ms | 15 ms
|
SelectCategoryToSellItem | 0 % | 1005 | 0 | 3 ms | 3082 ms | 34 ms
|
SellItemForm | 0 % | 989 | 0 | 2 ms | 3007 ms | 22 ms
|
RegisterItem | 0 % | 968 | 0 | 4 ms | 3034 ms | 20 ms
|
AboutMe (auth form) | 1 % | 3130 | 0 | 0 ms | 3019 ms | 15 ms
|
AboutMe | 2 % | 5419 | 0 | 4 ms | 3157 ms | 42 ms
|
Back probability | 10 % | 19191 | 0 | 0 ms | 0 ms | 0 ms
|
End of Session | 1 % | 2675 | 0 | 0 ms | 0 ms | 0 ms
|
Total | 100 % | 185795 | 1805 | - | - | 17 ms
|
Average throughput | 416 req/s
| |||||
Completed sessions | 2664
| |||||
Total time | 664078 seconds
| |||||
Average session time | 249 seconds
| |||||
| State name | % of total | Count | Errors | Minimum Time | Maximum Time | Average Time |
|---|---|---|---|---|---|---|
Home | 4 % | 302 | 0 | 0 ms | 6 ms | 0 ms
|
Register | 1 % | 70 | 0 | 0 ms | 8 ms | 0 ms
|
RegisterUser | 1 % | 66 | 1 | 5 ms | 36 ms | 9 ms
|
Browse | 7 % | 456 | 0 | 0 ms | 7 ms | 0 ms
|
BrowseCategories | 4 % | 300 | 0 | 3 ms | 37 ms | 5 ms
|
SearchItemsInCategory | 14 % | 931 | 0 | 1 ms | 51 ms | 7 ms
|
BrowseRegions | 2 % | 128 | 0 | 3 ms | 14 ms | 5 ms
|
BrowseCategoriesInRegion | 2 % | 134 | 0 | 3 ms | 31 ms | 5 ms
|
SearchItemsInRegion | 5 % | 321 | 0 | 0 ms | 82 ms | 14 ms
|
ViewItem | 14 % | 893 | 0 | 3 ms | 55 ms | 9 ms
|
ViewUserInfo | 3 % | 189 | 0 | 3 ms | 20 ms | 7 ms
|
ViewBidHistory | 1 % | 99 | 0 | 3 ms | 82 ms | 20 ms
|
BuyNowAuth | 1 % | 77 | 0 | 2 ms | 28 ms | 5 ms
|
BuyNow | 1 % | 88 | 14 | 4 ms | 34 ms | 8 ms
|
StoreBuyBow | 1 % | 74 | 0 | 4 ms | 35 ms | 7 ms
|
PutBidAuth | 5 % | 329 | 0 | 0 ms | 19 ms | 3 ms
|
PutBid | 5 % | 355 | 45 | 4 ms | 30 ms | 10 ms
|
StoreBid | 3 % | 243 | 0 | 4 ms | 30 ms | 8 ms
|
PutCommentAuth | 0 % | 0 | 0 | 0 ms | 0 ms | 0 ms
|
PutComment | 0 % | 23 | 3 | 5 ms | 17 ms | 10 ms
|
StoreComment | 0 % | 24 | 0 | 5 ms | 22 ms | 10 ms
|
Sell | 0 % | 27 | 0 | 0 ms | 3 ms | 0 ms
|
SelectCategoryToSellItem | 0 % | 37 | 0 | 3 ms | 14 ms | 6 ms
|
SellItemForm | 0 % | 30 | 0 | 2 ms | 10 ms | 4 ms
|
RegisterItem | 0 % | 37 | 0 | 4 ms | 15 ms | 6 ms
|
AboutMe (auth form) | 1 % | 107 | 0 | 0 ms | 9 ms | 1 ms
|
AboutMe | 2 % | 186 | 0 | 4 ms | 52 ms | 24 ms
|
Back probability | 9 % | 620 | 0 | 0 ms | 0 ms | 0 ms
|
End of Session | 1 % | 84 | 0 | 0 ms | 0 ms | 0 ms
|
Total | 100 % | 6230 | 63 | - | - | 6 ms
|
Average throughput | 209 req/s
| |||||
Completed sessions | 99
| |||||
Total time | 32312 seconds
| |||||
Average session time | 326 seconds
| |||||
| State name | % of total | Count | Errors | Minimum Time | Maximum Time | Average Time |
|---|---|---|---|---|---|---|
Home | 5 % | 12973 | 0 | 0 ms | 21237 ms | 887 ms
|
Register | 1 % | 2642 | 0 | 0 ms | 21027 ms | 221 ms
|
RegisterUser | 1 % | 2550 | 39 | 4 ms | 21025 ms | 147 ms
|
Browse | 7 % | 17812 | 0 | 0 ms | 21088 ms | 212 ms
|
BrowseCategories | 5 % | 12257 | 0 | 3 ms | 27944 ms | 173 ms
|
SearchItemsInCategory | 15 % | 36675 | 0 | 0 ms | 21140 ms | 104 ms
|
BrowseRegions | 2 % | 5113 | 0 | 3 ms | 21099 ms | 134 ms
|
BrowseCategoriesInRegion | 2 % | 4993 | 0 | 3 ms | 21013 ms | 136 ms
|
SearchItemsInRegion | 5 % | 11796 | 0 | 0 ms | 21052 ms | 119 ms
|
ViewItem | 13 % | 32888 | 0 | 3 ms | 21122 ms | 98 ms
|
ViewUserInfo | 2 % | 6993 | 0 | 3 ms | 21012 ms | 66 ms
|
ViewBidHistory | 1 % | 3858 | 0 | 3 ms | 21057 ms | 71 ms
|
BuyNowAuth | 1 % | 2909 | 0 | 2 ms | 20997 ms | 41 ms
|
BuyNow | 1 % | 2829 | 448 | 3 ms | 21011 ms | 88 ms
|
StoreBuyBow | 0 % | 2285 | 1 | 4 ms | 21003 ms | 66 ms
|
PutBidAuth | 4 % | 11400 | 0 | 0 ms | 21044 ms | 82 ms
|
PutBid | 5 % | 12719 | 1609 | 1 ms | 21026 ms | 75 ms
|
StoreBid | 3 % | 8090 | 2 | 4 ms | 21016 ms | 78 ms
|
PutCommentAuth | 0 % | 0 | 0 | 0 ms | 0 ms | 0 ms
|
PutComment | 0 % | 1101 | 94 | 3 ms | 16047 ms | 46 ms
|
StoreComment | 0 % | 975 | 0 | 4 ms | 9823 ms | 61 ms
|
Sell | 0 % | 1378 | 0 | 0 ms | 21008 ms | 204 ms
|
SelectCategoryToSellItem | 0 % | 1346 | 0 | 3 ms | 21008 ms | 165 ms
|
SellItemForm | 0 % | 1302 | 0 | 2 ms | 21013 ms | 148 ms
|
RegisterItem | 0 % | 1270 | 0 | 4 ms | 21012 ms | 177 ms
|
AboutMe (auth form) | 1 % | 4166 | 0 | 0 ms | 21022 ms | 190 ms
|
AboutMe | 2 % | 6948 | 0 | 4 ms | 21055 ms | 159 ms
|
Back probability | 9 % | 23257 | 0 | 0 ms | 0 ms | 0 ms
|
End of Session | 1 % | 3214 | 0 | 0 ms | 0 ms | 0 ms
|
Total | 100 % | 235739 | 2193 | - | - | 147 ms
|
Average throughput | 396 req/s
| |||||
Completed sessions | 3214
| |||||
Total time | 729182 seconds
| |||||
Average session time | 226 seconds
| |||||
An error occured while waiting for remote processes termination (Skipping waits)
Command is: /usr/bin/scp farm6.csail.mit.edu:/tmp/client1 /home/drkp/sandbox/txcache/src/RUBiS-1.4.3/bench/2009-3-19@14:46:24//client1.bin
Command is: /usr/bin/ssh -x localhost /bin/bash -c 'LANG=en_GB.UTF-8 /usr/bin/sar -n DEV -n SOCK -rubcw 1 605 -f /home/drkp/sandbox/txcache/src/RUBiS-1.4.3/bench/2009-3-19@14:46:24//client1.bin > /home/drkp/sandbox/txcache/src/RUBiS-1.4.3/bench/2009-3-19@14:46:24//client1'
Command is: /usr/bin/scp farm14:/tmp/db_server0 /home/drkp/sandbox/txcache/src/RUBiS-1.4.3/bench/2009-3-19@14:46:24//db_server0.bin
Command is: /usr/bin/ssh -x localhost /bin/bash -c 'LANG=en_GB.UTF-8 /usr/bin/sar -n DEV -n SOCK -rubcw 1 605 -f /home/drkp/sandbox/txcache/src/RUBiS-1.4.3/bench/2009-3-19@14:46:24//db_server0.bin > /home/drkp/sandbox/txcache/src/RUBiS-1.4.3/bench/2009-3-19@14:46:24//db_server0'
Command is: /usr/bin/scp farm12.csail.mit.edu:/tmp/web_server0 /home/drkp/sandbox/txcache/src/RUBiS-1.4.3/bench/2009-3-19@14:46:24//web_server0.bin
Command is: /usr/bin/ssh -x localhost /bin/bash -c 'LANG=en_GB.UTF-8 /usr/bin/sar -n DEV -n SOCK -rubcw 1 605 -f /home/drkp/sandbox/txcache/src/RUBiS-1.4.3/bench/2009-3-19@14:46:24//web_server0.bin > /home/drkp/sandbox/txcache/src/RUBiS-1.4.3/bench/2009-3-19@14:46:24//web_server0'
Command is: /usr/bin/scp farm13.csail.mit.edu:/tmp/web_server1 /home/drkp/sandbox/txcache/src/RUBiS-1.4.3/bench/2009-3-19@14:46:24//web_server1.bin
Command is: /usr/bin/ssh -x localhost /bin/bash -c 'LANG=en_GB.UTF-8 /usr/bin/sar -n DEV -n SOCK -rubcw 1 605 -f /home/drkp/sandbox/txcache/src/RUBiS-1.4.3/bench/2009-3-19@14:46:24//web_server1.bin > /home/drkp/sandbox/txcache/src/RUBiS-1.4.3/bench/2009-3-19@14:46:24//web_server1'
Command is: /usr/bin/scp localhost:/tmp/client0 /home/drkp/sandbox/txcache/src/RUBiS-1.4.3/bench/2009-3-19@14:46:24//client0.bin
Command is: /usr/bin/ssh -x localhost /bin/bash -c 'LANG=en_GB.UTF-8 /usr/bin/sar -n DEV -n SOCK -rubcw 1 605 -f /home/drkp/sandbox/txcache/src/RUBiS-1.4.3/bench/2009-3-19@14:46:24//client0.bin > /home/drkp/sandbox/txcache/src/RUBiS-1.4.3/bench/2009-3-19@14:46:24//client0'
Command is: /usr/bin/scp farm6.csail.mit.edu:/tmp/trace_client1.html /home/drkp/sandbox/txcache/src/RUBiS-1.4.3/bench/2009-3-19@14:46:24//
Command is: /usr/bin/scp farm6.csail.mit.edu:/tmp/stat_client1.html /home/drkp/sandbox/txcache/src/RUBiS-1.4.3/bench/2009-3-19@14:46:24//
|
|
|
|
|
|
 | 
|
 | 
|
 | 
|
 | 
|
 | 
|
 | 
|
 | 
|
 | 
|
 | 
|