Node information
Test timing information
Up ramp statistics
Runtime session statistics
Down ramp statistics
Overall statistics
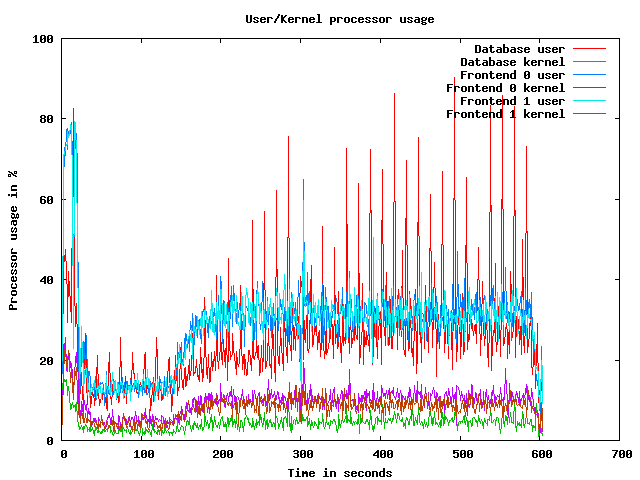
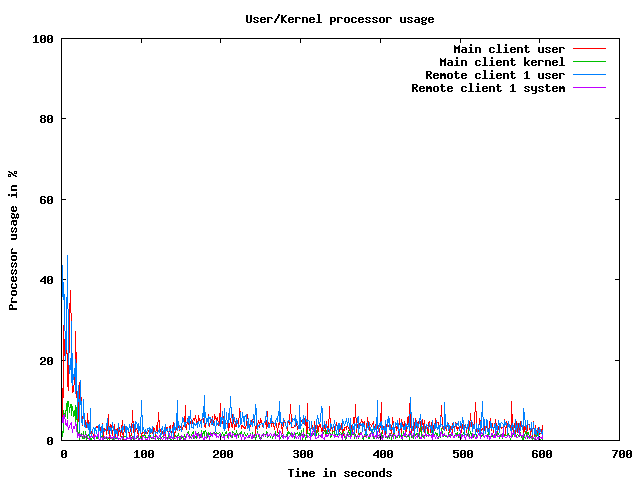
CPU usage graphs
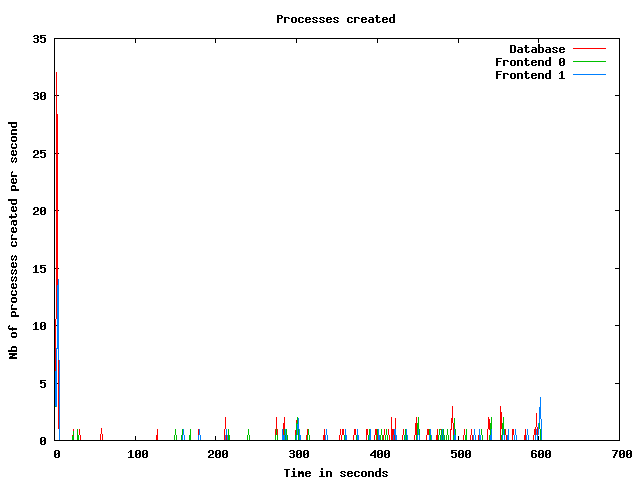
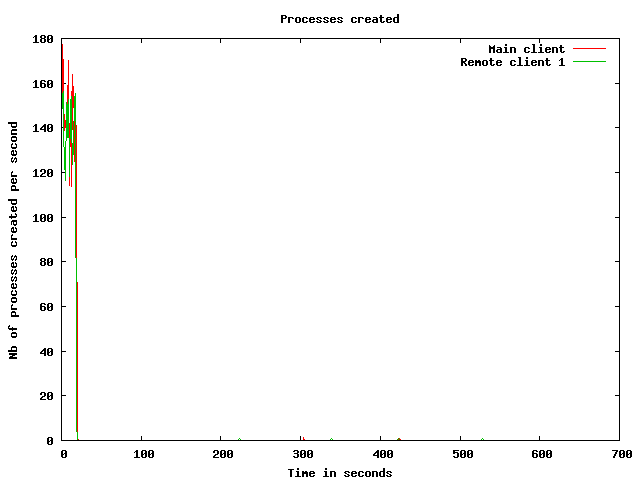
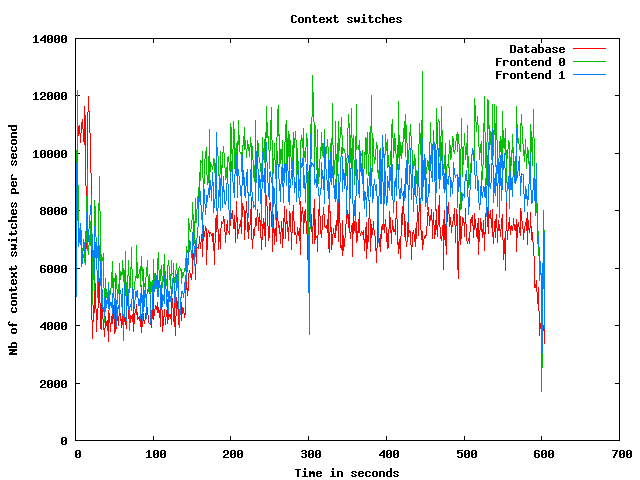
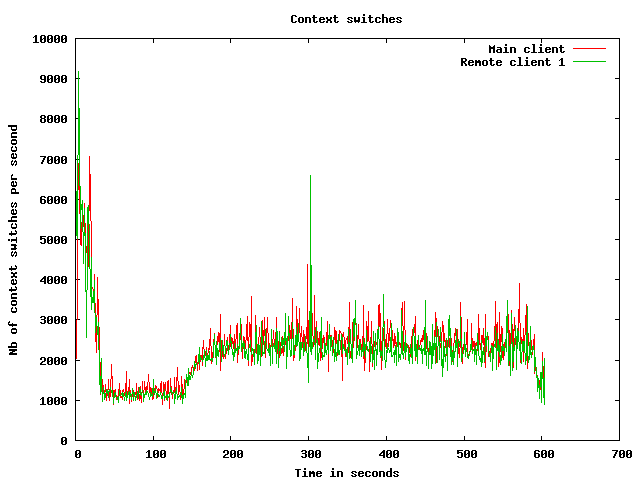
Processes usage graphs
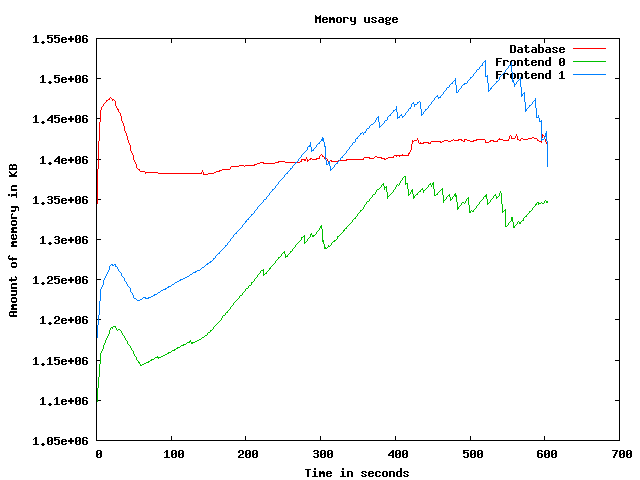
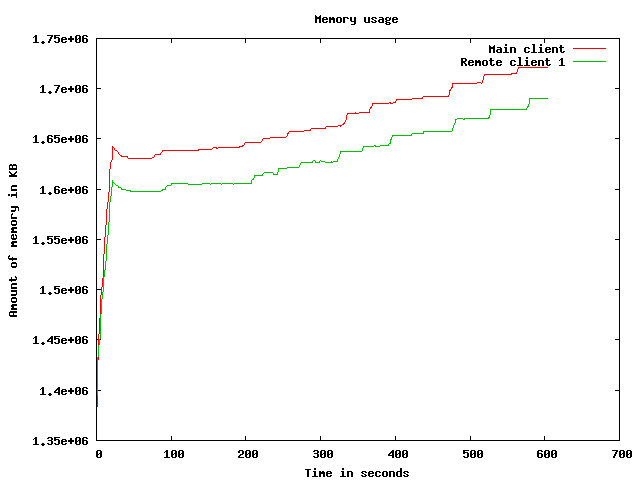
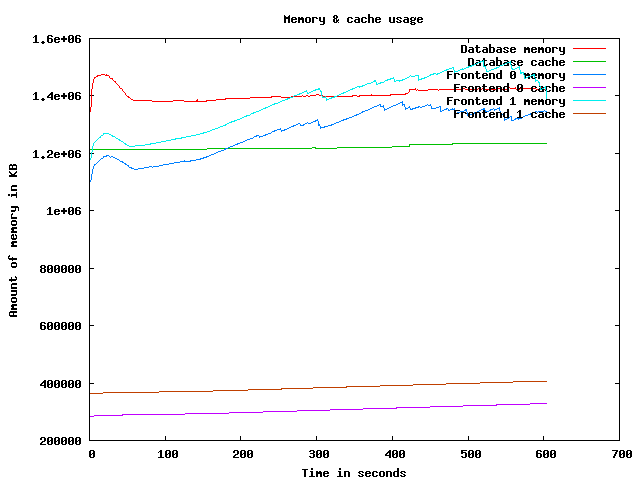
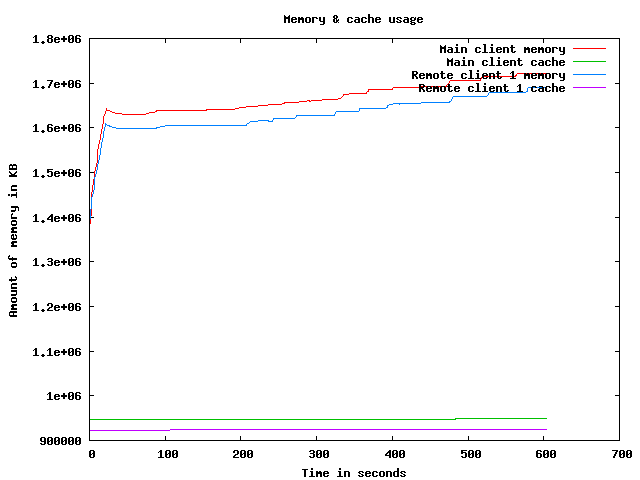
Memory usage graph
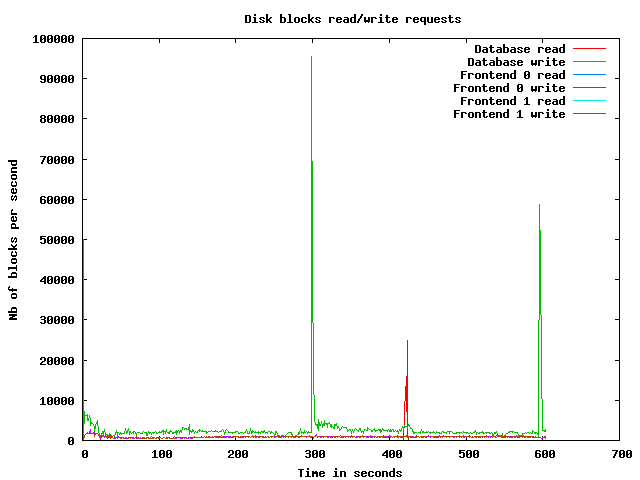
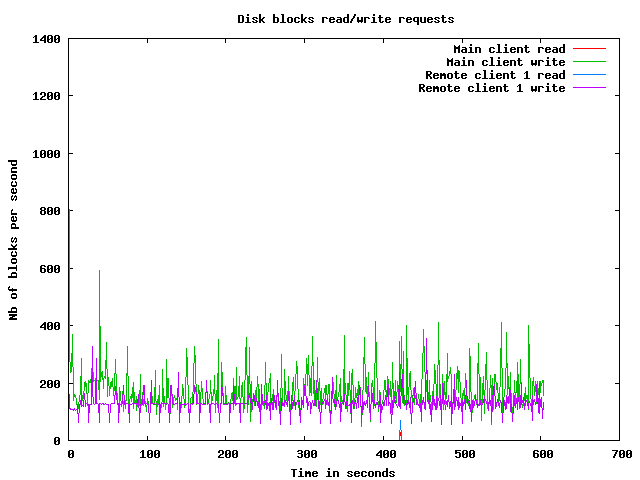
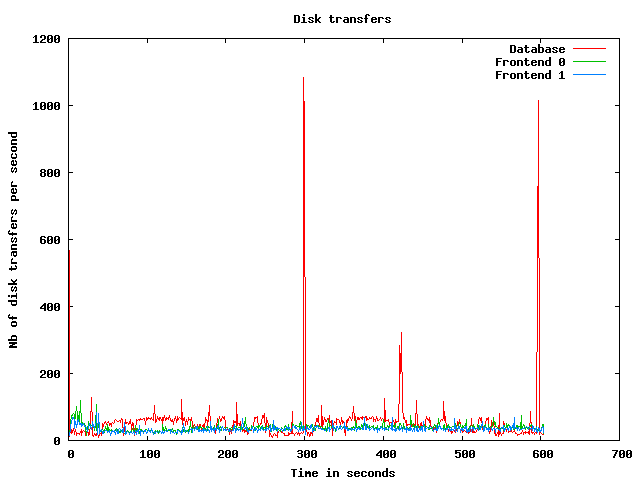
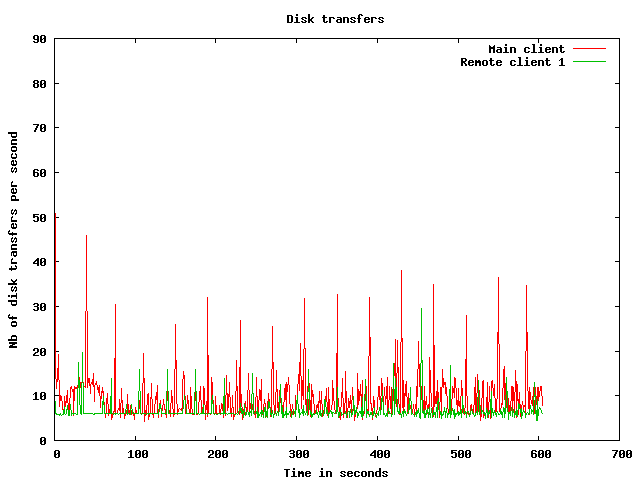
Disk usage graphs
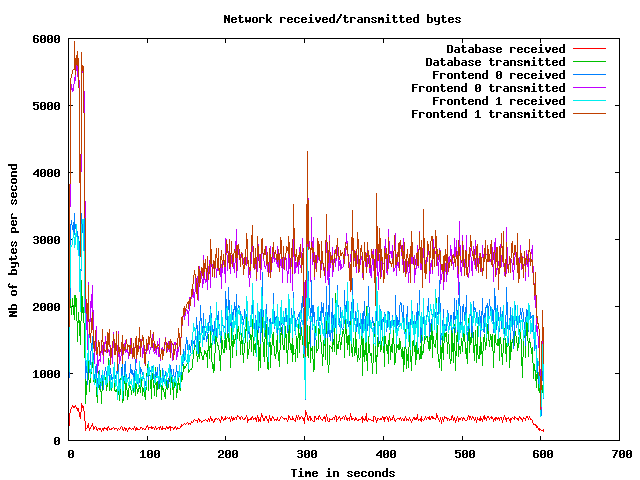
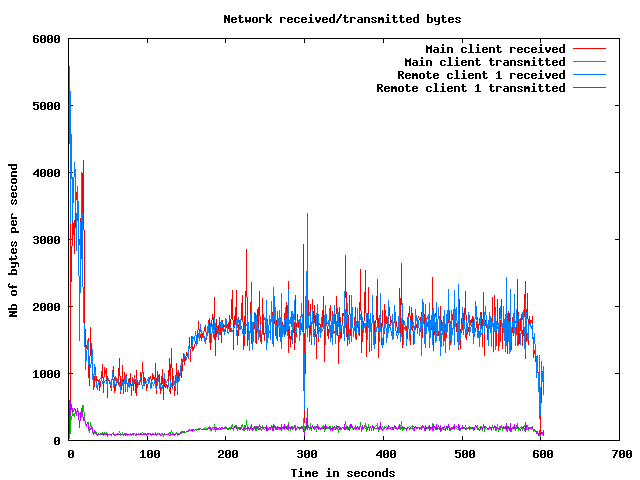
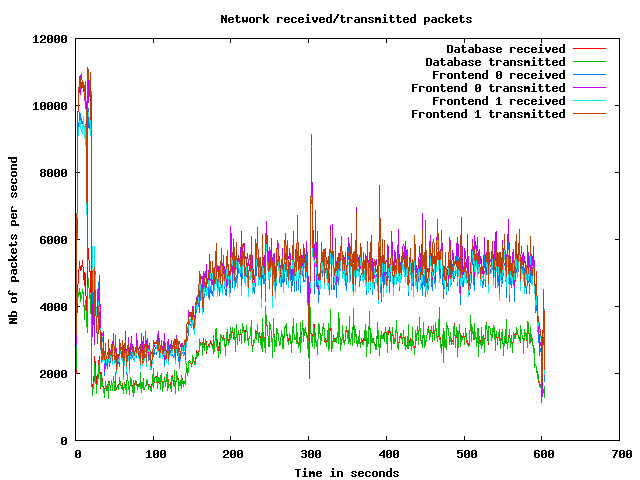
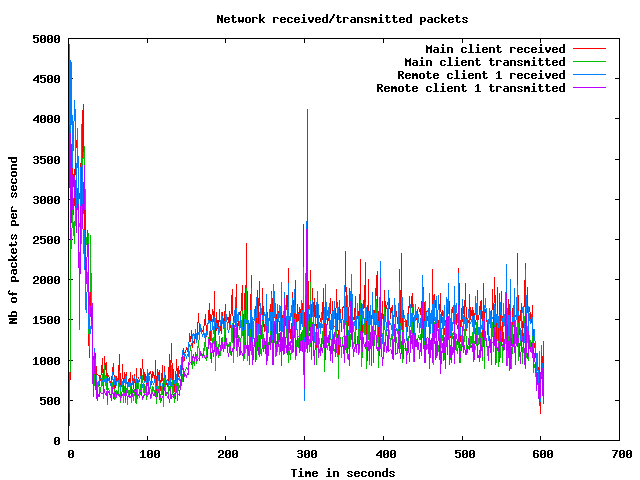
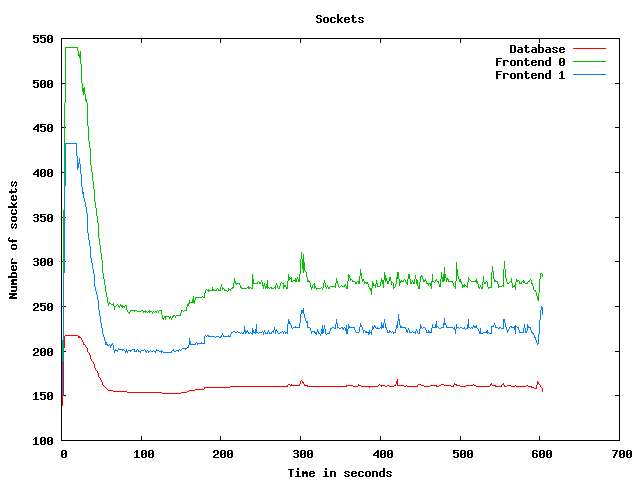
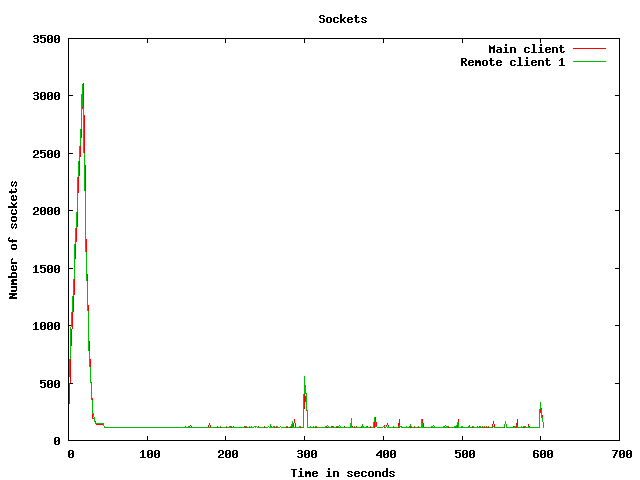
Network usage graphs
| Test start | 2009-3-19 14:59:19 |
| Up ramp start | 2009-3-19 14:59:41 |
| Runtime session start | 2009-3-19 15:1:41 |
| Down ramp start | 2009-3-19 15:9:11 |
| Test end | 2009-3-19 15:11:36 |
| Up ramp length | 2 minutes 1 millisecond (requested 120000 ms) |
| Runtime session length | 7 minutes 30 seconds 0 millisecond (requested 450000 ms) |
| Down ramp length | 30 seconds 0 millisecond (requested 30000 ms) |
| Total test length | 12 minutes 16 seconds 810 milliseconds |
| State name | % of total | Count | Errors | Minimum Time | Maximum Time | Average Time |
|---|---|---|---|---|---|---|
Home | 9 % | 4899 | 0 | 0 ms | 45002 ms | 2968 ms
|
Register | 1 % | 724 | 0 | 0 ms | 21196 ms | 1185 ms
|
RegisterUser | 1 % | 674 | 3 | 5 ms | 21212 ms | 768 ms
|
Browse | 9 % | 5022 | 0 | 0 ms | 22863 ms | 1108 ms
|
BrowseCategories | 6 % | 3308 | 0 | 3 ms | 21326 ms | 790 ms
|
SearchItemsInCategory | 14 % | 7821 | 0 | 2 ms | 30965 ms | 649 ms
|
BrowseRegions | 2 % | 1405 | 0 | 3 ms | 22860 ms | 756 ms
|
BrowseCategoriesInRegion | 2 % | 1321 | 0 | 3 ms | 22872 ms | 836 ms
|
SearchItemsInRegion | 4 % | 2552 | 0 | 0 ms | 21374 ms | 592 ms
|
ViewItem | 12 % | 6517 | 0 | 3 ms | 21283 ms | 566 ms
|
ViewUserInfo | 2 % | 1107 | 0 | 3 ms | 21053 ms | 564 ms
|
ViewBidHistory | 1 % | 585 | 0 | 3 ms | 21170 ms | 722 ms
|
BuyNowAuth | 1 % | 551 | 0 | 2 ms | 21349 ms | 693 ms
|
BuyNow | 0 % | 494 | 71 | 4 ms | 21118 ms | 440 ms
|
StoreBuyBow | 0 % | 373 | 0 | 4 ms | 21110 ms | 434 ms
|
PutBidAuth | 4 % | 2266 | 0 | 0 ms | 21248 ms | 577 ms
|
PutBid | 4 % | 2199 | 293 | 0 ms | 22867 ms | 513 ms
|
StoreBid | 2 % | 1325 | 1 | 4 ms | 27946 ms | 415 ms
|
PutCommentAuth | 0 % | 0 | 0 | 0 ms | 0 ms | 0 ms
|
PutComment | 0 % | 176 | 21 | 3 ms | 21015 ms | 472 ms
|
StoreComment | 0 % | 145 | 0 | 4 ms | 21017 ms | 662 ms
|
Sell | 0 % | 393 | 0 | 0 ms | 21043 ms | 807 ms
|
SelectCategoryToSellItem | 0 % | 360 | 0 | 4 ms | 21011 ms | 892 ms
|
SellItemForm | 0 % | 332 | 0 | 2 ms | 21023 ms | 882 ms
|
RegisterItem | 0 % | 305 | 0 | 4 ms | 21369 ms | 760 ms
|
AboutMe (auth form) | 2 % | 1109 | 0 | 0 ms | 27944 ms | 1089 ms
|
AboutMe | 2 % | 1562 | 0 | 4 ms | 21352 ms | 811 ms
|
Back probability | 7 % | 4091 | 0 | 0 ms | 0 ms | 0 ms
|
End of Session | 1 % | 552 | 0 | 0 ms | 0 ms | 0 ms
|
Total | 100 % | 52168 | 389 | - | - | 859 ms
|
Average throughput | 437 req/s
| |||||
Completed sessions | 513
| |||||
Total time | 28032 seconds
| |||||
Average session time | 54 seconds
| |||||
| State name | % of total | Count | Errors | Minimum Time | Maximum Time | Average Time |
|---|---|---|---|---|---|---|
Home | 4 % | 9819 | 0 | 0 ms | 3153 ms | 3 ms
|
Register | 0 % | 2224 | 0 | 0 ms | 3102 ms | 7 ms
|
RegisterUser | 0 % | 2192 | 37 | 4 ms | 3159 ms | 22 ms
|
Browse | 7 % | 15690 | 0 | 0 ms | 3162 ms | 8 ms
|
BrowseCategories | 4 % | 11066 | 0 | 3 ms | 3194 ms | 17 ms
|
SearchItemsInCategory | 15 % | 35432 | 0 | 0 ms | 3199 ms | 21 ms
|
BrowseRegions | 1 % | 4455 | 0 | 3 ms | 3166 ms | 12 ms
|
BrowseCategoriesInRegion | 1 % | 4388 | 0 | 3 ms | 3094 ms | 13 ms
|
SearchItemsInRegion | 4 % | 10956 | 0 | 0 ms | 3200 ms | 27 ms
|
ViewItem | 14 % | 31756 | 0 | 3 ms | 3207 ms | 21 ms
|
ViewUserInfo | 3 % | 7230 | 0 | 3 ms | 3163 ms | 18 ms
|
ViewBidHistory | 1 % | 3844 | 0 | 3 ms | 3190 ms | 45 ms
|
BuyNowAuth | 1 % | 2931 | 0 | 2 ms | 3161 ms | 10 ms
|
BuyNow | 1 % | 2891 | 392 | 4 ms | 3184 ms | 20 ms
|
StoreBuyBow | 1 % | 2461 | 1 | 4 ms | 3162 ms | 18 ms
|
PutBidAuth | 4 % | 10978 | 0 | 0 ms | 3184 ms | 11 ms
|
PutBid | 5 % | 12579 | 1503 | 3 ms | 3198 ms | 21 ms
|
StoreBid | 3 % | 8241 | 2 | 4 ms | 3145 ms | 19 ms
|
PutCommentAuth | 0 % | 0 | 0 | 0 ms | 0 ms | 0 ms
|
PutComment | 0 % | 1036 | 81 | 3 ms | 3211 ms | 22 ms
|
StoreComment | 0 % | 930 | 0 | 5 ms | 3044 ms | 24 ms
|
Sell | 0 % | 1225 | 0 | 0 ms | 3071 ms | 8 ms
|
SelectCategoryToSellItem | 0 % | 1217 | 0 | 3 ms | 3139 ms | 22 ms
|
SellItemForm | 0 % | 1202 | 0 | 2 ms | 3151 ms | 17 ms
|
RegisterItem | 0 % | 1187 | 0 | 4 ms | 3054 ms | 17 ms
|
AboutMe (auth form) | 1 % | 3730 | 0 | 0 ms | 3149 ms | 7 ms
|
AboutMe | 2 % | 6289 | 0 | 4 ms | 3247 ms | 41 ms
|
Back probability | 10 % | 23520 | 0 | 0 ms | 0 ms | 0 ms
|
End of Session | 1 % | 3299 | 0 | 0 ms | 0 ms | 0 ms
|
Total | 100 % | 222768 | 2016 | - | - | 16 ms
|
Average throughput | 499 req/s
| |||||
Completed sessions | 3287
| |||||
Total time | 816994 seconds
| |||||
Average session time | 248 seconds
| |||||
| State name | % of total | Count | Errors | Minimum Time | Maximum Time | Average Time |
|---|---|---|---|---|---|---|
Home | 4 % | 349 | 0 | 0 ms | 4 ms | 0 ms
|
Register | 0 % | 69 | 0 | 0 ms | 1520 ms | 42 ms
|
RegisterUser | 1 % | 77 | 0 | 6 ms | 3006 ms | 161 ms
|
Browse | 7 % | 557 | 0 | 0 ms | 3002 ms | 54 ms
|
BrowseCategories | 5 % | 381 | 0 | 3 ms | 3013 ms | 67 ms
|
SearchItemsInCategory | 15 % | 1106 | 0 | 0 ms | 3013 ms | 90 ms
|
BrowseRegions | 2 % | 170 | 0 | 3 ms | 3001 ms | 48 ms
|
BrowseCategoriesInRegion | 1 % | 145 | 0 | 3 ms | 3010 ms | 86 ms
|
SearchItemsInRegion | 4 % | 358 | 0 | 0 ms | 3020 ms | 112 ms
|
ViewItem | 14 % | 1046 | 0 | 3 ms | 3020 ms | 72 ms
|
ViewUserInfo | 2 % | 203 | 0 | 3 ms | 3008 ms | 91 ms
|
ViewBidHistory | 1 % | 120 | 0 | 4 ms | 3087 ms | 137 ms
|
BuyNowAuth | 1 % | 113 | 0 | 2 ms | 2999 ms | 51 ms
|
BuyNow | 1 % | 101 | 13 | 5 ms | 1612 ms | 54 ms
|
StoreBuyBow | 1 % | 76 | 0 | 5 ms | 1676 ms | 92 ms
|
PutBidAuth | 4 % | 345 | 0 | 0 ms | 3006 ms | 81 ms
|
PutBid | 5 % | 420 | 57 | 4 ms | 3012 ms | 65 ms
|
StoreBid | 3 % | 254 | 0 | 5 ms | 3004 ms | 102 ms
|
PutCommentAuth | 0 % | 0 | 0 | 0 ms | 0 ms | 0 ms
|
PutComment | 0 % | 42 | 1 | 4 ms | 31 ms | 11 ms
|
StoreComment | 0 % | 48 | 0 | 5 ms | 3012 ms | 190 ms
|
Sell | 0 % | 42 | 0 | 0 ms | 2990 ms | 71 ms
|
SelectCategoryToSellItem | 0 % | 38 | 0 | 4 ms | 24 ms | 9 ms
|
SellItemForm | 0 % | 39 | 0 | 2 ms | 3002 ms | 111 ms
|
RegisterItem | 0 % | 41 | 0 | 4 ms | 3006 ms | 273 ms
|
AboutMe (auth form) | 1 % | 115 | 0 | 0 ms | 2999 ms | 65 ms
|
AboutMe | 2 % | 212 | 0 | 4 ms | 3038 ms | 143 ms
|
Back probability | 10 % | 742 | 0 | 0 ms | 0 ms | 0 ms
|
End of Session | 1 % | 103 | 0 | 0 ms | 0 ms | 0 ms
|
Total | 100 % | 7312 | 71 | - | - | 69 ms
|
Average throughput | 246 req/s
| |||||
Completed sessions | 118
| |||||
Total time | 37434 seconds
| |||||
Average session time | 317 seconds
| |||||
| State name | % of total | Count | Errors | Minimum Time | Maximum Time | Average Time |
|---|---|---|---|---|---|---|
Home | 5 % | 15067 | 0 | 0 ms | 45002 ms | 967 ms
|
Register | 1 % | 3017 | 0 | 0 ms | 21196 ms | 290 ms
|
RegisterUser | 1 % | 2943 | 40 | 4 ms | 21212 ms | 196 ms
|
Browse | 7 % | 21269 | 0 | 0 ms | 22863 ms | 269 ms
|
BrowseCategories | 5 % | 14755 | 0 | 3 ms | 21326 ms | 191 ms
|
SearchItemsInCategory | 15 % | 44528 | 0 | 0 ms | 30965 ms | 133 ms
|
BrowseRegions | 2 % | 6030 | 0 | 3 ms | 22860 ms | 186 ms
|
BrowseCategoriesInRegion | 2 % | 5854 | 0 | 3 ms | 22872 ms | 201 ms
|
SearchItemsInRegion | 4 % | 13896 | 0 | 0 ms | 21374 ms | 133 ms
|
ViewItem | 13 % | 39383 | 0 | 3 ms | 21283 ms | 113 ms
|
ViewUserInfo | 3 % | 8557 | 0 | 3 ms | 21053 ms | 90 ms
|
ViewBidHistory | 1 % | 4556 | 0 | 3 ms | 21170 ms | 135 ms
|
BuyNowAuth | 1 % | 3595 | 0 | 2 ms | 21349 ms | 116 ms
|
BuyNow | 1 % | 3486 | 476 | 4 ms | 21118 ms | 81 ms
|
StoreBuyBow | 1 % | 2910 | 1 | 4 ms | 21110 ms | 74 ms
|
PutBidAuth | 4 % | 13589 | 0 | 0 ms | 21248 ms | 107 ms
|
PutBid | 5 % | 15237 | 1853 | 0 ms | 22867 ms | 93 ms
|
StoreBid | 3 % | 9820 | 3 | 4 ms | 27946 ms | 75 ms
|
PutCommentAuth | 0 % | 0 | 0 | 0 ms | 0 ms | 0 ms
|
PutComment | 0 % | 1254 | 103 | 3 ms | 21015 ms | 85 ms
|
StoreComment | 0 % | 1123 | 0 | 4 ms | 21017 ms | 113 ms
|
Sell | 0 % | 1660 | 0 | 0 ms | 21043 ms | 199 ms
|
SelectCategoryToSellItem | 0 % | 1615 | 0 | 3 ms | 21011 ms | 215 ms
|
SellItemForm | 0 % | 1573 | 0 | 2 ms | 21023 ms | 202 ms
|
RegisterItem | 0 % | 1533 | 0 | 4 ms | 21369 ms | 172 ms
|
AboutMe (auth form) | 1 % | 4954 | 0 | 0 ms | 27944 ms | 251 ms
|
AboutMe | 2 % | 8098 | 0 | 4 ms | 21352 ms | 192 ms
|
Back probability | 10 % | 28354 | 0 | 0 ms | 0 ms | 0 ms
|
End of Session | 1 % | 3955 | 0 | 0 ms | 0 ms | 0 ms
|
Total | 100 % | 282611 | 2476 | - | - | 173 ms
|
Average throughput | 475 req/s
| |||||
Completed sessions | 3955
| |||||
Total time | 897392 seconds
| |||||
Average session time | 226 seconds
| |||||
An error occured while waiting for remote processes termination (Skipping waits)
Command is: /usr/bin/scp farm6.csail.mit.edu:/tmp/client1 /home/drkp/sandbox/txcache/src/RUBiS-1.4.3/bench/2009-3-19@14:59:19//client1.bin
Command is: /usr/bin/ssh -x localhost /bin/bash -c 'LANG=en_GB.UTF-8 /usr/bin/sar -n DEV -n SOCK -rubcw 1 605 -f /home/drkp/sandbox/txcache/src/RUBiS-1.4.3/bench/2009-3-19@14:59:19//client1.bin > /home/drkp/sandbox/txcache/src/RUBiS-1.4.3/bench/2009-3-19@14:59:19//client1'
Command is: /usr/bin/scp farm14:/tmp/db_server0 /home/drkp/sandbox/txcache/src/RUBiS-1.4.3/bench/2009-3-19@14:59:19//db_server0.bin
Command is: /usr/bin/ssh -x localhost /bin/bash -c 'LANG=en_GB.UTF-8 /usr/bin/sar -n DEV -n SOCK -rubcw 1 605 -f /home/drkp/sandbox/txcache/src/RUBiS-1.4.3/bench/2009-3-19@14:59:19//db_server0.bin > /home/drkp/sandbox/txcache/src/RUBiS-1.4.3/bench/2009-3-19@14:59:19//db_server0'
Command is: /usr/bin/scp farm12.csail.mit.edu:/tmp/web_server0 /home/drkp/sandbox/txcache/src/RUBiS-1.4.3/bench/2009-3-19@14:59:19//web_server0.bin
Command is: /usr/bin/ssh -x localhost /bin/bash -c 'LANG=en_GB.UTF-8 /usr/bin/sar -n DEV -n SOCK -rubcw 1 605 -f /home/drkp/sandbox/txcache/src/RUBiS-1.4.3/bench/2009-3-19@14:59:19//web_server0.bin > /home/drkp/sandbox/txcache/src/RUBiS-1.4.3/bench/2009-3-19@14:59:19//web_server0'
Command is: /usr/bin/scp farm13.csail.mit.edu:/tmp/web_server1 /home/drkp/sandbox/txcache/src/RUBiS-1.4.3/bench/2009-3-19@14:59:19//web_server1.bin
Command is: /usr/bin/ssh -x localhost /bin/bash -c 'LANG=en_GB.UTF-8 /usr/bin/sar -n DEV -n SOCK -rubcw 1 605 -f /home/drkp/sandbox/txcache/src/RUBiS-1.4.3/bench/2009-3-19@14:59:19//web_server1.bin > /home/drkp/sandbox/txcache/src/RUBiS-1.4.3/bench/2009-3-19@14:59:19//web_server1'
Command is: /usr/bin/scp localhost:/tmp/client0 /home/drkp/sandbox/txcache/src/RUBiS-1.4.3/bench/2009-3-19@14:59:19//client0.bin
Command is: /usr/bin/ssh -x localhost /bin/bash -c 'LANG=en_GB.UTF-8 /usr/bin/sar -n DEV -n SOCK -rubcw 1 605 -f /home/drkp/sandbox/txcache/src/RUBiS-1.4.3/bench/2009-3-19@14:59:19//client0.bin > /home/drkp/sandbox/txcache/src/RUBiS-1.4.3/bench/2009-3-19@14:59:19//client0'
Command is: /usr/bin/scp farm6.csail.mit.edu:/tmp/trace_client1.html /home/drkp/sandbox/txcache/src/RUBiS-1.4.3/bench/2009-3-19@14:59:19//
Command is: /usr/bin/scp farm6.csail.mit.edu:/tmp/stat_client1.html /home/drkp/sandbox/txcache/src/RUBiS-1.4.3/bench/2009-3-19@14:59:19//
|
|
|
|
|
|
 | 
|
 | 
|
 | 
|
 | 
|
 | 
|
 | 
|
 | 
|
 | 
|
 | 
|