Node information
Test timing information
Up ramp statistics
Runtime session statistics
Down ramp statistics
Overall statistics
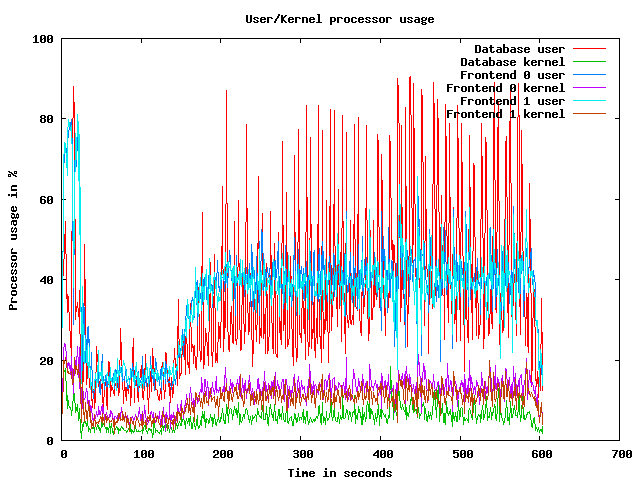
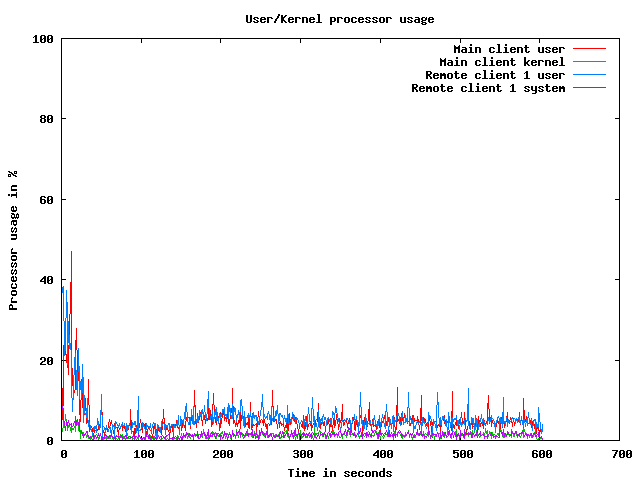
CPU usage graphs
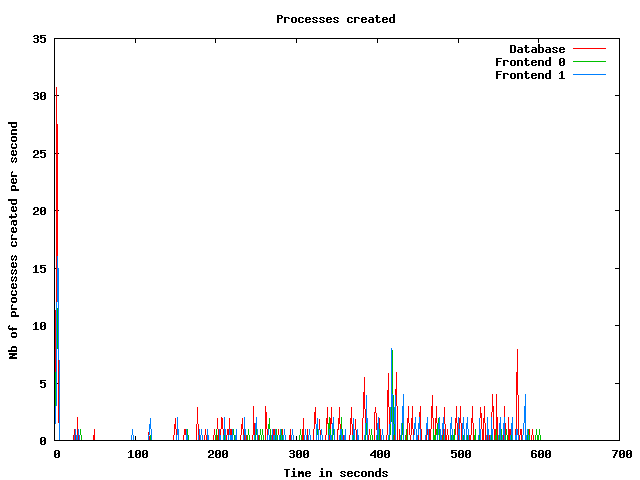
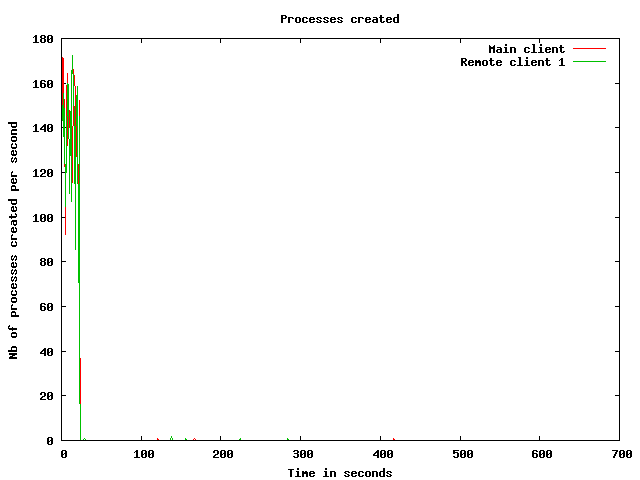
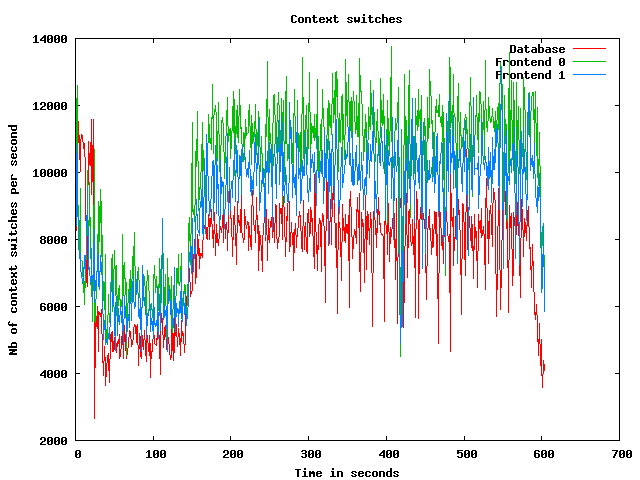
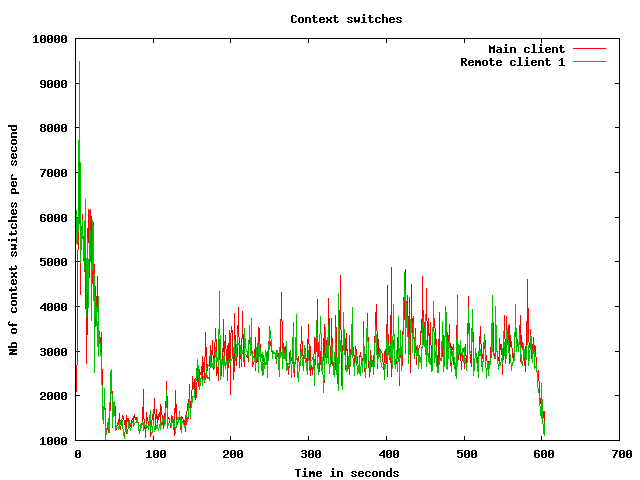
Processes usage graphs
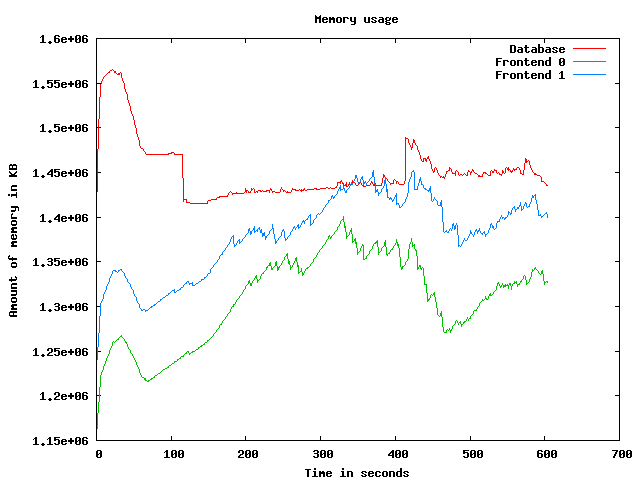
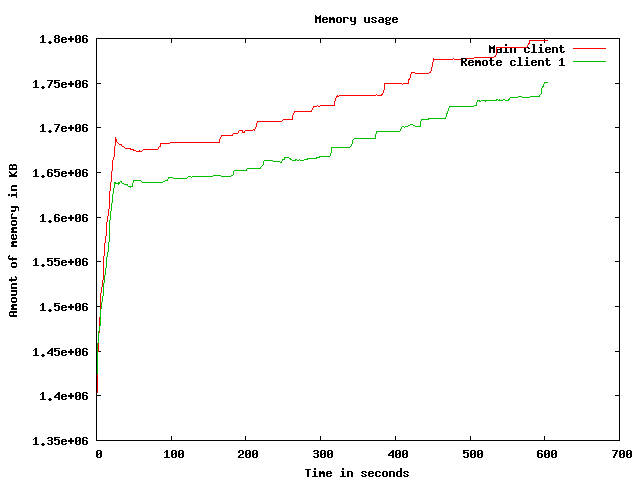
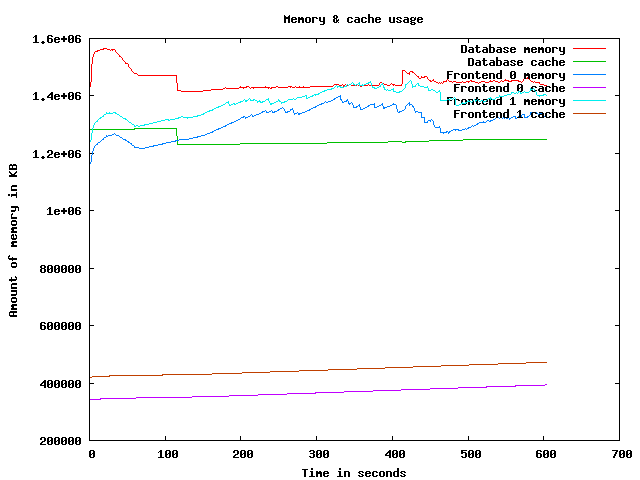
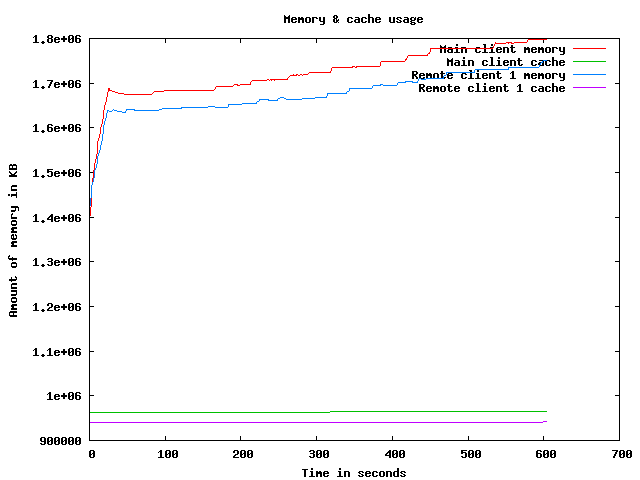
Memory usage graph
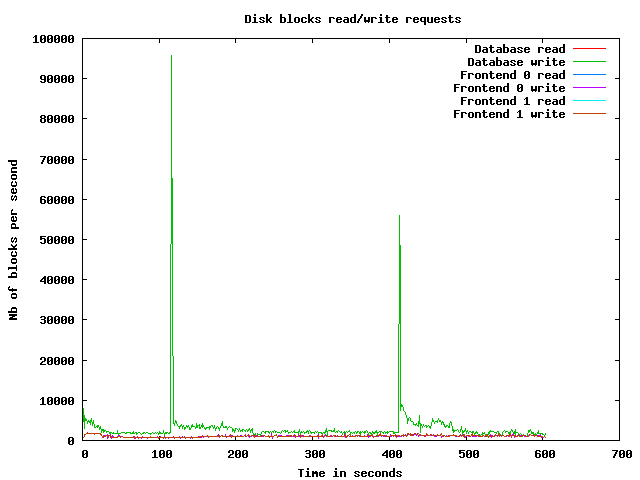
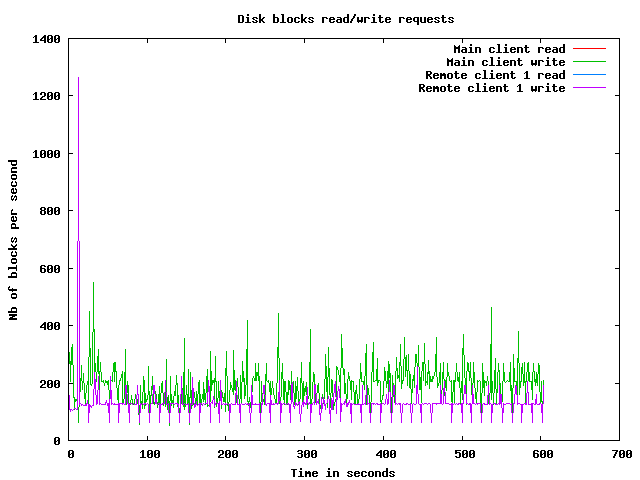
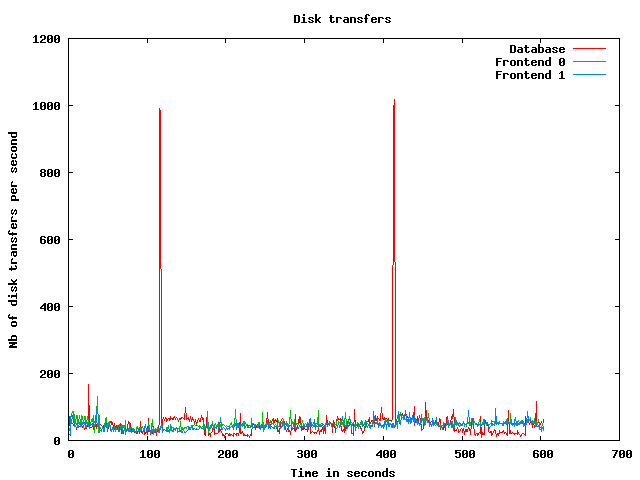
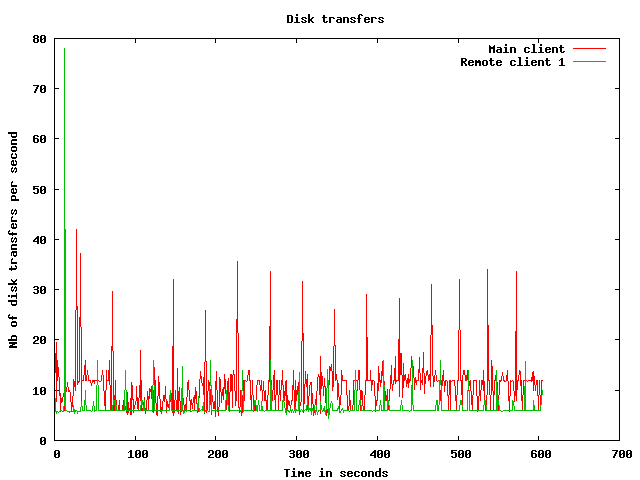
Disk usage graphs
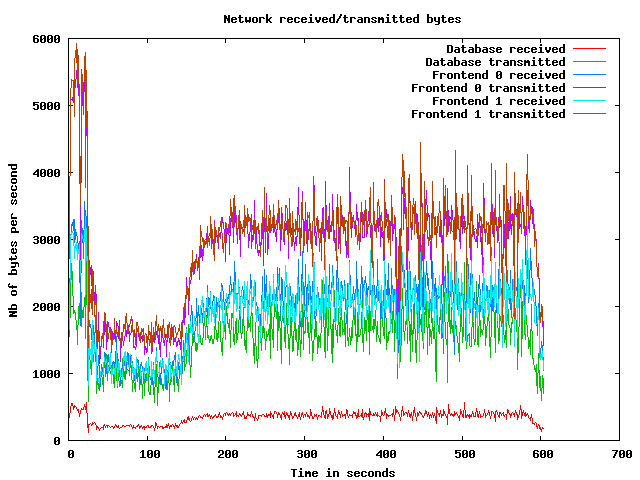
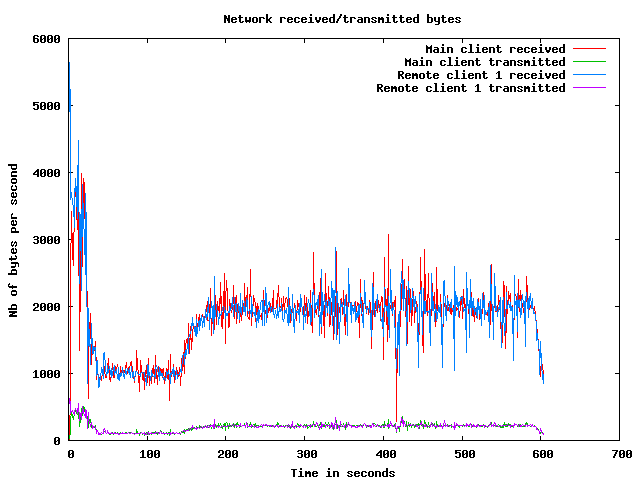
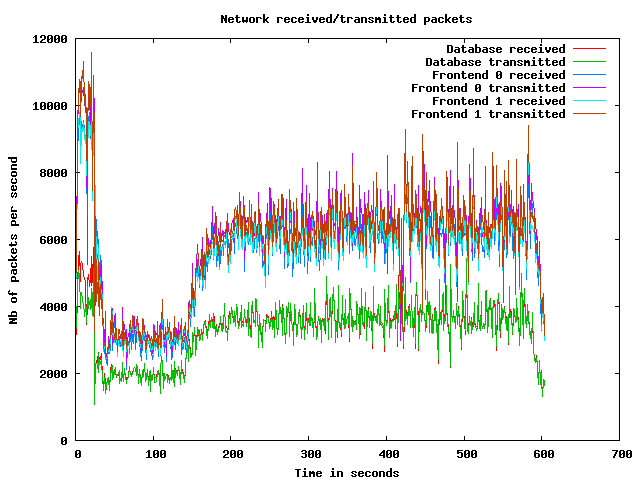
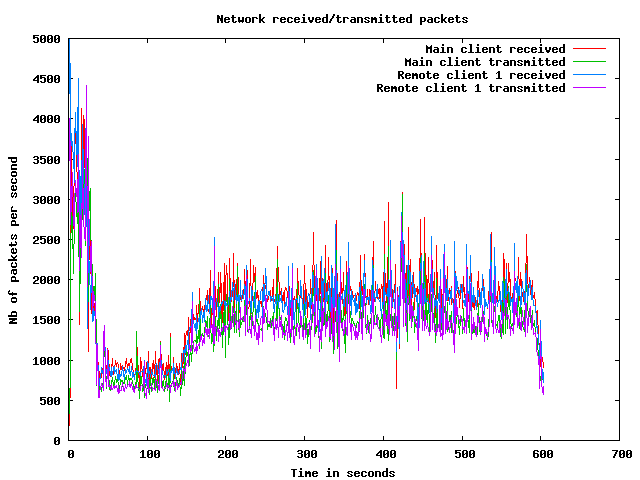
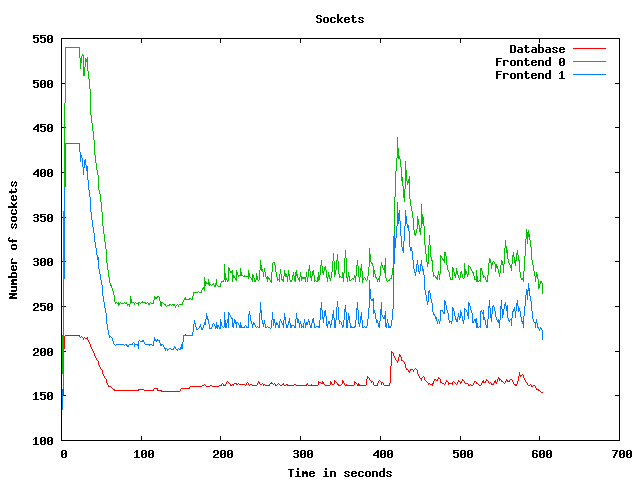
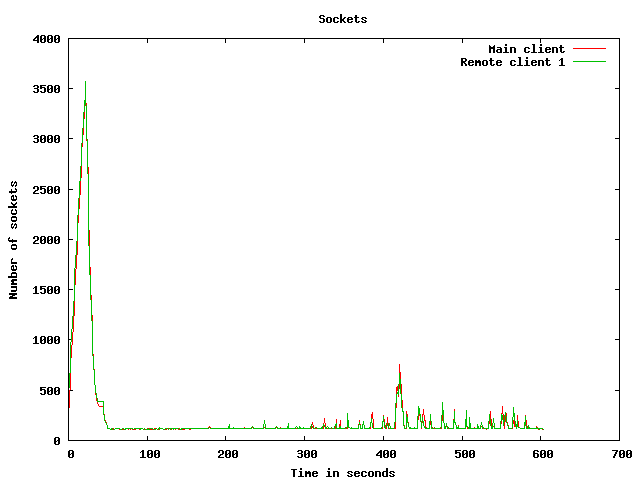
Network usage graphs
| Test start | 2009-3-19 15:12:22 |
| Up ramp start | 2009-3-19 15:12:47 |
| Runtime session start | 2009-3-19 15:14:47 |
| Down ramp start | 2009-3-19 15:22:17 |
| Test end | 2009-3-19 15:24:53 |
| Up ramp length | 2 minutes 1 millisecond (requested 120000 ms) |
| Runtime session length | 7 minutes 30 seconds 0 millisecond (requested 450000 ms) |
| Down ramp length | 30 seconds 0 millisecond (requested 30000 ms) |
| Total test length | 12 minutes 31 seconds 41 milliseconds |
| State name | % of total | Count | Errors | Minimum Time | Maximum Time | Average Time |
|---|---|---|---|---|---|---|
Home | 9 % | 5574 | 0 | 0 ms | 45028 ms | 3893 ms
|
Register | 1 % | 757 | 0 | 0 ms | 21507 ms | 1538 ms
|
RegisterUser | 1 % | 704 | 13 | 5 ms | 45004 ms | 711 ms
|
Browse | 9 % | 5731 | 0 | 0 ms | 45009 ms | 1289 ms
|
BrowseCategories | 6 % | 3790 | 0 | 3 ms | 45031 ms | 915 ms
|
SearchItemsInCategory | 14 % | 8846 | 0 | 3 ms | 45010 ms | 788 ms
|
BrowseRegions | 2 % | 1578 | 0 | 3 ms | 44998 ms | 925 ms
|
BrowseCategoriesInRegion | 2 % | 1478 | 0 | 3 ms | 45004 ms | 887 ms
|
SearchItemsInRegion | 4 % | 2948 | 0 | 0 ms | 45012 ms | 787 ms
|
ViewItem | 12 % | 7521 | 0 | 3 ms | 45005 ms | 711 ms
|
ViewUserInfo | 2 % | 1322 | 0 | 3 ms | 23047 ms | 639 ms
|
ViewBidHistory | 1 % | 698 | 0 | 3 ms | 45011 ms | 656 ms
|
BuyNowAuth | 1 % | 667 | 0 | 2 ms | 21507 ms | 595 ms
|
BuyNow | 0 % | 592 | 95 | 5 ms | 21637 ms | 536 ms
|
StoreBuyBow | 0 % | 426 | 0 | 4 ms | 21416 ms | 651 ms
|
PutBidAuth | 4 % | 2539 | 0 | 0 ms | 45003 ms | 624 ms
|
PutBid | 4 % | 2531 | 319 | 4 ms | 45017 ms | 595 ms
|
StoreBid | 2 % | 1511 | 0 | 4 ms | 21914 ms | 615 ms
|
PutCommentAuth | 0 % | 0 | 0 | 0 ms | 0 ms | 0 ms
|
PutComment | 0 % | 228 | 21 | 4 ms | 45006 ms | 861 ms
|
StoreComment | 0 % | 180 | 0 | 5 ms | 21179 ms | 933 ms
|
Sell | 0 % | 418 | 0 | 0 ms | 30937 ms | 1057 ms
|
SelectCategoryToSellItem | 0 % | 396 | 0 | 4 ms | 22882 ms | 884 ms
|
SellItemForm | 0 % | 365 | 0 | 2 ms | 45001 ms | 813 ms
|
RegisterItem | 0 % | 345 | 0 | 4 ms | 21255 ms | 845 ms
|
AboutMe (auth form) | 2 % | 1279 | 0 | 0 ms | 45006 ms | 1443 ms
|
AboutMe | 2 % | 1769 | 0 | 4 ms | 45021 ms | 924 ms
|
Back probability | 7 % | 4695 | 0 | 0 ms | 0 ms | 0 ms
|
End of Session | 1 % | 598 | 0 | 0 ms | 0 ms | 0 ms
|
Total | 100 % | 59486 | 448 | - | - | 1054 ms
|
Average throughput | 499 req/s
| |||||
Completed sessions | 558
| |||||
Total time | 28952 seconds
| |||||
Average session time | 51 seconds
| |||||
| State name | % of total | Count | Errors | Minimum Time | Maximum Time | Average Time |
|---|---|---|---|---|---|---|
Home | 4 % | 11255 | 0 | 0 ms | 9019 ms | 13 ms
|
Register | 1 % | 2662 | 0 | 0 ms | 9095 ms | 42 ms
|
RegisterUser | 1 % | 2603 | 66 | 5 ms | 9053 ms | 54 ms
|
Browse | 7 % | 18178 | 0 | 0 ms | 9095 ms | 44 ms
|
BrowseCategories | 4 % | 12746 | 0 | 3 ms | 9125 ms | 51 ms
|
SearchItemsInCategory | 15 % | 40165 | 0 | 0 ms | 9155 ms | 57 ms
|
BrowseRegions | 2 % | 5233 | 0 | 3 ms | 9093 ms | 53 ms
|
BrowseCategoriesInRegion | 1 % | 5125 | 0 | 3 ms | 9024 ms | 49 ms
|
SearchItemsInRegion | 5 % | 12933 | 0 | 0 ms | 9063 ms | 65 ms
|
ViewItem | 14 % | 36702 | 0 | 3 ms | 9137 ms | 55 ms
|
ViewUserInfo | 3 % | 8520 | 0 | 3 ms | 9125 ms | 55 ms
|
ViewBidHistory | 1 % | 4405 | 0 | 3 ms | 9571 ms | 112 ms
|
BuyNowAuth | 1 % | 3335 | 0 | 2 ms | 9000 ms | 37 ms
|
BuyNow | 1 % | 3286 | 476 | 3 ms | 9173 ms | 48 ms
|
StoreBuyBow | 1 % | 2773 | 1 | 4 ms | 4974 ms | 55 ms
|
PutBidAuth | 4 % | 12763 | 0 | 0 ms | 9074 ms | 41 ms
|
PutBid | 5 % | 14564 | 1681 | 3 ms | 9136 ms | 57 ms
|
StoreBid | 3 % | 9530 | 3 | 4 ms | 9106 ms | 52 ms
|
PutCommentAuth | 0 % | 0 | 0 | 0 ms | 0 ms | 0 ms
|
PutComment | 0 % | 1417 | 110 | 3 ms | 9088 ms | 59 ms
|
StoreComment | 0 % | 1286 | 0 | 4 ms | 4909 ms | 50 ms
|
Sell | 0 % | 1463 | 0 | 0 ms | 9006 ms | 53 ms
|
SelectCategoryToSellItem | 0 % | 1440 | 0 | 3 ms | 9128 ms | 57 ms
|
SellItemForm | 0 % | 1420 | 0 | 2 ms | 3084 ms | 50 ms
|
RegisterItem | 0 % | 1388 | 0 | 4 ms | 3134 ms | 46 ms
|
AboutMe (auth form) | 1 % | 4276 | 0 | 0 ms | 9085 ms | 52 ms
|
AboutMe | 2 % | 7307 | 0 | 4 ms | 9195 ms | 84 ms
|
Back probability | 10 % | 27087 | 0 | 0 ms | 0 ms | 0 ms
|
End of Session | 1 % | 3809 | 0 | 0 ms | 0 ms | 0 ms
|
Total | 100 % | 257671 | 2337 | - | - | 46 ms
|
Average throughput | 577 req/s
| |||||
Completed sessions | 3799
| |||||
Total time | 947804 seconds
| |||||
Average session time | 249 seconds
| |||||
| State name | % of total | Count | Errors | Minimum Time | Maximum Time | Average Time |
|---|---|---|---|---|---|---|
Home | 4 % | 357 | 0 | 0 ms | 359 ms | 2 ms
|
Register | 0 % | 79 | 0 | 0 ms | 9 ms | 1 ms
|
RegisterUser | 0 % | 75 | 2 | 5 ms | 383 ms | 15 ms
|
Browse | 6 % | 589 | 0 | 0 ms | 370 ms | 2 ms
|
BrowseCategories | 4 % | 415 | 0 | 3 ms | 367 ms | 8 ms
|
SearchItemsInCategory | 15 % | 1329 | 0 | 3 ms | 552 ms | 15 ms
|
BrowseRegions | 2 % | 173 | 0 | 3 ms | 353 ms | 9 ms
|
BrowseCategoriesInRegion | 2 % | 191 | 0 | 3 ms | 40 ms | 5 ms
|
SearchItemsInRegion | 5 % | 433 | 0 | 0 ms | 778 ms | 22 ms
|
ViewItem | 14 % | 1261 | 0 | 3 ms | 441 ms | 13 ms
|
ViewUserInfo | 3 % | 283 | 0 | 3 ms | 440 ms | 12 ms
|
ViewBidHistory | 1 % | 146 | 0 | 4 ms | 269 ms | 47 ms
|
BuyNowAuth | 1 % | 121 | 0 | 2 ms | 34 ms | 4 ms
|
BuyNow | 1 % | 126 | 18 | 4 ms | 57 ms | 11 ms
|
StoreBuyBow | 1 % | 108 | 0 | 4 ms | 43 ms | 10 ms
|
PutBidAuth | 4 % | 394 | 0 | 0 ms | 377 ms | 7 ms
|
PutBid | 5 % | 495 | 60 | 3 ms | 158 ms | 12 ms
|
StoreBid | 3 % | 318 | 0 | 4 ms | 389 ms | 13 ms
|
PutCommentAuth | 0 % | 0 | 0 | 0 ms | 0 ms | 0 ms
|
PutComment | 0 % | 40 | 5 | 4 ms | 25 ms | 10 ms
|
StoreComment | 0 % | 39 | 0 | 4 ms | 28 ms | 10 ms
|
Sell | 0 % | 40 | 0 | 0 ms | 33 ms | 2 ms
|
SelectCategoryToSellItem | 0 % | 40 | 0 | 5 ms | 389 ms | 20 ms
|
SellItemForm | 0 % | 39 | 0 | 2 ms | 280 ms | 10 ms
|
RegisterItem | 0 % | 37 | 0 | 4 ms | 31 ms | 8 ms
|
AboutMe (auth form) | 1 % | 133 | 0 | 0 ms | 7 ms | 0 ms
|
AboutMe | 2 % | 251 | 0 | 4 ms | 444 ms | 37 ms
|
Back probability | 10 % | 923 | 0 | 0 ms | 0 ms | 0 ms
|
End of Session | 1 % | 124 | 0 | 0 ms | 0 ms | 0 ms
|
Total | 100 % | 8559 | 85 | - | - | 11 ms
|
Average throughput | 288 req/s
| |||||
Completed sessions | 103
| |||||
Total time | 33004 seconds
| |||||
Average session time | 320 seconds
| |||||
| State name | % of total | Count | Errors | Minimum Time | Maximum Time | Average Time |
|---|---|---|---|---|---|---|
Home | 5 % | 17186 | 0 | 0 ms | 45028 ms | 1271 ms
|
Register | 1 % | 3498 | 0 | 0 ms | 21507 ms | 364 ms
|
RegisterUser | 1 % | 3382 | 81 | 5 ms | 45004 ms | 190 ms
|
Browse | 7 % | 24499 | 0 | 0 ms | 45009 ms | 334 ms
|
BrowseCategories | 5 % | 16951 | 0 | 3 ms | 45031 ms | 243 ms
|
SearchItemsInCategory | 15 % | 50546 | 0 | 0 ms | 45010 ms | 184 ms
|
BrowseRegions | 2 % | 6984 | 0 | 3 ms | 44998 ms | 249 ms
|
BrowseCategoriesInRegion | 2 % | 6794 | 0 | 3 ms | 45004 ms | 230 ms
|
SearchItemsInRegion | 5 % | 16348 | 0 | 0 ms | 45012 ms | 194 ms
|
ViewItem | 13 % | 45561 | 0 | 3 ms | 45005 ms | 162 ms
|
ViewUserInfo | 3 % | 10146 | 0 | 3 ms | 23047 ms | 130 ms
|
ViewBidHistory | 1 % | 5267 | 0 | 3 ms | 45011 ms | 182 ms
|
BuyNowAuth | 1 % | 4123 | 0 | 2 ms | 21507 ms | 127 ms
|
BuyNow | 1 % | 4004 | 589 | 3 ms | 21637 ms | 119 ms
|
StoreBuyBow | 1 % | 3307 | 1 | 4 ms | 21416 ms | 130 ms
|
PutBidAuth | 4 % | 15696 | 0 | 0 ms | 45003 ms | 134 ms
|
PutBid | 5 % | 17625 | 2060 | 3 ms | 45017 ms | 133 ms
|
StoreBid | 3 % | 11360 | 3 | 4 ms | 21914 ms | 126 ms
|
PutCommentAuth | 0 % | 0 | 0 | 0 ms | 0 ms | 0 ms
|
PutComment | 0 % | 1685 | 136 | 3 ms | 45006 ms | 167 ms
|
StoreComment | 0 % | 1505 | 0 | 4 ms | 21179 ms | 155 ms
|
Sell | 0 % | 1921 | 0 | 0 ms | 30937 ms | 270 ms
|
SelectCategoryToSellItem | 0 % | 1876 | 0 | 3 ms | 22882 ms | 231 ms
|
SellItemForm | 0 % | 1824 | 0 | 2 ms | 45001 ms | 201 ms
|
RegisterItem | 0 % | 1770 | 0 | 4 ms | 21255 ms | 201 ms
|
AboutMe (auth form) | 1 % | 5688 | 0 | 0 ms | 45006 ms | 364 ms
|
AboutMe | 2 % | 9388 | 0 | 4 ms | 45021 ms | 241 ms
|
Back probability | 10 % | 32705 | 0 | 0 ms | 0 ms | 0 ms
|
End of Session | 1 % | 4531 | 0 | 0 ms | 0 ms | 0 ms
|
Total | 100 % | 326170 | 2870 | - | - | 229 ms
|
Average throughput | 548 req/s
| |||||
Completed sessions | 4531
| |||||
Total time | 1033039 seconds
| |||||
Average session time | 227 seconds
| |||||
An error occured while waiting for remote processes termination (Skipping waits)
Command is: /usr/bin/scp farm6.csail.mit.edu:/tmp/client1 /home/drkp/sandbox/txcache/src/RUBiS-1.4.3/bench/2009-3-19@15:12:22//client1.bin
Command is: /usr/bin/ssh -x localhost /bin/bash -c 'LANG=en_GB.UTF-8 /usr/bin/sar -n DEV -n SOCK -rubcw 1 605 -f /home/drkp/sandbox/txcache/src/RUBiS-1.4.3/bench/2009-3-19@15:12:22//client1.bin > /home/drkp/sandbox/txcache/src/RUBiS-1.4.3/bench/2009-3-19@15:12:22//client1'
Command is: /usr/bin/scp farm14:/tmp/db_server0 /home/drkp/sandbox/txcache/src/RUBiS-1.4.3/bench/2009-3-19@15:12:22//db_server0.bin
Command is: /usr/bin/ssh -x localhost /bin/bash -c 'LANG=en_GB.UTF-8 /usr/bin/sar -n DEV -n SOCK -rubcw 1 605 -f /home/drkp/sandbox/txcache/src/RUBiS-1.4.3/bench/2009-3-19@15:12:22//db_server0.bin > /home/drkp/sandbox/txcache/src/RUBiS-1.4.3/bench/2009-3-19@15:12:22//db_server0'
Command is: /usr/bin/scp farm12.csail.mit.edu:/tmp/web_server0 /home/drkp/sandbox/txcache/src/RUBiS-1.4.3/bench/2009-3-19@15:12:22//web_server0.bin
Command is: /usr/bin/ssh -x localhost /bin/bash -c 'LANG=en_GB.UTF-8 /usr/bin/sar -n DEV -n SOCK -rubcw 1 605 -f /home/drkp/sandbox/txcache/src/RUBiS-1.4.3/bench/2009-3-19@15:12:22//web_server0.bin > /home/drkp/sandbox/txcache/src/RUBiS-1.4.3/bench/2009-3-19@15:12:22//web_server0'
Command is: /usr/bin/scp farm13.csail.mit.edu:/tmp/web_server1 /home/drkp/sandbox/txcache/src/RUBiS-1.4.3/bench/2009-3-19@15:12:22//web_server1.bin
Command is: /usr/bin/ssh -x localhost /bin/bash -c 'LANG=en_GB.UTF-8 /usr/bin/sar -n DEV -n SOCK -rubcw 1 605 -f /home/drkp/sandbox/txcache/src/RUBiS-1.4.3/bench/2009-3-19@15:12:22//web_server1.bin > /home/drkp/sandbox/txcache/src/RUBiS-1.4.3/bench/2009-3-19@15:12:22//web_server1'
Command is: /usr/bin/scp localhost:/tmp/client0 /home/drkp/sandbox/txcache/src/RUBiS-1.4.3/bench/2009-3-19@15:12:22//client0.bin
Command is: /usr/bin/ssh -x localhost /bin/bash -c 'LANG=en_GB.UTF-8 /usr/bin/sar -n DEV -n SOCK -rubcw 1 605 -f /home/drkp/sandbox/txcache/src/RUBiS-1.4.3/bench/2009-3-19@15:12:22//client0.bin > /home/drkp/sandbox/txcache/src/RUBiS-1.4.3/bench/2009-3-19@15:12:22//client0'
Command is: /usr/bin/scp farm6.csail.mit.edu:/tmp/trace_client1.html /home/drkp/sandbox/txcache/src/RUBiS-1.4.3/bench/2009-3-19@15:12:22//
Command is: /usr/bin/scp farm6.csail.mit.edu:/tmp/stat_client1.html /home/drkp/sandbox/txcache/src/RUBiS-1.4.3/bench/2009-3-19@15:12:22//
|
|
|
|
|
|
 | 
|
 | 
|
 | 
|
 | 
|
 | 
|
 | 
|
 | 
|
 | 
|
 | 
|