Node information
Test timing information
Up ramp statistics
Runtime session statistics
Down ramp statistics
Overall statistics
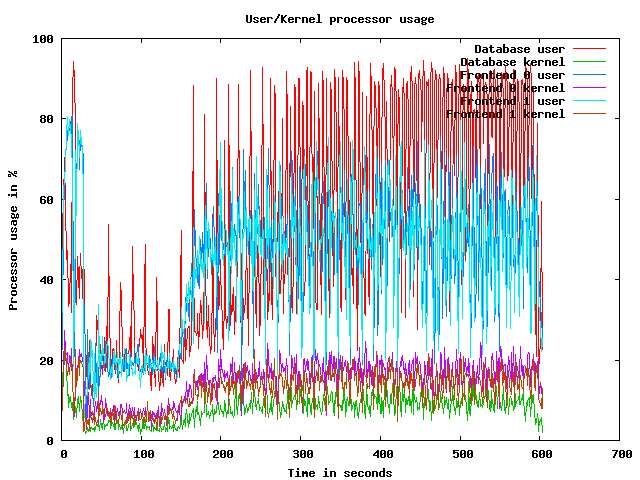
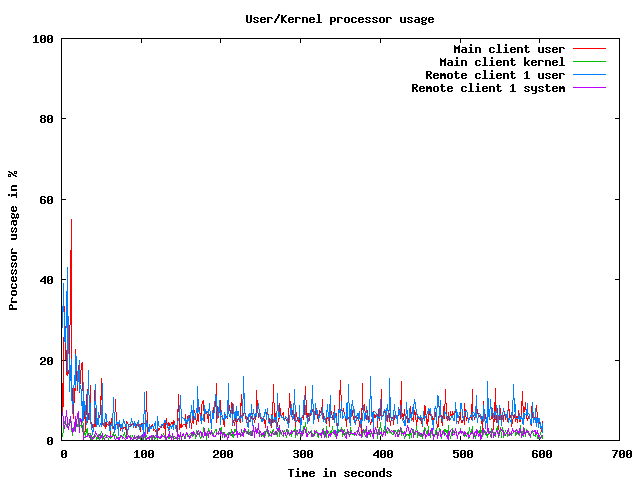
CPU usage graphs
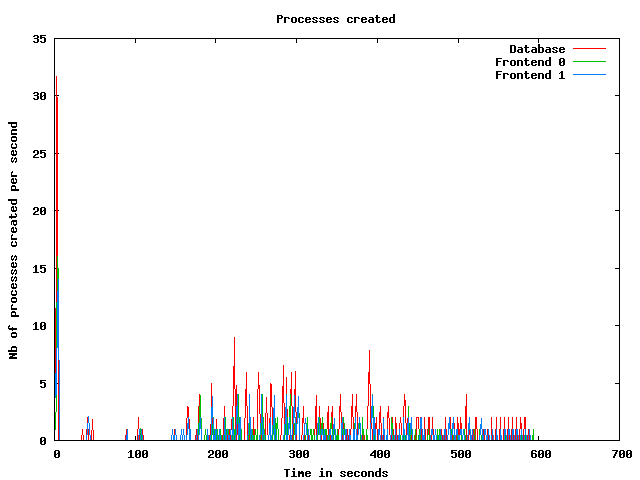
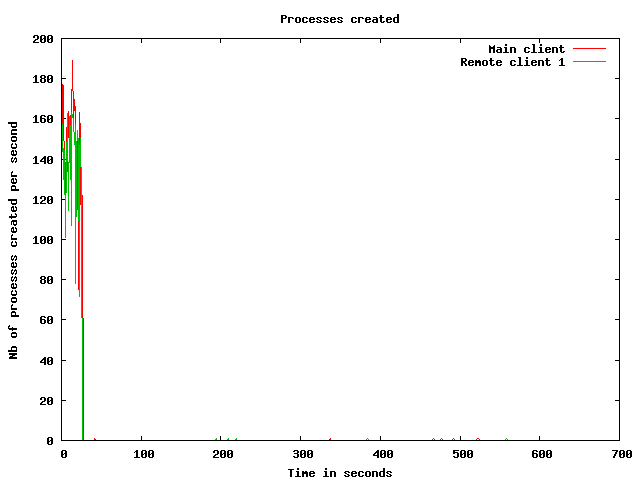
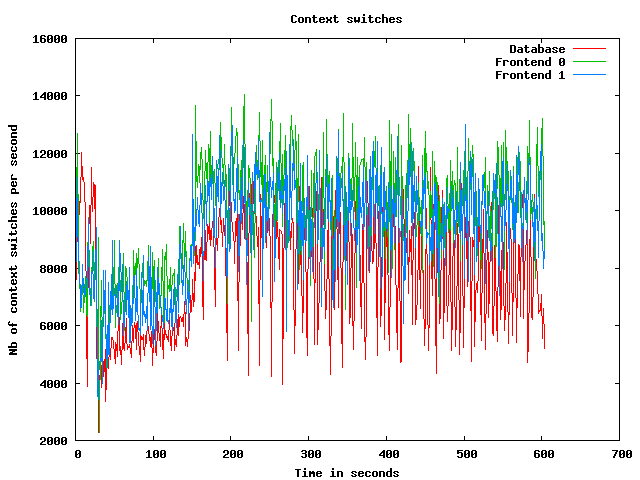
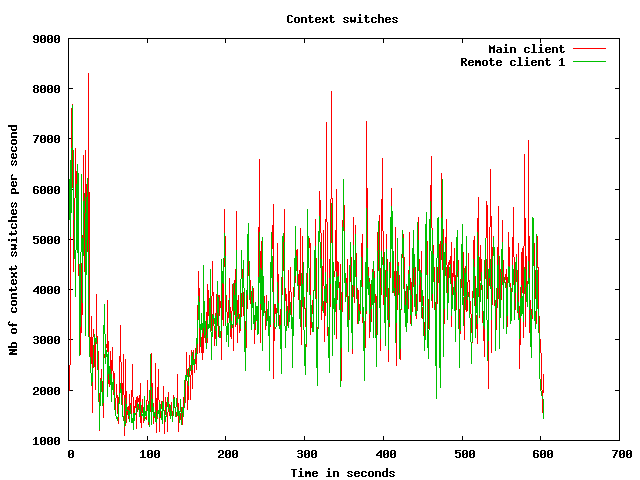
Processes usage graphs
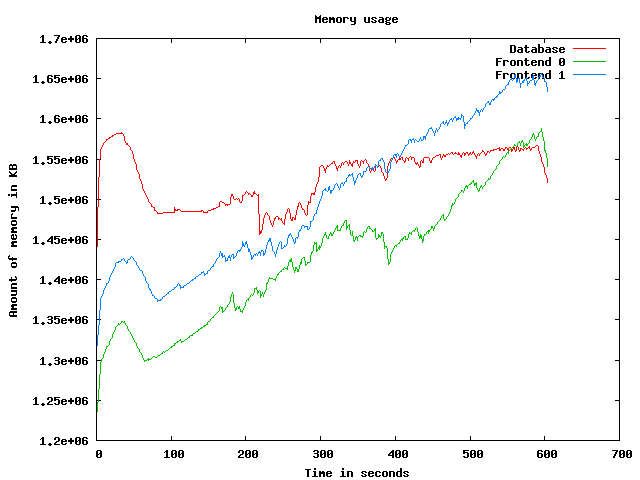
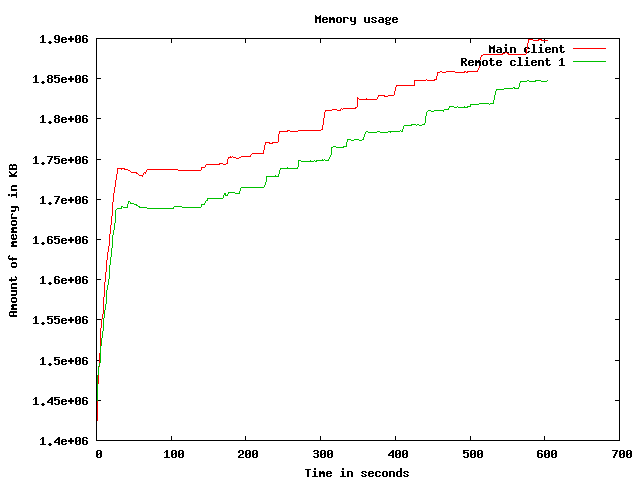
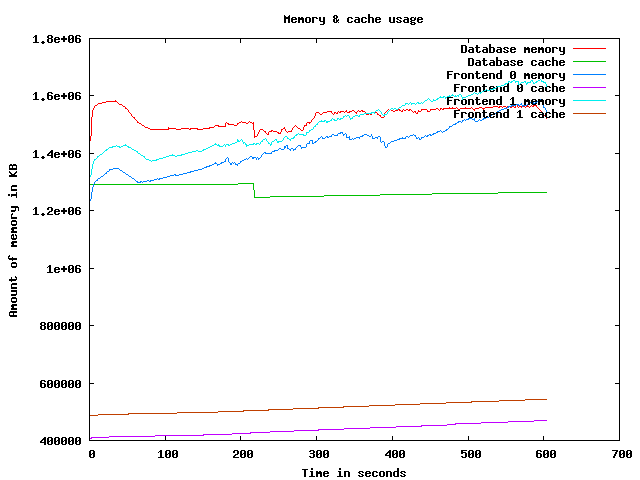
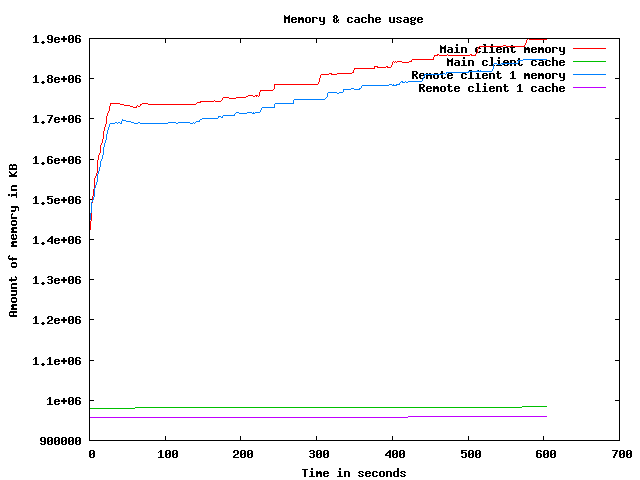
Memory usage graph
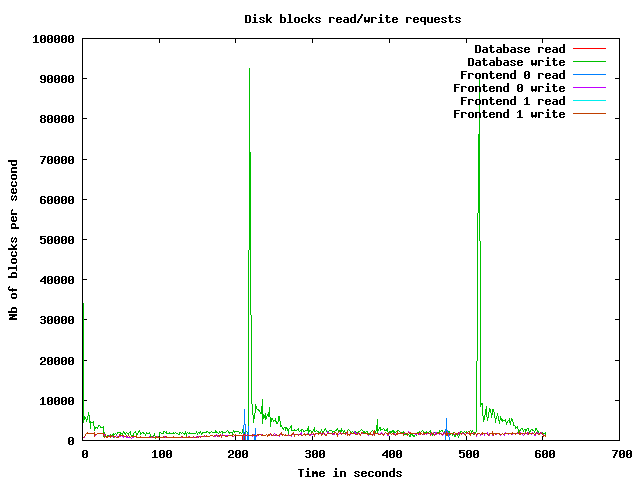
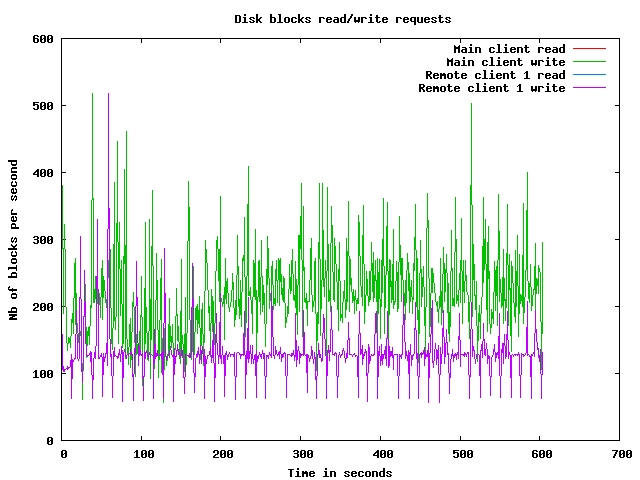
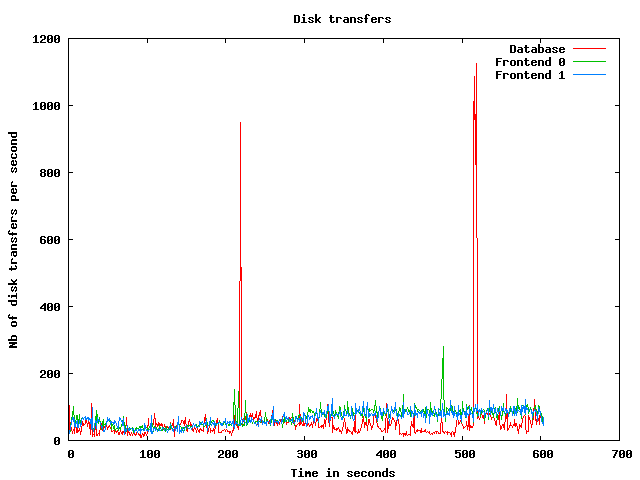
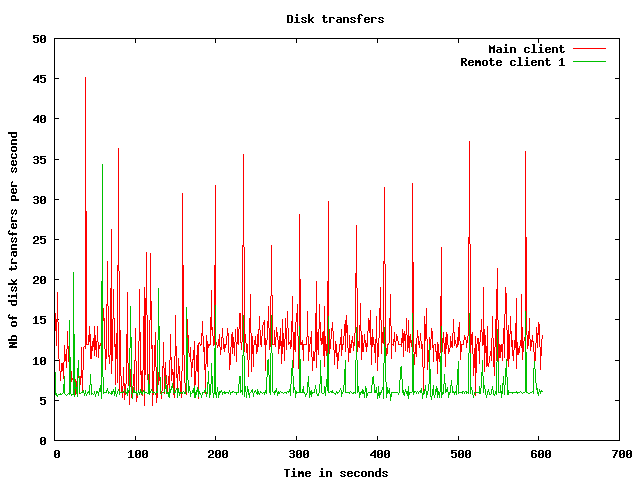
Disk usage graphs
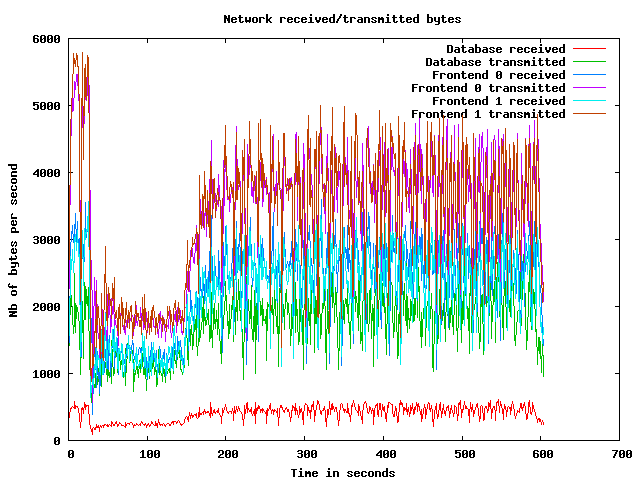
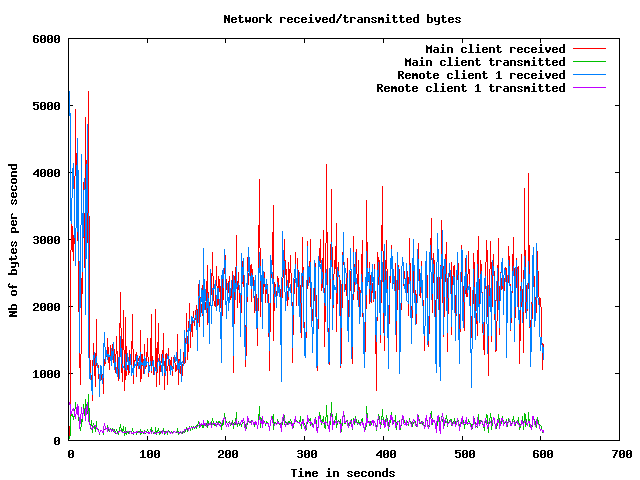
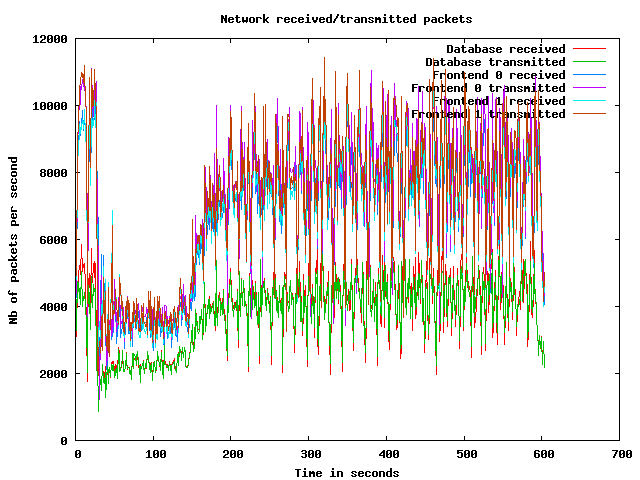
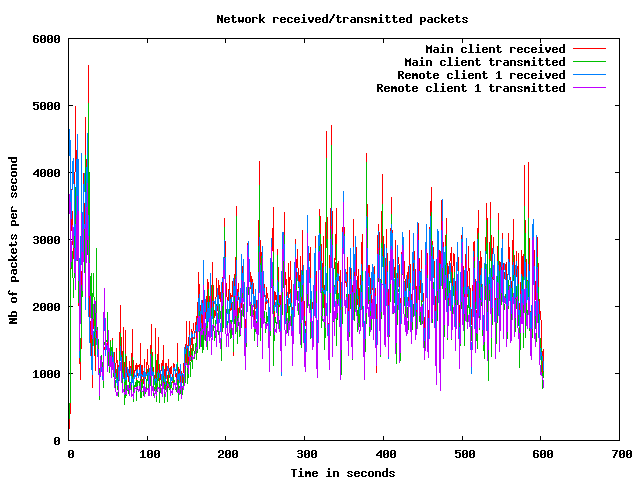
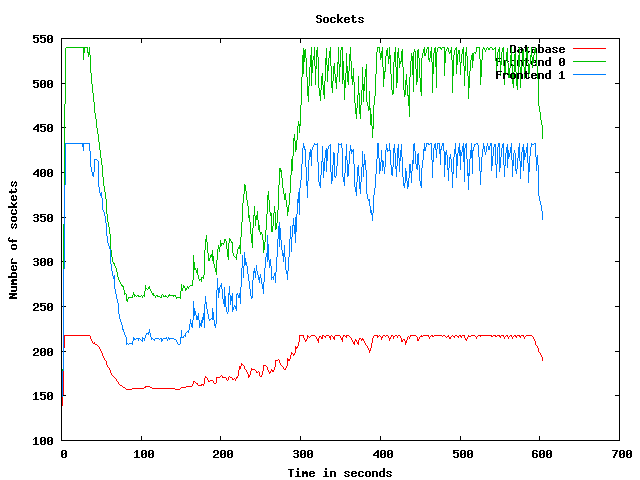
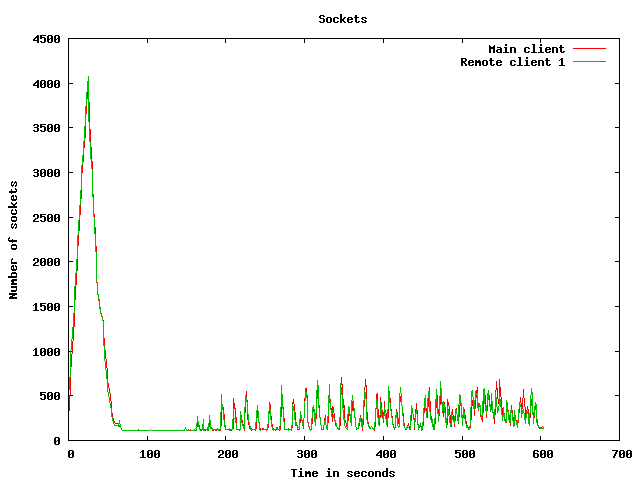
Network usage graphs
| Test start | 2009-3-19 15:25:40 |
| Up ramp start | 2009-3-19 15:26:9 |
| Runtime session start | 2009-3-19 15:28:9 |
| Down ramp start | 2009-3-19 15:35:39 |
| Test end | 2009-3-19 15:38:10 |
| Up ramp length | 2 minutes 0 millisecond (requested 120000 ms) |
| Runtime session length | 7 minutes 30 seconds 1 millisecond (requested 450000 ms) |
| Down ramp length | 30 seconds 0 millisecond (requested 30000 ms) |
| Total test length | 12 minutes 30 seconds 121 milliseconds |
| State name | % of total | Count | Errors | Minimum Time | Maximum Time | Average Time |
|---|---|---|---|---|---|---|
Home | 9 % | 6208 | 0 | 0 ms | 59134 ms | 5388 ms
|
Register | 1 % | 876 | 0 | 0 ms | 45127 ms | 1487 ms
|
RegisterUser | 1 % | 798 | 31 | 5 ms | 45117 ms | 1553 ms
|
Browse | 9 % | 6304 | 0 | 0 ms | 59246 ms | 1986 ms
|
BrowseCategories | 6 % | 4200 | 0 | 3 ms | 45474 ms | 1440 ms
|
SearchItemsInCategory | 14 % | 9721 | 0 | 3 ms | 59251 ms | 1265 ms
|
BrowseRegions | 2 % | 1695 | 0 | 3 ms | 45353 ms | 1628 ms
|
BrowseCategoriesInRegion | 2 % | 1585 | 0 | 3 ms | 45399 ms | 1543 ms
|
SearchItemsInRegion | 4 % | 3179 | 0 | 0 ms | 45370 ms | 975 ms
|
ViewItem | 12 % | 8136 | 0 | 3 ms | 59253 ms | 1129 ms
|
ViewUserInfo | 2 % | 1571 | 0 | 3 ms | 45038 ms | 863 ms
|
ViewBidHistory | 1 % | 700 | 0 | 3 ms | 45101 ms | 694 ms
|
BuyNowAuth | 1 % | 738 | 0 | 2 ms | 45382 ms | 1183 ms
|
BuyNow | 1 % | 680 | 94 | 4 ms | 45441 ms | 1319 ms
|
StoreBuyBow | 0 % | 519 | 0 | 5 ms | 45127 ms | 677 ms
|
PutBidAuth | 4 % | 2723 | 0 | 0 ms | 45382 ms | 1004 ms
|
PutBid | 4 % | 2663 | 335 | 3 ms | 56103 ms | 819 ms
|
StoreBid | 2 % | 1541 | 0 | 4 ms | 45028 ms | 756 ms
|
PutCommentAuth | 0 % | 0 | 0 | 0 ms | 0 ms | 0 ms
|
PutComment | 0 % | 237 | 19 | 4 ms | 45510 ms | 1035 ms
|
StoreComment | 0 % | 196 | 0 | 4 ms | 22858 ms | 489 ms
|
Sell | 0 % | 458 | 0 | 0 ms | 45389 ms | 2068 ms
|
SelectCategoryToSellItem | 0 % | 430 | 0 | 4 ms | 45009 ms | 1000 ms
|
SellItemForm | 0 % | 400 | 0 | 2 ms | 45007 ms | 1037 ms
|
RegisterItem | 0 % | 370 | 0 | 4 ms | 45013 ms | 1500 ms
|
AboutMe (auth form) | 2 % | 1404 | 0 | 0 ms | 45206 ms | 2039 ms
|
AboutMe | 3 % | 1999 | 0 | 4 ms | 45369 ms | 1449 ms
|
Back probability | 7 % | 5118 | 0 | 0 ms | 0 ms | 0 ms
|
End of Session | 1 % | 661 | 0 | 0 ms | 0 ms | 0 ms
|
Total | 100 % | 65110 | 479 | - | - | 1568 ms
|
Average throughput | 546 req/s
| |||||
Completed sessions | 612
| |||||
Total time | 35429 seconds
| |||||
Average session time | 57 seconds
| |||||
| State name | % of total | Count | Errors | Minimum Time | Maximum Time | Average Time |
|---|---|---|---|---|---|---|
Home | 4 % | 12197 | 0 | 0 ms | 20995 ms | 94 ms
|
Register | 1 % | 2982 | 0 | 0 ms | 22006 ms | 226 ms
|
RegisterUser | 1 % | 2964 | 97 | 5 ms | 9146 ms | 250 ms
|
Browse | 7 % | 20303 | 0 | 0 ms | 21168 ms | 203 ms
|
BrowseCategories | 4 % | 14254 | 0 | 3 ms | 21218 ms | 237 ms
|
SearchItemsInCategory | 15 % | 45176 | 0 | 1 ms | 46817 ms | 296 ms
|
BrowseRegions | 2 % | 5828 | 0 | 3 ms | 21045 ms | 252 ms
|
BrowseCategoriesInRegion | 2 % | 5723 | 0 | 3 ms | 21234 ms | 244 ms
|
SearchItemsInRegion | 5 % | 14587 | 0 | 0 ms | 46714 ms | 323 ms
|
ViewItem | 14 % | 40546 | 0 | 3 ms | 21253 ms | 247 ms
|
ViewUserInfo | 3 % | 9223 | 0 | 3 ms | 21115 ms | 252 ms
|
ViewBidHistory | 1 % | 4920 | 0 | 3 ms | 46636 ms | 430 ms
|
BuyNowAuth | 1 % | 3760 | 0 | 2 ms | 22002 ms | 219 ms
|
BuyNow | 1 % | 3683 | 542 | 5 ms | 21337 ms | 262 ms
|
StoreBuyBow | 1 % | 3100 | 4 | 5 ms | 10291 ms | 257 ms
|
PutBidAuth | 4 % | 14069 | 0 | 0 ms | 21036 ms | 215 ms
|
PutBid | 5 % | 16242 | 1745 | 4 ms | 21355 ms | 261 ms
|
StoreBid | 3 % | 10788 | 5 | 4 ms | 21430 ms | 249 ms
|
PutCommentAuth | 0 % | 0 | 0 | 0 ms | 0 ms | 0 ms
|
PutComment | 0 % | 1409 | 94 | 4 ms | 5164 ms | 227 ms
|
StoreComment | 0 % | 1289 | 0 | 5 ms | 11087 ms | 247 ms
|
Sell | 0 % | 1539 | 0 | 0 ms | 9002 ms | 237 ms
|
SelectCategoryToSellItem | 0 % | 1510 | 0 | 4 ms | 9745 ms | 248 ms
|
SellItemForm | 0 % | 1490 | 0 | 2 ms | 5723 ms | 213 ms
|
RegisterItem | 0 % | 1481 | 0 | 4 ms | 9162 ms | 251 ms
|
AboutMe (auth form) | 1 % | 4605 | 0 | 0 ms | 21203 ms | 220 ms
|
AboutMe | 2 % | 7877 | 0 | 4 ms | 21257 ms | 325 ms
|
Back probability | 10 % | 30082 | 0 | 0 ms | 0 ms | 0 ms
|
End of Session | 1 % | 4235 | 0 | 0 ms | 0 ms | 0 ms
|
Total | 100 % | 285862 | 2487 | - | - | 221 ms
|
Average throughput | 640 req/s
| |||||
Completed sessions | 4222
| |||||
Total time | 1057927 seconds
| |||||
Average session time | 250 seconds
| |||||
| State name | % of total | Count | Errors | Minimum Time | Maximum Time | Average Time |
|---|---|---|---|---|---|---|
Home | 4 % | 405 | 0 | 0 ms | 92999 ms | 230 ms
|
Register | 1 % | 99 | 0 | 0 ms | 9 ms | 0 ms
|
RegisterUser | 0 % | 72 | 2 | 5 ms | 88 ms | 19 ms
|
Browse | 6 % | 661 | 0 | 0 ms | 93007 ms | 146 ms
|
BrowseCategories | 4 % | 450 | 0 | 3 ms | 93013 ms | 421 ms
|
SearchItemsInCategory | 15 % | 1518 | 0 | 3 ms | 93039 ms | 345 ms
|
BrowseRegions | 2 % | 200 | 0 | 3 ms | 93020 ms | 473 ms
|
BrowseCategoriesInRegion | 2 % | 213 | 0 | 3 ms | 88 ms | 7 ms
|
SearchItemsInRegion | 4 % | 488 | 0 | 0 ms | 93045 ms | 626 ms
|
ViewItem | 14 % | 1413 | 0 | 3 ms | 93061 ms | 614 ms
|
ViewUserInfo | 3 % | 308 | 0 | 3 ms | 3028 ms | 24 ms
|
ViewBidHistory | 1 % | 186 | 0 | 3 ms | 93230 ms | 590 ms
|
BuyNowAuth | 1 % | 138 | 0 | 2 ms | 53 ms | 4 ms
|
BuyNow | 1 % | 136 | 19 | 5 ms | 70 ms | 12 ms
|
StoreBuyBow | 1 % | 102 | 0 | 5 ms | 93007 ms | 924 ms
|
PutBidAuth | 5 % | 547 | 0 | 0 ms | 93020 ms | 349 ms
|
PutBid | 6 % | 592 | 58 | 4 ms | 93021 ms | 334 ms
|
StoreBid | 3 % | 388 | 0 | 4 ms | 93033 ms | 507 ms
|
PutCommentAuth | 0 % | 0 | 0 | 0 ms | 0 ms | 0 ms
|
PutComment | 0 % | 49 | 6 | 4 ms | 93030 ms | 1972 ms
|
StoreComment | 0 % | 50 | 0 | 5 ms | 3006 ms | 73 ms
|
Sell | 0 % | 51 | 0 | 0 ms | 6 ms | 0 ms
|
SelectCategoryToSellItem | 0 % | 41 | 0 | 4 ms | 64 ms | 16 ms
|
SellItemForm | 0 % | 49 | 0 | 2 ms | 50 ms | 4 ms
|
RegisterItem | 0 % | 42 | 0 | 5 ms | 35 ms | 11 ms
|
AboutMe (auth form) | 1 % | 158 | 0 | 0 ms | 8 ms | 0 ms
|
AboutMe | 2 % | 270 | 0 | 4 ms | 190 ms | 40 ms
|
Back probability | 10 % | 1069 | 0 | 0 ms | 0 ms | 0 ms
|
End of Session | 1 % | 140 | 0 | 0 ms | 0 ms | 0 ms
|
Total | 100 % | 9835 | 85 | - | - | 311 ms
|
Average throughput | 330 req/s
| |||||
Completed sessions | 134
| |||||
Total time | 44239 seconds
| |||||
Average session time | 330 seconds
| |||||
| State name | % of total | Count | Errors | Minimum Time | Maximum Time | Average Time |
|---|---|---|---|---|---|---|
Home | 5 % | 18810 | 0 | 0 ms | 92999 ms | 1844 ms
|
Register | 1 % | 3957 | 0 | 0 ms | 45127 ms | 499 ms
|
RegisterUser | 1 % | 3834 | 130 | 5 ms | 45117 ms | 517 ms
|
Browse | 7 % | 27268 | 0 | 0 ms | 93007 ms | 614 ms
|
BrowseCategories | 5 % | 18904 | 0 | 3 ms | 93013 ms | 508 ms
|
SearchItemsInCategory | 15 % | 56636 | 0 | 1 ms | 93039 ms | 463 ms
|
BrowseRegions | 2 % | 7723 | 0 | 3 ms | 93020 ms | 560 ms
|
BrowseCategoriesInRegion | 2 % | 7521 | 0 | 3 ms | 45399 ms | 511 ms
|
SearchItemsInRegion | 5 % | 18294 | 0 | 0 ms | 93045 ms | 444 ms
|
ViewItem | 13 % | 50192 | 0 | 3 ms | 93061 ms | 400 ms
|
ViewUserInfo | 3 % | 11131 | 0 | 3 ms | 45038 ms | 331 ms
|
ViewBidHistory | 1 % | 5827 | 0 | 3 ms | 93230 ms | 465 ms
|
BuyNowAuth | 1 % | 4636 | 0 | 2 ms | 45382 ms | 366 ms
|
BuyNow | 1 % | 4499 | 655 | 4 ms | 45441 ms | 414 ms
|
StoreBuyBow | 1 % | 3721 | 4 | 5 ms | 93007 ms | 334 ms
|
PutBidAuth | 4 % | 17340 | 0 | 0 ms | 93020 ms | 343 ms
|
PutBid | 5 % | 19542 | 2138 | 3 ms | 93021 ms | 339 ms
|
StoreBid | 3 % | 12717 | 5 | 4 ms | 93033 ms | 319 ms
|
PutCommentAuth | 0 % | 0 | 0 | 0 ms | 0 ms | 0 ms
|
PutComment | 0 % | 1695 | 119 | 4 ms | 93030 ms | 391 ms
|
StoreComment | 0 % | 1535 | 0 | 4 ms | 22858 ms | 273 ms
|
Sell | 0 % | 2048 | 0 | 0 ms | 45389 ms | 640 ms
|
SelectCategoryToSellItem | 0 % | 1981 | 0 | 4 ms | 45009 ms | 406 ms
|
SellItemForm | 0 % | 1939 | 0 | 2 ms | 45007 ms | 377 ms
|
RegisterItem | 0 % | 1893 | 0 | 4 ms | 45013 ms | 490 ms
|
AboutMe (auth form) | 1 % | 6167 | 0 | 0 ms | 45206 ms | 629 ms
|
AboutMe | 2 % | 10196 | 0 | 4 ms | 45369 ms | 536 ms
|
Back probability | 10 % | 36269 | 0 | 0 ms | 0 ms | 0 ms
|
End of Session | 1 % | 5036 | 0 | 0 ms | 0 ms | 0 ms
|
Total | 100 % | 361311 | 3051 | - | - | 465 ms
|
Average throughput | 607 req/s
| |||||
Completed sessions | 5036
| |||||
Total time | 1162511 seconds
| |||||
Average session time | 230 seconds
| |||||
An error occured while waiting for remote processes termination (Skipping waits)
Command is: /usr/bin/scp farm6.csail.mit.edu:/tmp/client1 /home/drkp/sandbox/txcache/src/RUBiS-1.4.3/bench/2009-3-19@15:25:40//client1.bin
Command is: /usr/bin/ssh -x localhost /bin/bash -c 'LANG=en_GB.UTF-8 /usr/bin/sar -n DEV -n SOCK -rubcw 1 605 -f /home/drkp/sandbox/txcache/src/RUBiS-1.4.3/bench/2009-3-19@15:25:40//client1.bin > /home/drkp/sandbox/txcache/src/RUBiS-1.4.3/bench/2009-3-19@15:25:40//client1'
Command is: /usr/bin/scp farm14:/tmp/db_server0 /home/drkp/sandbox/txcache/src/RUBiS-1.4.3/bench/2009-3-19@15:25:40//db_server0.bin
Command is: /usr/bin/ssh -x localhost /bin/bash -c 'LANG=en_GB.UTF-8 /usr/bin/sar -n DEV -n SOCK -rubcw 1 605 -f /home/drkp/sandbox/txcache/src/RUBiS-1.4.3/bench/2009-3-19@15:25:40//db_server0.bin > /home/drkp/sandbox/txcache/src/RUBiS-1.4.3/bench/2009-3-19@15:25:40//db_server0'
Command is: /usr/bin/scp farm12.csail.mit.edu:/tmp/web_server0 /home/drkp/sandbox/txcache/src/RUBiS-1.4.3/bench/2009-3-19@15:25:40//web_server0.bin
Command is: /usr/bin/ssh -x localhost /bin/bash -c 'LANG=en_GB.UTF-8 /usr/bin/sar -n DEV -n SOCK -rubcw 1 605 -f /home/drkp/sandbox/txcache/src/RUBiS-1.4.3/bench/2009-3-19@15:25:40//web_server0.bin > /home/drkp/sandbox/txcache/src/RUBiS-1.4.3/bench/2009-3-19@15:25:40//web_server0'
Command is: /usr/bin/scp farm13.csail.mit.edu:/tmp/web_server1 /home/drkp/sandbox/txcache/src/RUBiS-1.4.3/bench/2009-3-19@15:25:40//web_server1.bin
Command is: /usr/bin/ssh -x localhost /bin/bash -c 'LANG=en_GB.UTF-8 /usr/bin/sar -n DEV -n SOCK -rubcw 1 605 -f /home/drkp/sandbox/txcache/src/RUBiS-1.4.3/bench/2009-3-19@15:25:40//web_server1.bin > /home/drkp/sandbox/txcache/src/RUBiS-1.4.3/bench/2009-3-19@15:25:40//web_server1'
Command is: /usr/bin/scp localhost:/tmp/client0 /home/drkp/sandbox/txcache/src/RUBiS-1.4.3/bench/2009-3-19@15:25:40//client0.bin
Command is: /usr/bin/ssh -x localhost /bin/bash -c 'LANG=en_GB.UTF-8 /usr/bin/sar -n DEV -n SOCK -rubcw 1 605 -f /home/drkp/sandbox/txcache/src/RUBiS-1.4.3/bench/2009-3-19@15:25:40//client0.bin > /home/drkp/sandbox/txcache/src/RUBiS-1.4.3/bench/2009-3-19@15:25:40//client0'
Command is: /usr/bin/scp farm6.csail.mit.edu:/tmp/trace_client1.html /home/drkp/sandbox/txcache/src/RUBiS-1.4.3/bench/2009-3-19@15:25:40//
Command is: /usr/bin/scp farm6.csail.mit.edu:/tmp/stat_client1.html /home/drkp/sandbox/txcache/src/RUBiS-1.4.3/bench/2009-3-19@15:25:40//
|
|
|
|
|
|
 | 
|
 | 
|
 | 
|
 | 
|
 | 
|
 | 
|
 | 
|
 | 
|
 | 
|