Node information
Test timing information
Up ramp statistics
Runtime session statistics
Down ramp statistics
Overall statistics
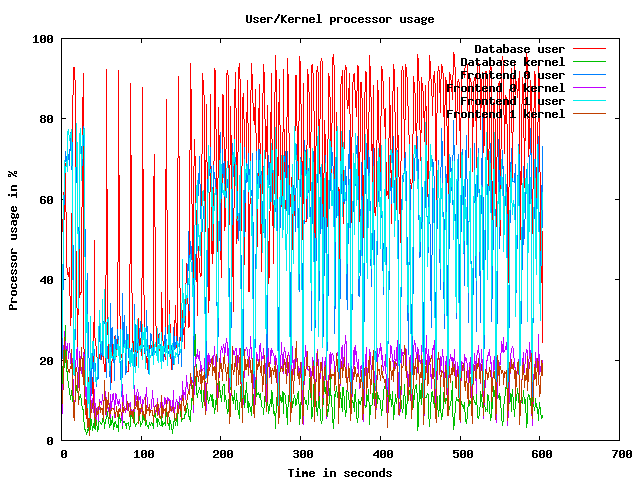
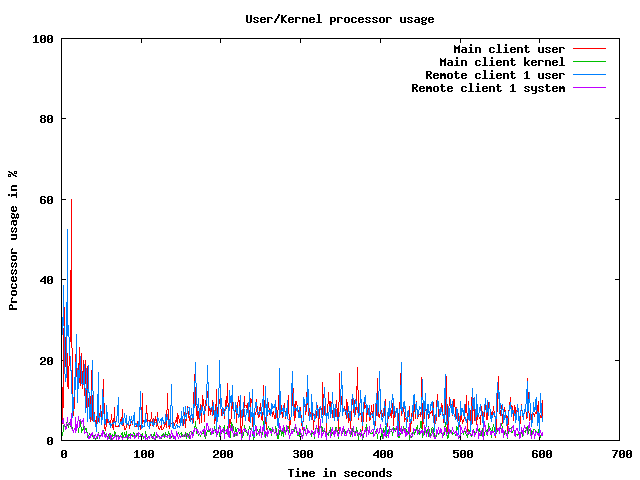
CPU usage graphs
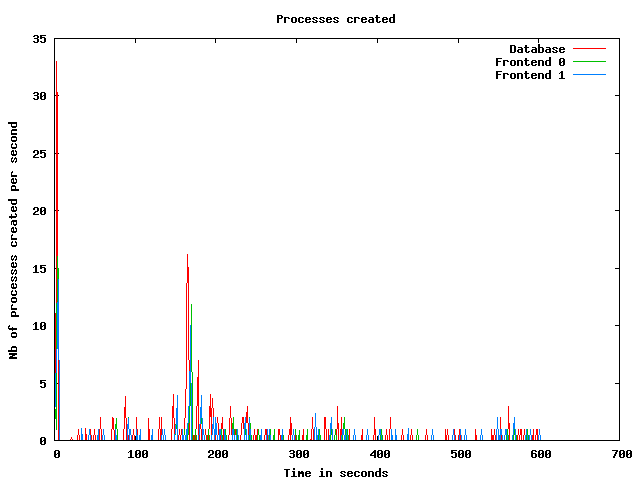
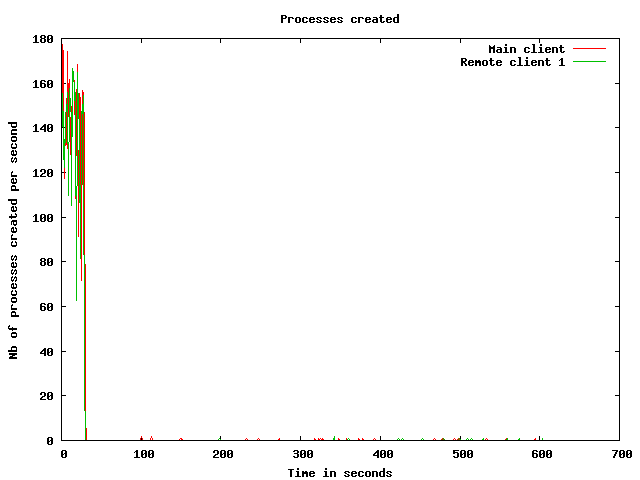
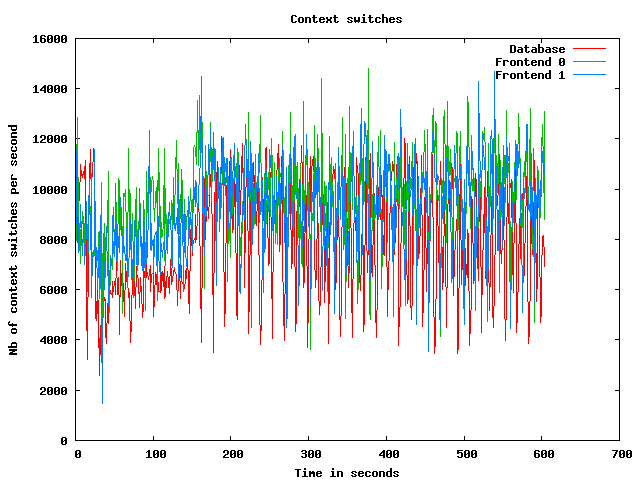
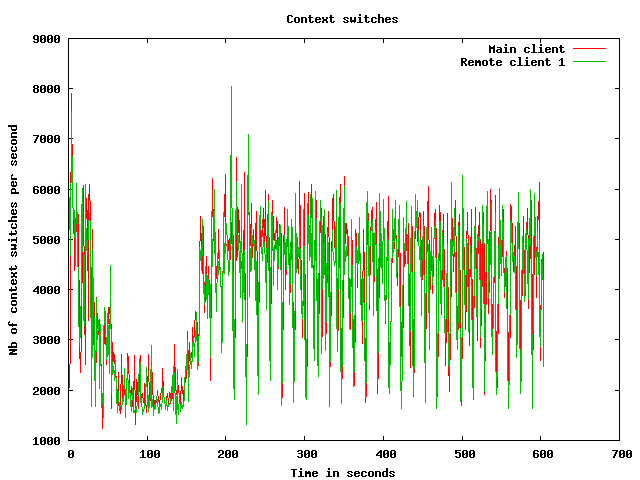
Processes usage graphs
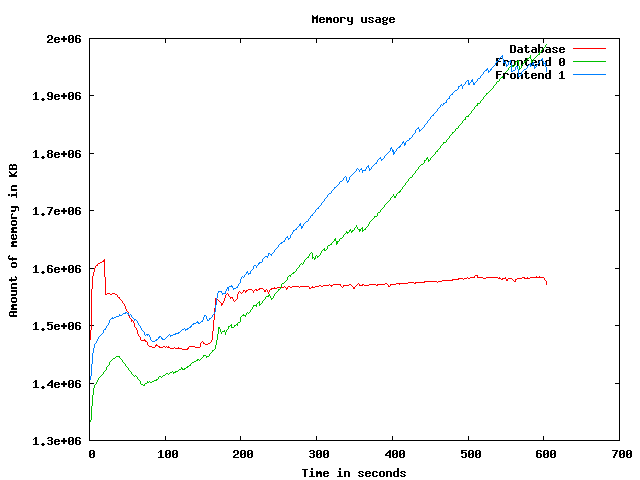
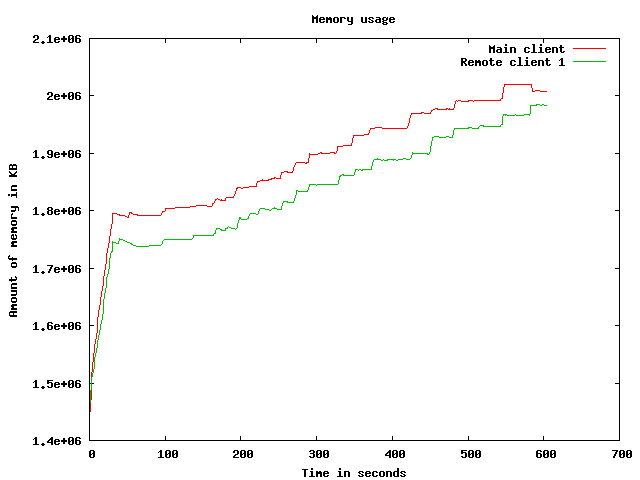
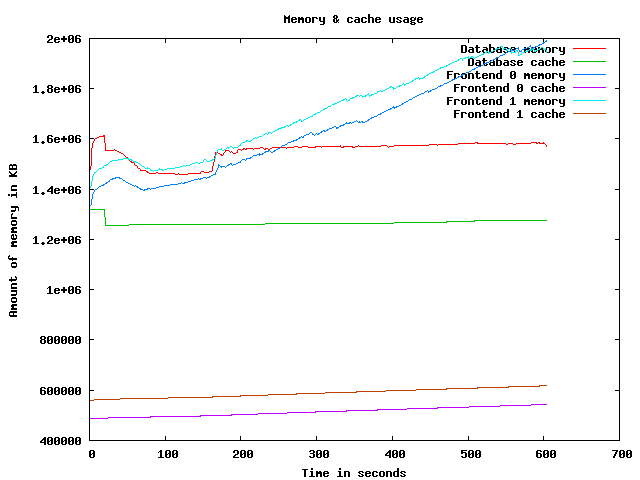
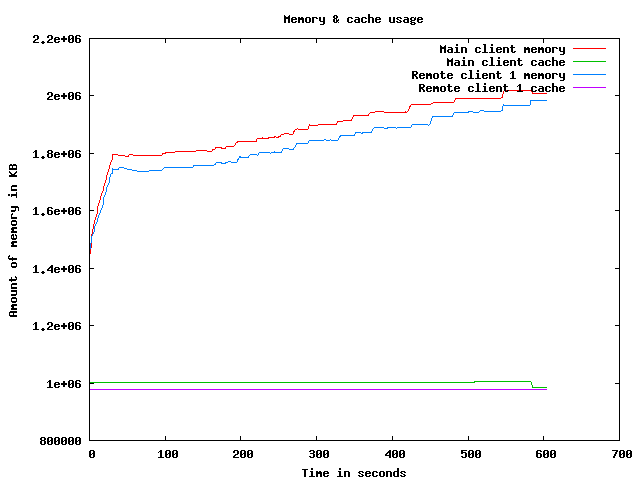
Memory usage graph
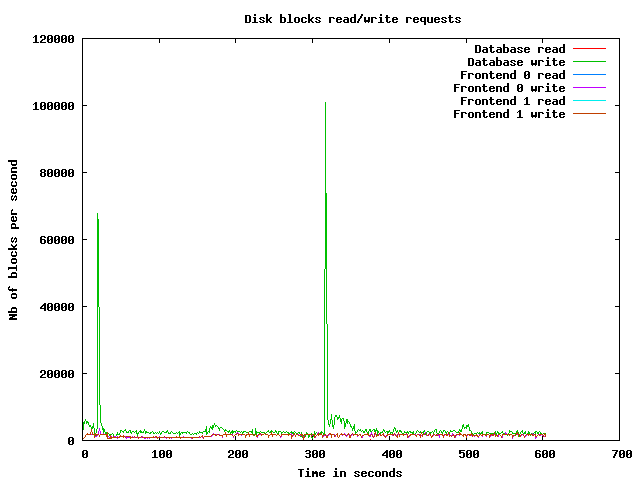
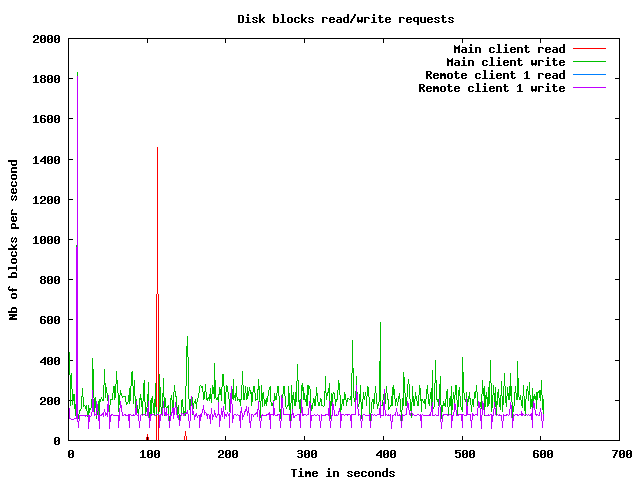
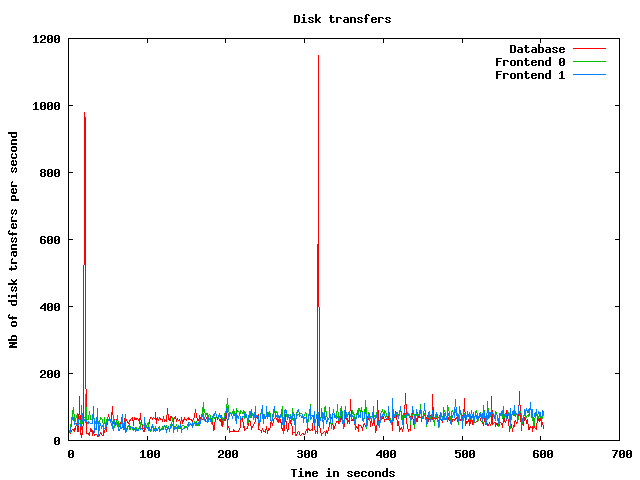
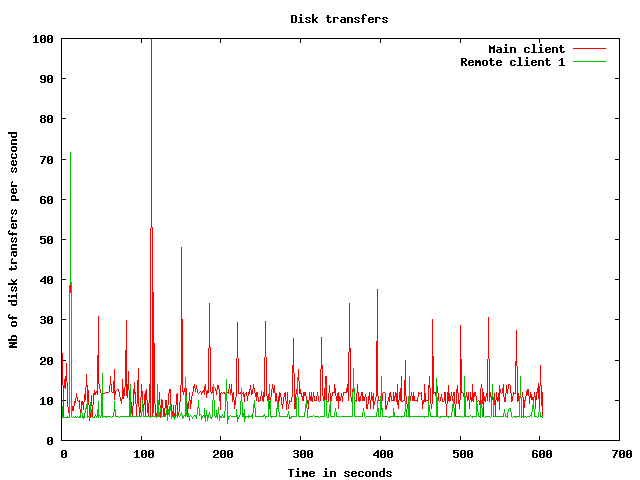
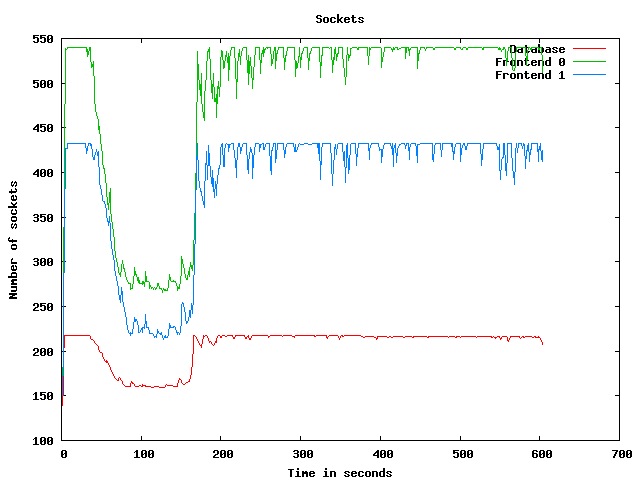
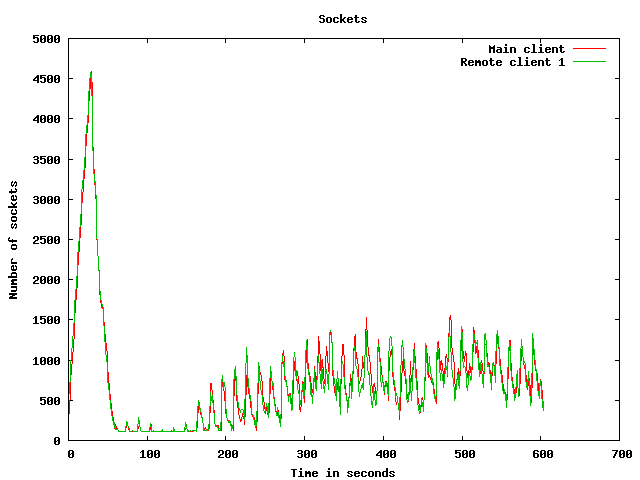
Disk usage graphs
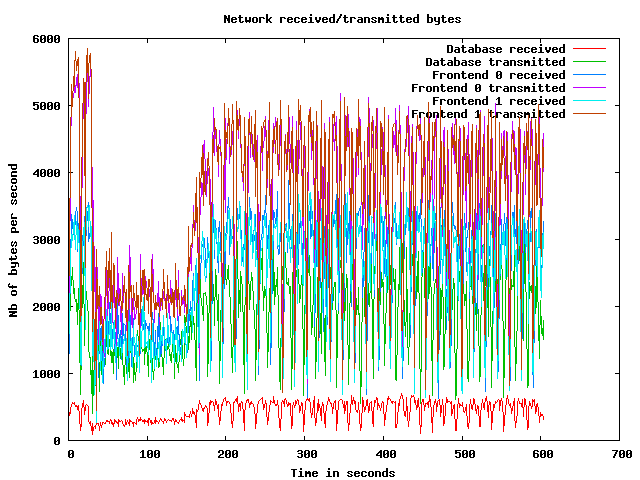
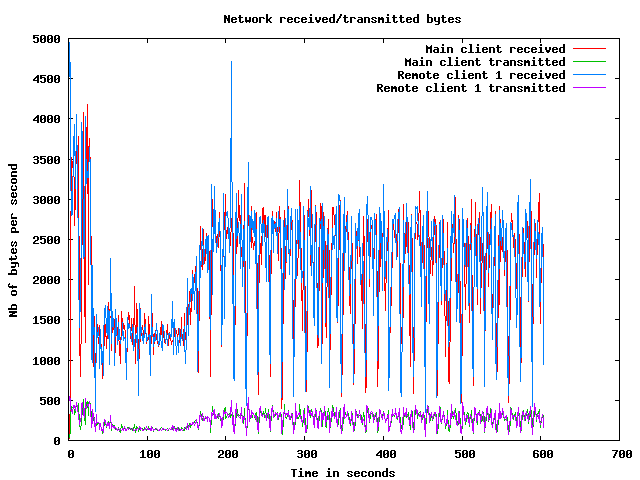
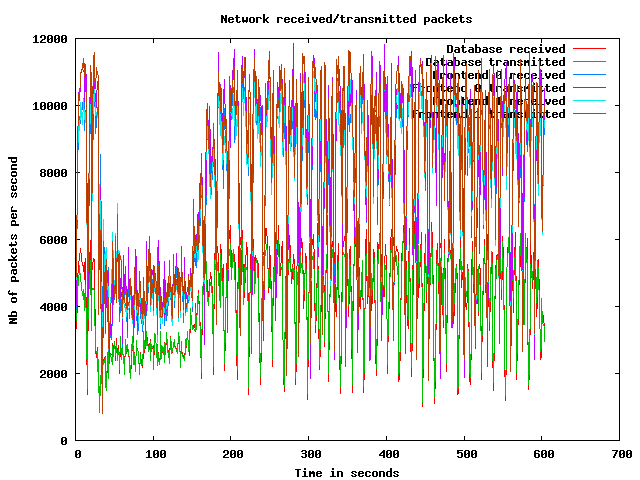
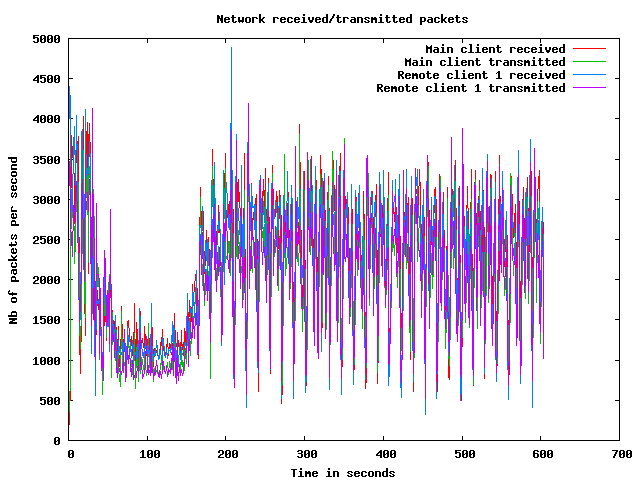
Network usage graphs
| Test start | 2009-3-19 15:38:58 |
| Up ramp start | 2009-3-19 15:39:30 |
| Runtime session start | 2009-3-19 15:41:30 |
| Down ramp start | 2009-3-19 15:49:0 |
| Test end | 2009-3-19 15:51:40 |
| Up ramp length | 2 minutes 0 millisecond (requested 120000 ms) |
| Runtime session length | 7 minutes 30 seconds 5 milliseconds (requested 450000 ms) |
| Down ramp length | 30 seconds 0 millisecond (requested 30000 ms) |
| Total test length | 12 minutes 42 seconds 150 milliseconds |
| State name | % of total | Count | Errors | Minimum Time | Maximum Time | Average Time |
|---|---|---|---|---|---|---|
Home | 9 % | 6924 | 0 | 0 ms | 46320 ms | 5617 ms
|
Register | 1 % | 998 | 0 | 0 ms | 45042 ms | 1532 ms
|
RegisterUser | 1 % | 942 | 21 | 5 ms | 45286 ms | 1530 ms
|
Browse | 9 % | 7059 | 0 | 0 ms | 46286 ms | 2093 ms
|
BrowseCategories | 6 % | 4745 | 0 | 3 ms | 46221 ms | 1536 ms
|
SearchItemsInCategory | 14 % | 10957 | 0 | 3 ms | 59157 ms | 1216 ms
|
BrowseRegions | 2 % | 1885 | 0 | 3 ms | 59167 ms | 1512 ms
|
BrowseCategoriesInRegion | 2 % | 1754 | 0 | 3 ms | 45091 ms | 1675 ms
|
SearchItemsInRegion | 4 % | 3580 | 0 | 0 ms | 45507 ms | 1126 ms
|
ViewItem | 12 % | 9171 | 0 | 3 ms | 59232 ms | 1116 ms
|
ViewUserInfo | 2 % | 1634 | 0 | 3 ms | 45073 ms | 785 ms
|
ViewBidHistory | 1 % | 905 | 0 | 3 ms | 45208 ms | 1015 ms
|
BuyNowAuth | 1 % | 788 | 0 | 2 ms | 45006 ms | 717 ms
|
BuyNow | 0 % | 699 | 93 | 4 ms | 45042 ms | 1133 ms
|
StoreBuyBow | 0 % | 528 | 0 | 5 ms | 45524 ms | 770 ms
|
PutBidAuth | 4 % | 3112 | 0 | 0 ms | 59098 ms | 994 ms
|
PutBid | 4 % | 3099 | 384 | 1 ms | 45514 ms | 796 ms
|
StoreBid | 2 % | 1789 | 3 | 4 ms | 45449 ms | 994 ms
|
PutCommentAuth | 0 % | 0 | 0 | 0 ms | 0 ms | 0 ms
|
PutComment | 0 % | 288 | 26 | 4 ms | 45012 ms | 762 ms
|
StoreComment | 0 % | 240 | 0 | 5 ms | 45011 ms | 439 ms
|
Sell | 0 % | 537 | 0 | 0 ms | 45399 ms | 2248 ms
|
SelectCategoryToSellItem | 0 % | 494 | 0 | 3 ms | 45484 ms | 1407 ms
|
SellItemForm | 0 % | 462 | 0 | 2 ms | 45035 ms | 891 ms
|
RegisterItem | 0 % | 425 | 0 | 4 ms | 45022 ms | 1439 ms
|
AboutMe (auth form) | 2 % | 1538 | 0 | 0 ms | 45264 ms | 1685 ms
|
AboutMe | 2 % | 2130 | 0 | 4 ms | 45367 ms | 1704 ms
|
Back probability | 7 % | 5819 | 0 | 0 ms | 0 ms | 0 ms
|
End of Session | 1 % | 752 | 0 | 0 ms | 0 ms | 0 ms
|
Total | 100 % | 73254 | 527 | - | - | 1600 ms
|
Average throughput | 614 req/s
| |||||
Completed sessions | 679
| |||||
Total time | 37202 seconds
| |||||
Average session time | 54 seconds
| |||||
| State name | % of total | Count | Errors | Minimum Time | Maximum Time | Average Time |
|---|---|---|---|---|---|---|
Home | 4 % | 11912 | 0 | 0 ms | 94234 ms | 457 ms
|
Register | 1 % | 3000 | 0 | 0 ms | 190001 ms | 965 ms
|
RegisterUser | 1 % | 2941 | 123 | 5 ms | 94041 ms | 1055 ms
|
Browse | 7 % | 20230 | 0 | 0 ms | 190002 ms | 983 ms
|
BrowseCategories | 4 % | 14151 | 0 | 3 ms | 190028 ms | 994 ms
|
SearchItemsInCategory | 15 % | 44763 | 0 | 3 ms | 190086 ms | 1122 ms
|
BrowseRegions | 2 % | 5853 | 0 | 3 ms | 95494 ms | 1041 ms
|
BrowseCategoriesInRegion | 2 % | 5738 | 0 | 3 ms | 93759 ms | 950 ms
|
SearchItemsInRegion | 5 % | 14681 | 0 | 0 ms | 95443 ms | 1100 ms
|
ViewItem | 14 % | 40600 | 0 | 3 ms | 96814 ms | 1023 ms
|
ViewUserInfo | 3 % | 9369 | 0 | 3 ms | 94032 ms | 1016 ms
|
ViewBidHistory | 1 % | 5021 | 0 | 4 ms | 94877 ms | 1363 ms
|
BuyNowAuth | 1 % | 3911 | 0 | 2 ms | 93826 ms | 974 ms
|
BuyNow | 1 % | 3855 | 504 | 6 ms | 96008 ms | 1019 ms
|
StoreBuyBow | 1 % | 3302 | 4 | 5 ms | 190100 ms | 1084 ms
|
PutBidAuth | 4 % | 14167 | 0 | 0 ms | 94299 ms | 952 ms
|
PutBid | 5 % | 16417 | 1755 | 4 ms | 190094 ms | 1047 ms
|
StoreBid | 3 % | 10789 | 10 | 5 ms | 190015 ms | 971 ms
|
PutCommentAuth | 0 % | 0 | 0 | 0 ms | 0 ms | 0 ms
|
PutComment | 0 % | 1459 | 94 | 4 ms | 93772 ms | 1175 ms
|
StoreComment | 0 % | 1340 | 0 | 5 ms | 22564 ms | 831 ms
|
Sell | 0 % | 1620 | 0 | 0 ms | 94027 ms | 962 ms
|
SelectCategoryToSellItem | 0 % | 1599 | 0 | 3 ms | 93775 ms | 1060 ms
|
SellItemForm | 0 % | 1569 | 0 | 2 ms | 190018 ms | 988 ms
|
RegisterItem | 0 % | 1536 | 0 | 5 ms | 190007 ms | 1085 ms
|
AboutMe (auth form) | 1 % | 4603 | 0 | 0 ms | 190000 ms | 1031 ms
|
AboutMe | 2 % | 7918 | 0 | 4 ms | 190220 ms | 1191 ms
|
Back probability | 10 % | 30106 | 0 | 0 ms | 0 ms | 0 ms
|
End of Session | 1 % | 4170 | 0 | 0 ms | 0 ms | 0 ms
|
Total | 100 % | 286620 | 2490 | - | - | 889 ms
|
Average throughput | 642 req/s
| |||||
Completed sessions | 4184
| |||||
Total time | 1084135 seconds
| |||||
Average session time | 259 seconds
| |||||
| State name | % of total | Count | Errors | Minimum Time | Maximum Time | Average Time |
|---|---|---|---|---|---|---|
Home | 3 % | 423 | 0 | 0 ms | 21027 ms | 278 ms
|
Register | 1 % | 114 | 0 | 0 ms | 21008 ms | 612 ms
|
RegisterUser | 1 % | 118 | 7 | 4 ms | 21009 ms | 449 ms
|
Browse | 7 % | 761 | 0 | 0 ms | 93142 ms | 724 ms
|
BrowseCategories | 4 % | 514 | 0 | 3 ms | 93140 ms | 1259 ms
|
SearchItemsInCategory | 16 % | 1719 | 0 | 3 ms | 93126 ms | 864 ms
|
BrowseRegions | 1 % | 210 | 0 | 3 ms | 21006 ms | 449 ms
|
BrowseCategoriesInRegion | 1 % | 196 | 0 | 3 ms | 21184 ms | 695 ms
|
SearchItemsInRegion | 4 % | 517 | 0 | 0 ms | 93164 ms | 836 ms
|
ViewItem | 13 % | 1481 | 0 | 3 ms | 93134 ms | 812 ms
|
ViewUserInfo | 3 % | 332 | 0 | 3 ms | 93153 ms | 924 ms
|
ViewBidHistory | 1 % | 165 | 0 | 3 ms | 45027 ms | 1163 ms
|
BuyNowAuth | 1 % | 127 | 0 | 2 ms | 45001 ms | 830 ms
|
BuyNow | 1 % | 136 | 12 | 6 ms | 47156 ms | 638 ms
|
StoreBuyBow | 1 % | 123 | 0 | 5 ms | 20999 ms | 507 ms
|
PutBidAuth | 4 % | 532 | 0 | 0 ms | 93110 ms | 1019 ms
|
PutBid | 6 % | 665 | 72 | 4 ms | 93124 ms | 911 ms
|
StoreBid | 4 % | 444 | 0 | 5 ms | 45018 ms | 626 ms
|
PutCommentAuth | 0 % | 0 | 0 | 0 ms | 0 ms | 0 ms
|
PutComment | 0 % | 67 | 2 | 5 ms | 93182 ms | 1970 ms
|
StoreComment | 0 % | 53 | 0 | 5 ms | 93123 ms | 1969 ms
|
Sell | 0 % | 70 | 0 | 0 ms | 11388 ms | 286 ms
|
SelectCategoryToSellItem | 0 % | 65 | 0 | 5 ms | 21071 ms | 480 ms
|
SellItemForm | 0 % | 46 | 0 | 2 ms | 21015 ms | 870 ms
|
RegisterItem | 0 % | 55 | 0 | 4 ms | 47158 ms | 1384 ms
|
AboutMe (auth form) | 1 % | 180 | 0 | 0 ms | 93119 ms | 1042 ms
|
AboutMe | 2 % | 290 | 0 | 5 ms | 47244 ms | 763 ms
|
Back probability | 10 % | 1110 | 0 | 0 ms | 0 ms | 0 ms
|
End of Session | 1 % | 158 | 0 | 0 ms | 0 ms | 0 ms
|
Total | 100 % | 10671 | 93 | - | - | 723 ms
|
Average throughput | 358 req/s
| |||||
Completed sessions | 144
| |||||
Total time | 52569 seconds
| |||||
Average session time | 365 seconds
| |||||
| State name | % of total | Count | Errors | Minimum Time | Maximum Time | Average Time |
|---|---|---|---|---|---|---|
Home | 5 % | 19261 | 0 | 0 ms | 190001 ms | 2332 ms
|
Register | 1 % | 4114 | 0 | 0 ms | 190001 ms | 1138 ms
|
RegisterUser | 1 % | 4002 | 151 | 4 ms | 94041 ms | 1148 ms
|
Browse | 7 % | 28060 | 0 | 0 ms | 190008 ms | 1285 ms
|
BrowseCategories | 5 % | 19413 | 0 | 3 ms | 190028 ms | 1148 ms
|
SearchItemsInCategory | 15 % | 57681 | 0 | 3 ms | 190100 ms | 1178 ms
|
BrowseRegions | 2 % | 7951 | 0 | 3 ms | 190011 ms | 1196 ms
|
BrowseCategoriesInRegion | 2 % | 7691 | 0 | 3 ms | 190004 ms | 1158 ms
|
SearchItemsInRegion | 5 % | 18849 | 0 | 0 ms | 190027 ms | 1144 ms
|
ViewItem | 13 % | 51367 | 0 | 3 ms | 190061 ms | 1107 ms
|
ViewUserInfo | 3 % | 11363 | 0 | 3 ms | 190006 ms | 1010 ms
|
ViewBidHistory | 1 % | 6107 | 0 | 3 ms | 190101 ms | 1426 ms
|
BuyNowAuth | 1 % | 4827 | 0 | 2 ms | 190005 ms | 1026 ms
|
BuyNow | 1 % | 4693 | 609 | 4 ms | 190007 ms | 1146 ms
|
StoreBuyBow | 1 % | 3956 | 4 | 5 ms | 190100 ms | 1095 ms
|
PutBidAuth | 4 % | 17815 | 0 | 0 ms | 190008 ms | 993 ms
|
PutBid | 5 % | 20222 | 2213 | 1 ms | 190094 ms | 1035 ms
|
StoreBid | 3 % | 13023 | 13 | 4 ms | 190015 ms | 1013 ms
|
PutCommentAuth | 0 % | 0 | 0 | 0 ms | 0 ms | 0 ms
|
PutComment | 0 % | 1814 | 122 | 4 ms | 93772 ms | 1139 ms
|
StoreComment | 0 % | 1633 | 0 | 5 ms | 93123 ms | 811 ms
|
Sell | 0 % | 2227 | 0 | 0 ms | 94027 ms | 1251 ms
|
SelectCategoryToSellItem | 0 % | 2158 | 0 | 3 ms | 93775 ms | 1122 ms
|
SellItemForm | 0 % | 2077 | 0 | 2 ms | 190018 ms | 964 ms
|
RegisterItem | 0 % | 2016 | 0 | 4 ms | 190007 ms | 1168 ms
|
AboutMe (auth form) | 1 % | 6323 | 0 | 0 ms | 190001 ms | 1325 ms
|
AboutMe | 2 % | 10399 | 0 | 4 ms | 190220 ms | 1350 ms
|
Back probability | 9 % | 37054 | 0 | 0 ms | 0 ms | 0 ms
|
End of Session | 1 % | 5080 | 0 | 0 ms | 0 ms | 0 ms
|
Total | 100 % | 371176 | 3112 | - | - | 1067 ms
|
Average throughput | 623 req/s
| |||||
Completed sessions | 5080
| |||||
Total time | 1202584 seconds
| |||||
Average session time | 236 seconds
| |||||
An error occured while waiting for remote processes termination (Skipping waits)
Command is: /usr/bin/scp farm6.csail.mit.edu:/tmp/client1 /home/drkp/sandbox/txcache/src/RUBiS-1.4.3/bench/2009-3-19@15:38:58//client1.bin
Command is: /usr/bin/ssh -x localhost /bin/bash -c 'LANG=en_GB.UTF-8 /usr/bin/sar -n DEV -n SOCK -rubcw 1 605 -f /home/drkp/sandbox/txcache/src/RUBiS-1.4.3/bench/2009-3-19@15:38:58//client1.bin > /home/drkp/sandbox/txcache/src/RUBiS-1.4.3/bench/2009-3-19@15:38:58//client1'
Command is: /usr/bin/scp farm14:/tmp/db_server0 /home/drkp/sandbox/txcache/src/RUBiS-1.4.3/bench/2009-3-19@15:38:58//db_server0.bin
Command is: /usr/bin/ssh -x localhost /bin/bash -c 'LANG=en_GB.UTF-8 /usr/bin/sar -n DEV -n SOCK -rubcw 1 605 -f /home/drkp/sandbox/txcache/src/RUBiS-1.4.3/bench/2009-3-19@15:38:58//db_server0.bin > /home/drkp/sandbox/txcache/src/RUBiS-1.4.3/bench/2009-3-19@15:38:58//db_server0'
Command is: /usr/bin/scp farm12.csail.mit.edu:/tmp/web_server0 /home/drkp/sandbox/txcache/src/RUBiS-1.4.3/bench/2009-3-19@15:38:58//web_server0.bin
Command is: /usr/bin/ssh -x localhost /bin/bash -c 'LANG=en_GB.UTF-8 /usr/bin/sar -n DEV -n SOCK -rubcw 1 605 -f /home/drkp/sandbox/txcache/src/RUBiS-1.4.3/bench/2009-3-19@15:38:58//web_server0.bin > /home/drkp/sandbox/txcache/src/RUBiS-1.4.3/bench/2009-3-19@15:38:58//web_server0'
Command is: /usr/bin/scp farm13.csail.mit.edu:/tmp/web_server1 /home/drkp/sandbox/txcache/src/RUBiS-1.4.3/bench/2009-3-19@15:38:58//web_server1.bin
Command is: /usr/bin/ssh -x localhost /bin/bash -c 'LANG=en_GB.UTF-8 /usr/bin/sar -n DEV -n SOCK -rubcw 1 605 -f /home/drkp/sandbox/txcache/src/RUBiS-1.4.3/bench/2009-3-19@15:38:58//web_server1.bin > /home/drkp/sandbox/txcache/src/RUBiS-1.4.3/bench/2009-3-19@15:38:58//web_server1'
Command is: /usr/bin/scp localhost:/tmp/client0 /home/drkp/sandbox/txcache/src/RUBiS-1.4.3/bench/2009-3-19@15:38:58//client0.bin
Command is: /usr/bin/ssh -x localhost /bin/bash -c 'LANG=en_GB.UTF-8 /usr/bin/sar -n DEV -n SOCK -rubcw 1 605 -f /home/drkp/sandbox/txcache/src/RUBiS-1.4.3/bench/2009-3-19@15:38:58//client0.bin > /home/drkp/sandbox/txcache/src/RUBiS-1.4.3/bench/2009-3-19@15:38:58//client0'
Command is: /usr/bin/scp farm6.csail.mit.edu:/tmp/trace_client1.html /home/drkp/sandbox/txcache/src/RUBiS-1.4.3/bench/2009-3-19@15:38:58//
Command is: /usr/bin/scp farm6.csail.mit.edu:/tmp/stat_client1.html /home/drkp/sandbox/txcache/src/RUBiS-1.4.3/bench/2009-3-19@15:38:58//
|
|
|
|
|
|
 | 
|
 | 
|
 | 
|
 | 
|
 | 
|
 | 
|
 | 
|
 | 
|
 | 
|