Node information
Test timing information
Up ramp statistics
Runtime session statistics
Down ramp statistics
Overall statistics
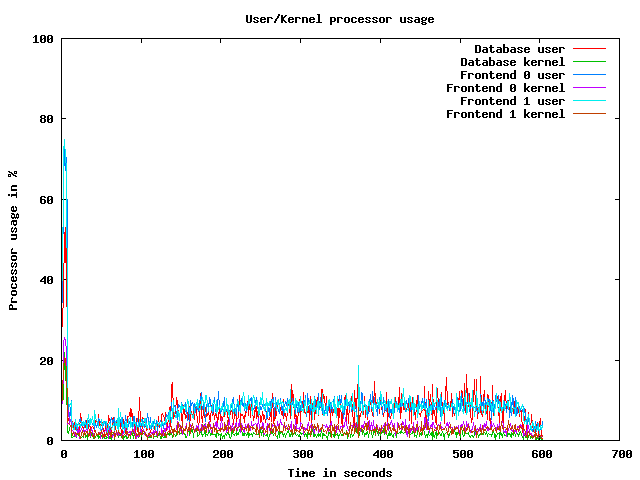
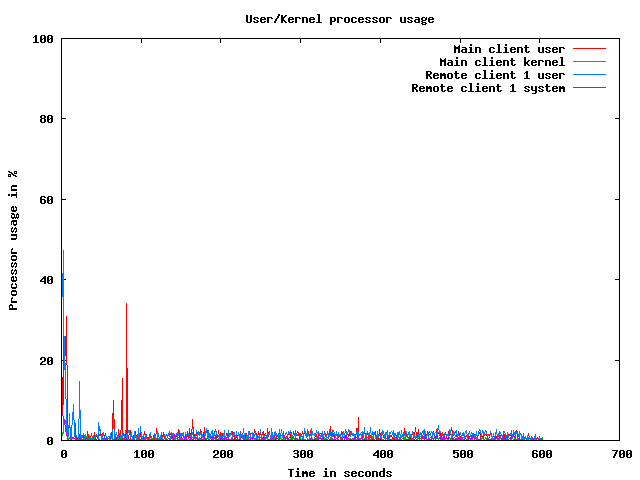
CPU usage graphs
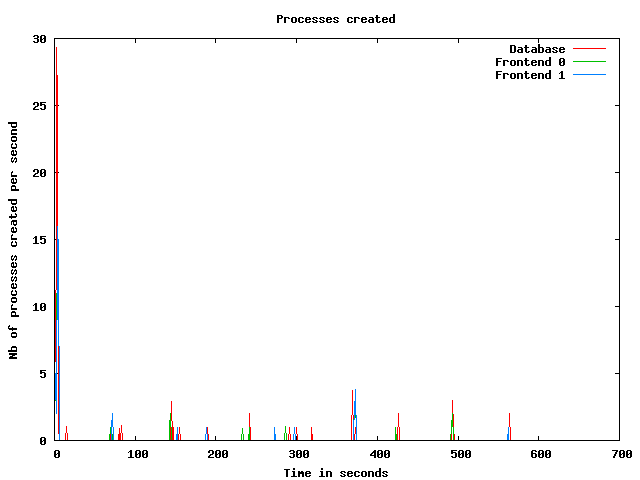
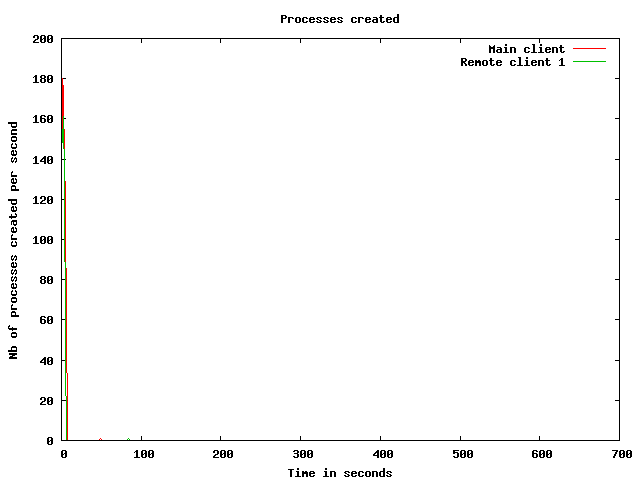
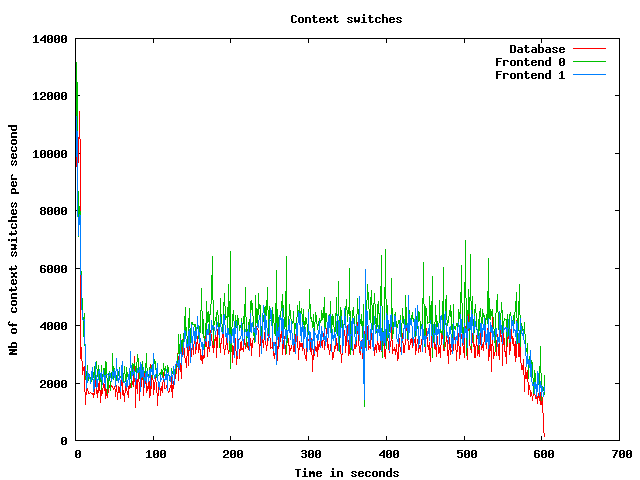
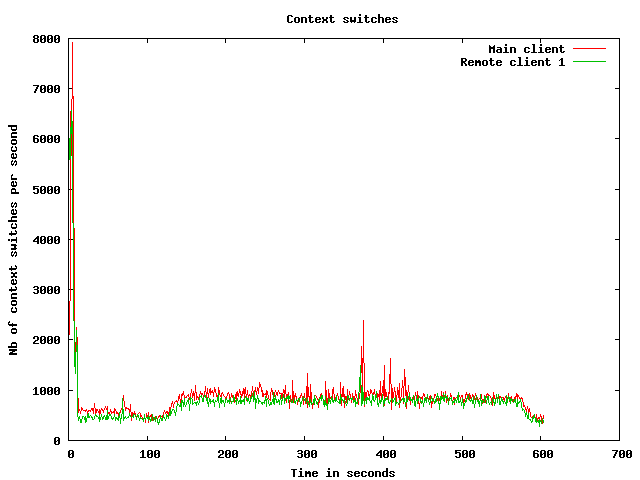
Processes usage graphs
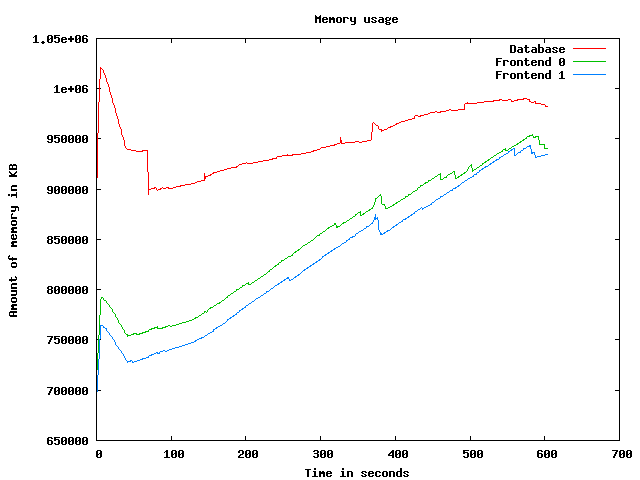
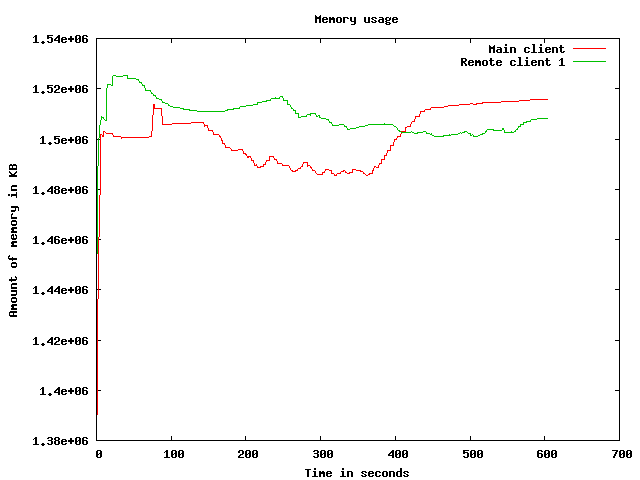
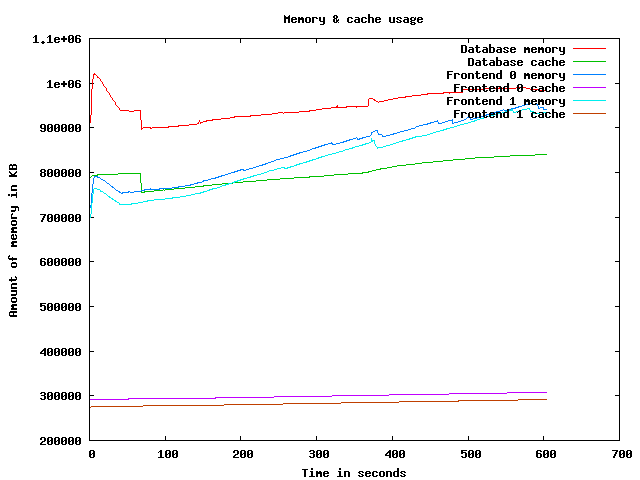
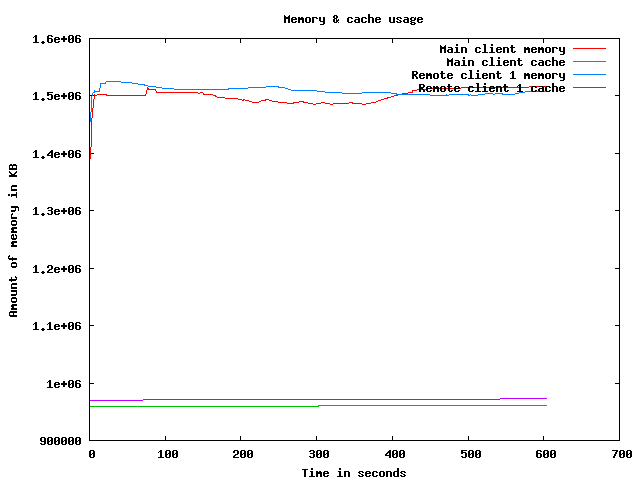
Memory usage graph
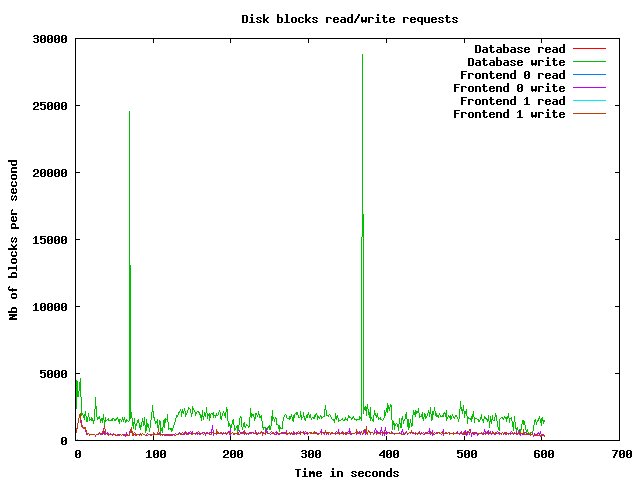
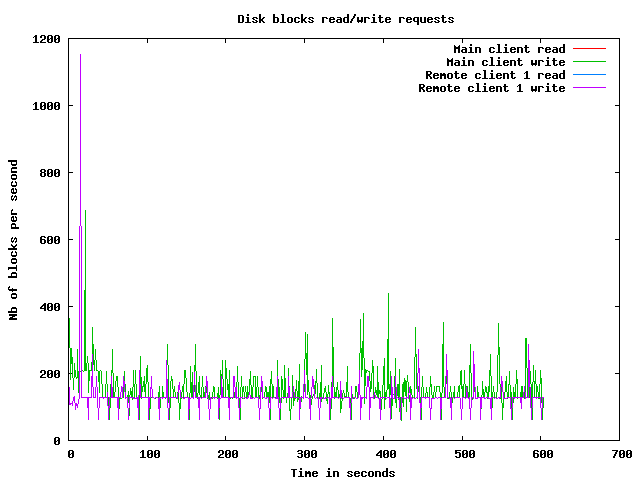
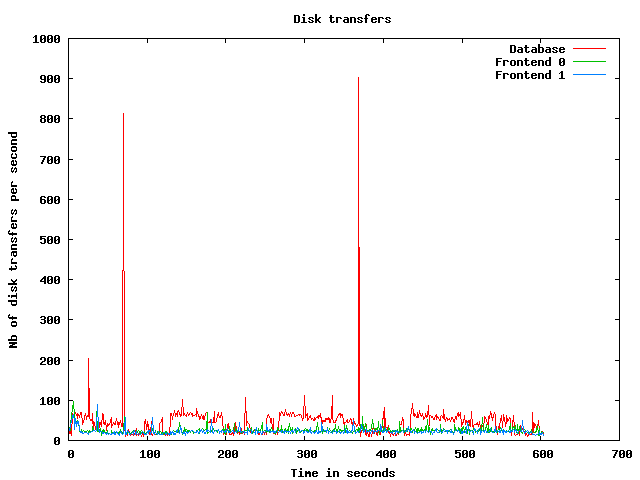
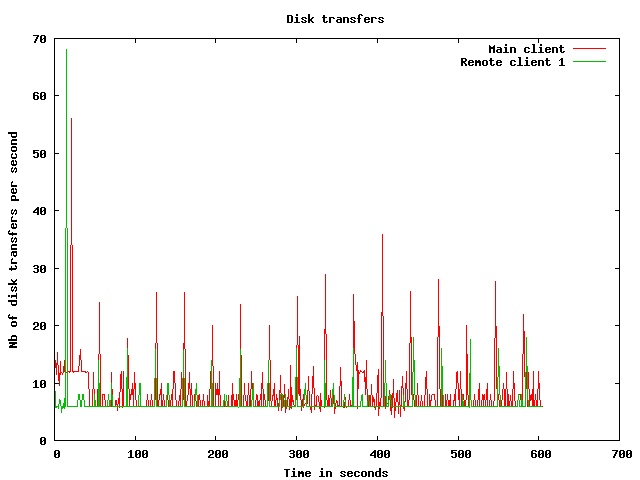
Disk usage graphs
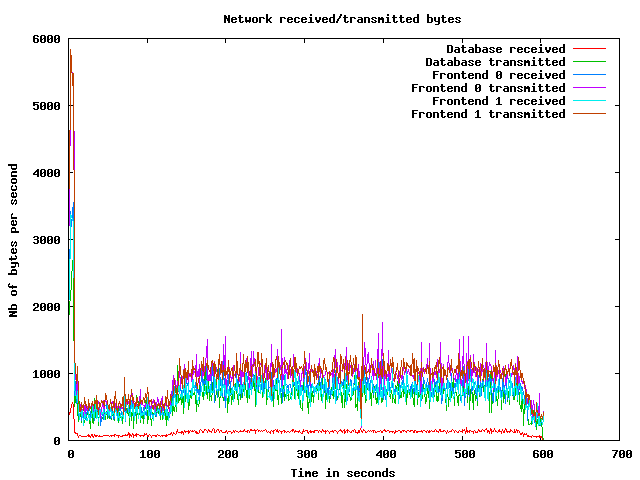
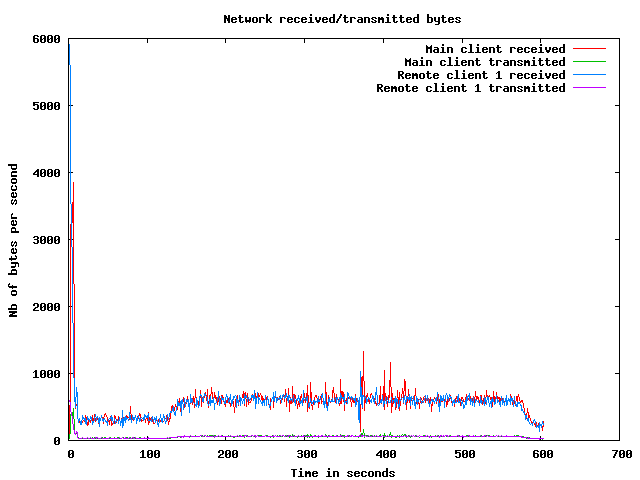
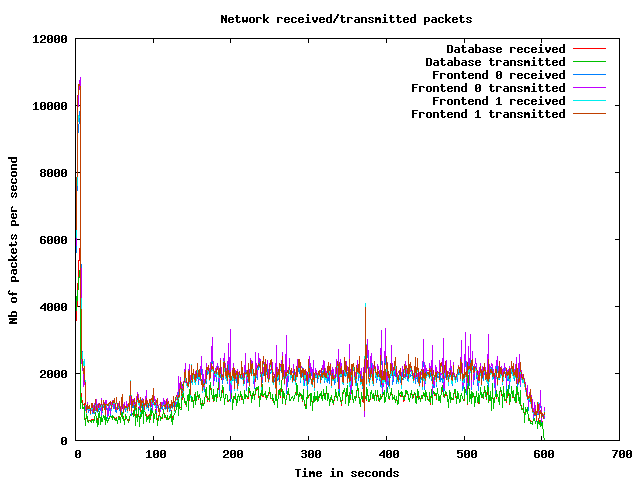
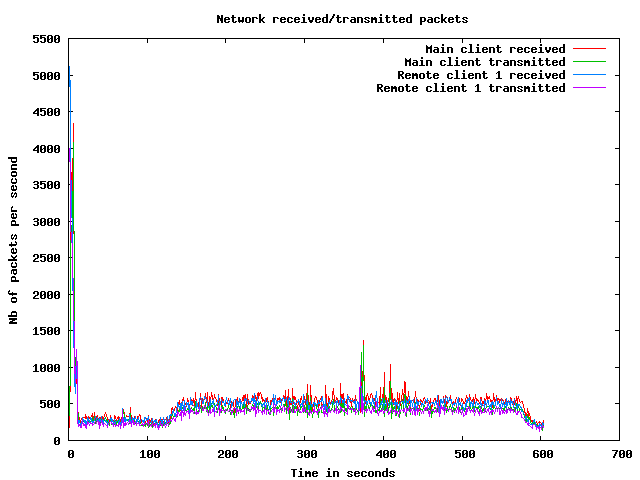
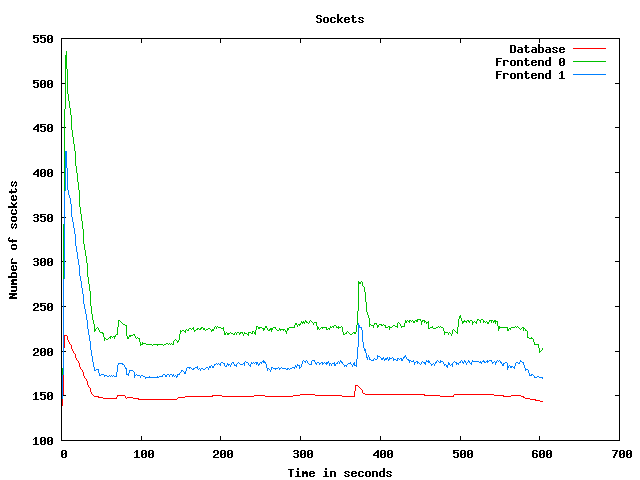
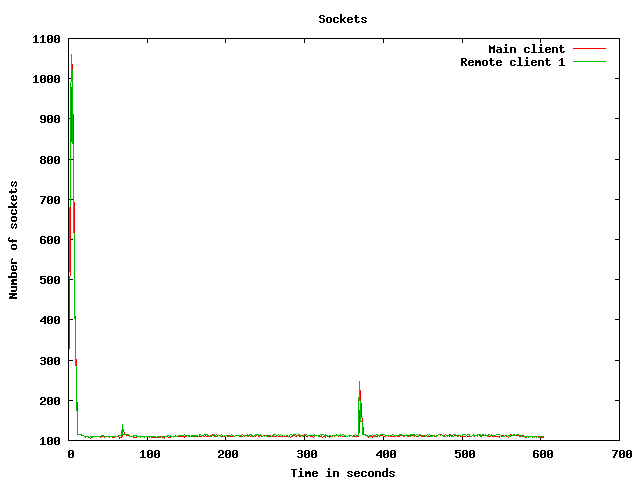
Network usage graphs
| Test start | 2009-3-19 16:33:34 |
| Up ramp start | 2009-3-19 16:33:42 |
| Runtime session start | 2009-3-19 16:35:42 |
| Down ramp start | 2009-3-19 16:43:12 |
| Test end | 2009-3-19 16:45:14 |
| Up ramp length | 2 minutes 1 millisecond (requested 120000 ms) |
| Runtime session length | 7 minutes 30 seconds 0 millisecond (requested 450000 ms) |
| Down ramp length | 30 seconds 0 millisecond (requested 30000 ms) |
| Total test length | 11 minutes 40 seconds 772 milliseconds |
| State name | % of total | Count | Errors | Minimum Time | Maximum Time | Average Time |
|---|---|---|---|---|---|---|
Home | 10 % | 1630 | 0 | 0 ms | 9125 ms | 1872 ms
|
Register | 1 % | 213 | 0 | 0 ms | 9002 ms | 390 ms
|
RegisterUser | 1 % | 200 | 0 | 5 ms | 9009 ms | 235 ms
|
Browse | 10 % | 1582 | 0 | 0 ms | 9007 ms | 282 ms
|
BrowseCategories | 6 % | 1054 | 0 | 3 ms | 9008 ms | 201 ms
|
SearchItemsInCategory | 14 % | 2334 | 0 | 0 ms | 9010 ms | 157 ms
|
BrowseRegions | 2 % | 431 | 0 | 3 ms | 9015 ms | 217 ms
|
BrowseCategoriesInRegion | 2 % | 403 | 0 | 3 ms | 9025 ms | 235 ms
|
SearchItemsInRegion | 4 % | 779 | 0 | 0 ms | 9032 ms | 171 ms
|
ViewItem | 12 % | 1916 | 0 | 3 ms | 9012 ms | 156 ms
|
ViewUserInfo | 1 % | 292 | 0 | 3 ms | 3010 ms | 126 ms
|
ViewBidHistory | 1 % | 165 | 0 | 4 ms | 9026 ms | 140 ms
|
BuyNowAuth | 1 % | 173 | 0 | 2 ms | 518 ms | 7 ms
|
BuyNow | 1 % | 157 | 25 | 5 ms | 3766 ms | 68 ms
|
StoreBuyBow | 0 % | 112 | 0 | 4 ms | 3003 ms | 48 ms
|
PutBidAuth | 4 % | 645 | 0 | 0 ms | 9000 ms | 112 ms
|
PutBid | 3 % | 611 | 98 | 4 ms | 9012 ms | 94 ms
|
StoreBid | 2 % | 339 | 0 | 4 ms | 9002 ms | 156 ms
|
PutCommentAuth | 0 % | 0 | 0 | 0 ms | 0 ms | 0 ms
|
PutComment | 0 % | 61 | 6 | 4 ms | 2998 ms | 98 ms
|
StoreComment | 0 % | 49 | 0 | 5 ms | 9006 ms | 221 ms
|
Sell | 0 % | 114 | 0 | 0 ms | 4540 ms | 159 ms
|
SelectCategoryToSellItem | 0 % | 110 | 0 | 4 ms | 4085 ms | 131 ms
|
SellItemForm | 0 % | 105 | 0 | 2 ms | 4136 ms | 102 ms
|
RegisterItem | 0 % | 99 | 0 | 4 ms | 9010 ms | 271 ms
|
AboutMe (auth form) | 2 % | 341 | 0 | 0 ms | 9005 ms | 330 ms
|
AboutMe | 3 % | 471 | 0 | 4 ms | 9050 ms | 207 ms
|
Back probability | 7 % | 1134 | 0 | 0 ms | 0 ms | 0 ms
|
End of Session | 0 % | 153 | 0 | 0 ms | 0 ms | 0 ms
|
Total | 100 % | 15673 | 129 | - | - | 340 ms
|
Average throughput | 131 req/s
| |||||
Completed sessions | 140
| |||||
Total time | 7775 seconds
| |||||
Average session time | 55 seconds
| |||||
| State name | % of total | Count | Errors | Minimum Time | Maximum Time | Average Time |
|---|---|---|---|---|---|---|
Home | 4 % | 3527 | 0 | 0 ms | 1147 ms | 1 ms
|
Register | 1 % | 759 | 0 | 0 ms | 2999 ms | 5 ms
|
RegisterUser | 0 % | 732 | 2 | 5 ms | 1343 ms | 11 ms
|
Browse | 7 % | 5412 | 0 | 0 ms | 3004 ms | 6 ms
|
BrowseCategories | 5 % | 3838 | 0 | 3 ms | 3016 ms | 9 ms
|
SearchItemsInCategory | 16 % | 11981 | 0 | 0 ms | 3012 ms | 11 ms
|
BrowseRegions | 2 % | 1501 | 0 | 3 ms | 24 ms | 4 ms
|
BrowseCategoriesInRegion | 1 % | 1489 | 0 | 3 ms | 3017 ms | 10 ms
|
SearchItemsInRegion | 4 % | 3679 | 0 | 0 ms | 3134 ms | 16 ms
|
ViewItem | 14 % | 10625 | 0 | 3 ms | 3030 ms | 14 ms
|
ViewUserInfo | 3 % | 2279 | 0 | 3 ms | 1730 ms | 11 ms
|
ViewBidHistory | 1 % | 1323 | 0 | 3 ms | 3022 ms | 26 ms
|
BuyNowAuth | 1 % | 967 | 0 | 2 ms | 1205 ms | 5 ms
|
BuyNow | 1 % | 961 | 146 | 4 ms | 1573 ms | 12 ms
|
StoreBuyBow | 1 % | 795 | 0 | 4 ms | 1103 ms | 12 ms
|
PutBidAuth | 4 % | 3608 | 0 | 0 ms | 3006 ms | 6 ms
|
PutBid | 5 % | 4128 | 477 | 3 ms | 3018 ms | 17 ms
|
StoreBid | 3 % | 2681 | 1 | 4 ms | 3014 ms | 12 ms
|
PutCommentAuth | 0 % | 0 | 0 | 0 ms | 0 ms | 0 ms
|
PutComment | 0 % | 348 | 25 | 4 ms | 1772 ms | 13 ms
|
StoreComment | 0 % | 317 | 0 | 4 ms | 1256 ms | 11 ms
|
Sell | 0 % | 418 | 0 | 0 ms | 16 ms | 0 ms
|
SelectCategoryToSellItem | 0 % | 403 | 0 | 3 ms | 3005 ms | 16 ms
|
SellItemForm | 0 % | 391 | 0 | 2 ms | 19 ms | 3 ms
|
RegisterItem | 0 % | 382 | 0 | 4 ms | 446 ms | 8 ms
|
AboutMe (auth form) | 1 % | 1249 | 0 | 0 ms | 2992 ms | 5 ms
|
AboutMe | 2 % | 2085 | 0 | 4 ms | 2022 ms | 29 ms
|
Back probability | 10 % | 7691 | 0 | 0 ms | 0 ms | 0 ms
|
End of Session | 1 % | 1072 | 0 | 0 ms | 0 ms | 0 ms
|
Total | 100 % | 74641 | 651 | - | - | 10 ms
|
Average throughput | 167 req/s
| |||||
Completed sessions | 1068
| |||||
Total time | 255073 seconds
| |||||
Average session time | 238 seconds
| |||||
| State name | % of total | Count | Errors | Minimum Time | Maximum Time | Average Time |
|---|---|---|---|---|---|---|
Home | 4 % | 113 | 0 | 0 ms | 6 ms | 0 ms
|
Register | 1 % | 25 | 0 | 0 ms | 1 ms | 0 ms
|
RegisterUser | 1 % | 28 | 0 | 5 ms | 19 ms | 7 ms
|
Browse | 7 % | 189 | 0 | 0 ms | 4 ms | 0 ms
|
BrowseCategories | 4 % | 116 | 0 | 3 ms | 15 ms | 5 ms
|
SearchItemsInCategory | 16 % | 416 | 0 | 0 ms | 25 ms | 5 ms
|
BrowseRegions | 2 % | 50 | 0 | 3 ms | 9 ms | 3 ms
|
BrowseCategoriesInRegion | 1 % | 43 | 0 | 3 ms | 10 ms | 4 ms
|
SearchItemsInRegion | 4 % | 121 | 0 | 0 ms | 73 ms | 10 ms
|
ViewItem | 14 % | 351 | 0 | 3 ms | 83 ms | 8 ms
|
ViewUserInfo | 3 % | 77 | 0 | 3 ms | 13 ms | 5 ms
|
ViewBidHistory | 1 % | 36 | 0 | 4 ms | 57 ms | 15 ms
|
BuyNowAuth | 1 % | 31 | 0 | 2 ms | 7 ms | 2 ms
|
BuyNow | 1 % | 29 | 4 | 4 ms | 19 ms | 6 ms
|
StoreBuyBow | 0 % | 23 | 0 | 4 ms | 15 ms | 9 ms
|
PutBidAuth | 4 % | 115 | 0 | 0 ms | 9 ms | 2 ms
|
PutBid | 5 % | 124 | 17 | 5 ms | 22 ms | 9 ms
|
StoreBid | 3 % | 91 | 0 | 4 ms | 22 ms | 6 ms
|
PutCommentAuth | 0 % | 0 | 0 | 0 ms | 0 ms | 0 ms
|
PutComment | 0 % | 15 | 0 | 5 ms | 8 ms | 7 ms
|
StoreComment | 0 % | 18 | 0 | 4 ms | 10 ms | 5 ms
|
Sell | 0 % | 16 | 0 | 0 ms | 2 ms | 1 ms
|
SelectCategoryToSellItem | 0 % | 23 | 0 | 4 ms | 8 ms | 4 ms
|
SellItemForm | 0 % | 18 | 0 | 2 ms | 7 ms | 1 ms
|
RegisterItem | 0 % | 11 | 0 | 4 ms | 14 ms | 4 ms
|
AboutMe (auth form) | 1 % | 33 | 0 | 0 ms | 3 ms | 0 ms
|
AboutMe | 2 % | 67 | 0 | 11 ms | 42 ms | 20 ms
|
Back probability | 10 % | 259 | 0 | 0 ms | 0 ms | 0 ms
|
End of Session | 1 % | 41 | 0 | 0 ms | 0 ms | 0 ms
|
Total | 100 % | 2479 | 21 | - | - | 5 ms
|
Average throughput | 83 req/s
| |||||
Completed sessions | 41
| |||||
Total time | 15115 seconds
| |||||
Average session time | 368 seconds
| |||||
| State name | % of total | Count | Errors | Minimum Time | Maximum Time | Average Time |
|---|---|---|---|---|---|---|
Home | 5 % | 5270 | 0 | 0 ms | 9125 ms | 579 ms
|
Register | 1 % | 997 | 0 | 0 ms | 9002 ms | 88 ms
|
RegisterUser | 1 % | 960 | 2 | 5 ms | 9009 ms | 58 ms
|
Browse | 7 % | 7183 | 0 | 0 ms | 9007 ms | 67 ms
|
BrowseCategories | 5 % | 5008 | 0 | 3 ms | 9008 ms | 49 ms
|
SearchItemsInCategory | 15 % | 14779 | 0 | 0 ms | 9010 ms | 34 ms
|
BrowseRegions | 2 % | 1982 | 0 | 3 ms | 9015 ms | 51 ms
|
BrowseCategoriesInRegion | 2 % | 1935 | 0 | 3 ms | 9025 ms | 57 ms
|
SearchItemsInRegion | 4 % | 4589 | 0 | 0 ms | 9032 ms | 42 ms
|
ViewItem | 13 % | 12913 | 0 | 3 ms | 9012 ms | 35 ms
|
ViewUserInfo | 2 % | 2655 | 0 | 3 ms | 3010 ms | 24 ms
|
ViewBidHistory | 1 % | 1525 | 0 | 3 ms | 9026 ms | 38 ms
|
BuyNowAuth | 1 % | 1171 | 0 | 2 ms | 1205 ms | 5 ms
|
BuyNow | 1 % | 1147 | 175 | 4 ms | 3766 ms | 19 ms
|
StoreBuyBow | 1 % | 930 | 0 | 4 ms | 3003 ms | 16 ms
|
PutBidAuth | 4 % | 4368 | 0 | 0 ms | 9000 ms | 22 ms
|
PutBid | 5 % | 4871 | 592 | 3 ms | 9012 ms | 26 ms
|
StoreBid | 3 % | 3111 | 1 | 4 ms | 9002 ms | 28 ms
|
PutCommentAuth | 0 % | 0 | 0 | 0 ms | 0 ms | 0 ms
|
PutComment | 0 % | 424 | 31 | 4 ms | 2998 ms | 25 ms
|
StoreComment | 0 % | 384 | 0 | 4 ms | 9006 ms | 37 ms
|
Sell | 0 % | 548 | 0 | 0 ms | 4540 ms | 33 ms
|
SelectCategoryToSellItem | 0 % | 536 | 0 | 3 ms | 4085 ms | 39 ms
|
SellItemForm | 0 % | 514 | 0 | 2 ms | 4136 ms | 23 ms
|
RegisterItem | 0 % | 492 | 0 | 4 ms | 9010 ms | 61 ms
|
AboutMe (auth form) | 1 % | 1623 | 0 | 0 ms | 9005 ms | 73 ms
|
AboutMe | 2 % | 2640 | 0 | 4 ms | 9050 ms | 60 ms
|
Back probability | 9 % | 9084 | 0 | 0 ms | 0 ms | 0 ms
|
End of Session | 1 % | 1266 | 0 | 0 ms | 0 ms | 0 ms
|
Total | 100 % | 92905 | 801 | - | - | 65 ms
|
Average throughput | 156 req/s
| |||||
Completed sessions | 1266
| |||||
Total time | 283970 seconds
| |||||
Average session time | 224 seconds
| |||||
An error occured while waiting for remote processes termination (Skipping waits)
Command is: /usr/bin/scp farm6.csail.mit.edu:/tmp/client1 /home/drkp/sandbox/txcache/src/RUBiS-1.4.3/bench/2009-3-19@16:33:34//client1.bin
Command is: /usr/bin/ssh -x localhost /bin/bash -c 'LANG=en_GB.UTF-8 /usr/bin/sar -n DEV -n SOCK -rubcw 1 605 -f /home/drkp/sandbox/txcache/src/RUBiS-1.4.3/bench/2009-3-19@16:33:34//client1.bin > /home/drkp/sandbox/txcache/src/RUBiS-1.4.3/bench/2009-3-19@16:33:34//client1'
Command is: /usr/bin/scp farm14:/tmp/db_server0 /home/drkp/sandbox/txcache/src/RUBiS-1.4.3/bench/2009-3-19@16:33:34//db_server0.bin
Command is: /usr/bin/ssh -x localhost /bin/bash -c 'LANG=en_GB.UTF-8 /usr/bin/sar -n DEV -n SOCK -rubcw 1 605 -f /home/drkp/sandbox/txcache/src/RUBiS-1.4.3/bench/2009-3-19@16:33:34//db_server0.bin > /home/drkp/sandbox/txcache/src/RUBiS-1.4.3/bench/2009-3-19@16:33:34//db_server0'
Command is: /usr/bin/scp farm12.csail.mit.edu:/tmp/web_server0 /home/drkp/sandbox/txcache/src/RUBiS-1.4.3/bench/2009-3-19@16:33:34//web_server0.bin
Command is: /usr/bin/ssh -x localhost /bin/bash -c 'LANG=en_GB.UTF-8 /usr/bin/sar -n DEV -n SOCK -rubcw 1 605 -f /home/drkp/sandbox/txcache/src/RUBiS-1.4.3/bench/2009-3-19@16:33:34//web_server0.bin > /home/drkp/sandbox/txcache/src/RUBiS-1.4.3/bench/2009-3-19@16:33:34//web_server0'
Command is: /usr/bin/scp farm13.csail.mit.edu:/tmp/web_server1 /home/drkp/sandbox/txcache/src/RUBiS-1.4.3/bench/2009-3-19@16:33:34//web_server1.bin
Command is: /usr/bin/ssh -x localhost /bin/bash -c 'LANG=en_GB.UTF-8 /usr/bin/sar -n DEV -n SOCK -rubcw 1 605 -f /home/drkp/sandbox/txcache/src/RUBiS-1.4.3/bench/2009-3-19@16:33:34//web_server1.bin > /home/drkp/sandbox/txcache/src/RUBiS-1.4.3/bench/2009-3-19@16:33:34//web_server1'
Command is: /usr/bin/scp localhost:/tmp/client0 /home/drkp/sandbox/txcache/src/RUBiS-1.4.3/bench/2009-3-19@16:33:34//client0.bin
Command is: /usr/bin/ssh -x localhost /bin/bash -c 'LANG=en_GB.UTF-8 /usr/bin/sar -n DEV -n SOCK -rubcw 1 605 -f /home/drkp/sandbox/txcache/src/RUBiS-1.4.3/bench/2009-3-19@16:33:34//client0.bin > /home/drkp/sandbox/txcache/src/RUBiS-1.4.3/bench/2009-3-19@16:33:34//client0'
Command is: /usr/bin/scp farm6.csail.mit.edu:/tmp/trace_client1.html /home/drkp/sandbox/txcache/src/RUBiS-1.4.3/bench/2009-3-19@16:33:34//
Command is: /usr/bin/scp farm6.csail.mit.edu:/tmp/stat_client1.html /home/drkp/sandbox/txcache/src/RUBiS-1.4.3/bench/2009-3-19@16:33:34//
|
|
|
|
|
|
 | 
|
 | 
|
 | 
|
 | 
|
 | 
|
 | 
|
 | 
|
 | 
|
 | 
|