Node information
Test timing information
Up ramp statistics
Runtime session statistics
Down ramp statistics
Overall statistics
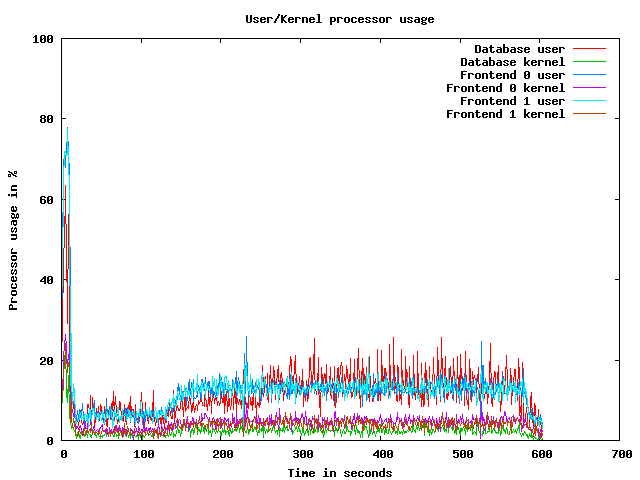
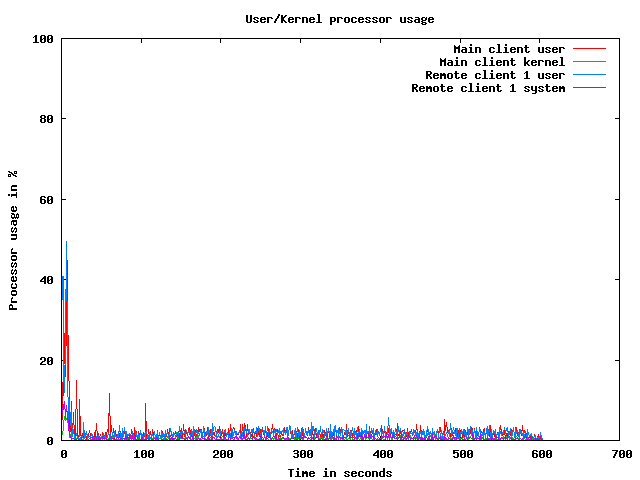
CPU usage graphs
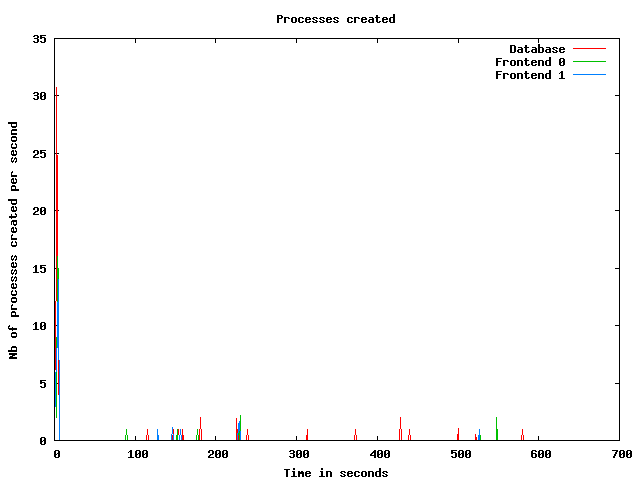
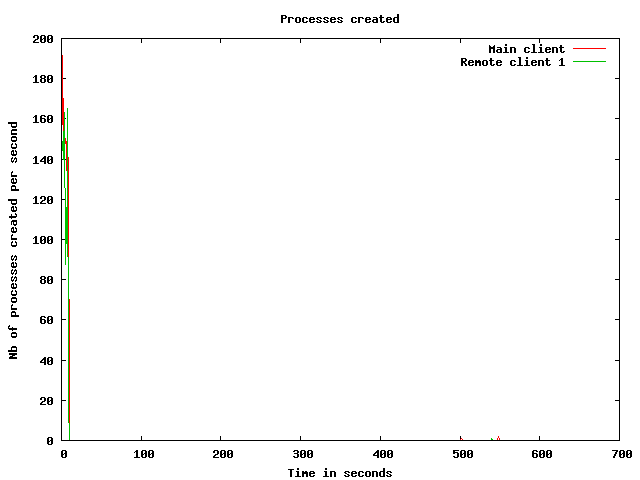
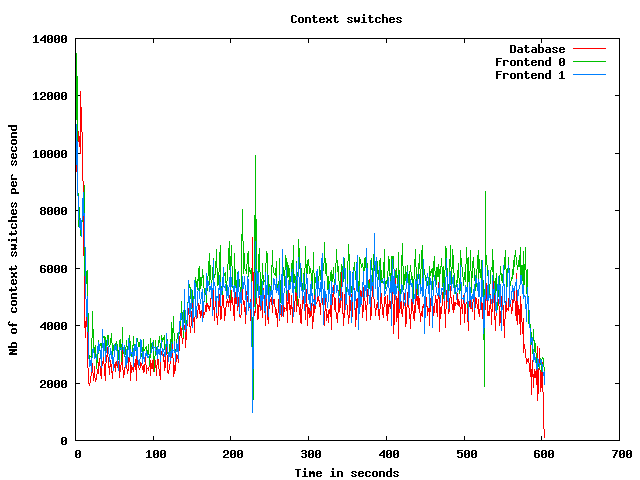
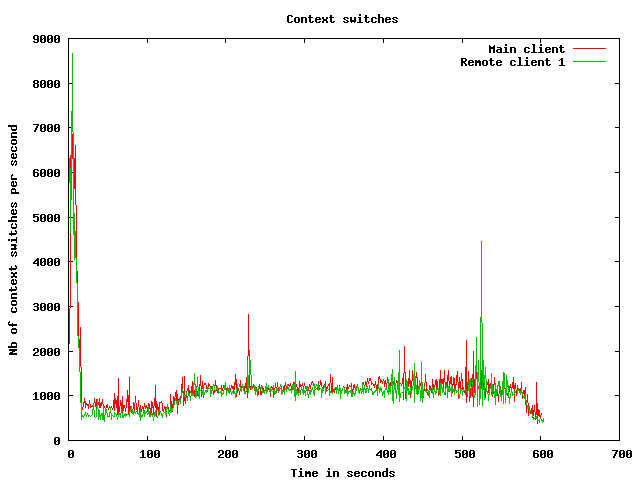
Processes usage graphs
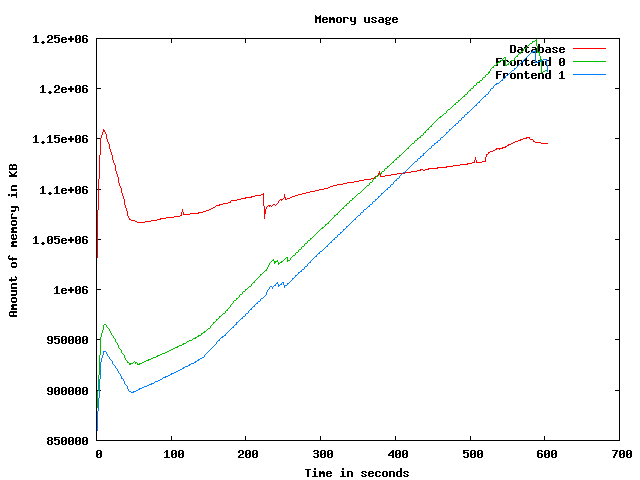
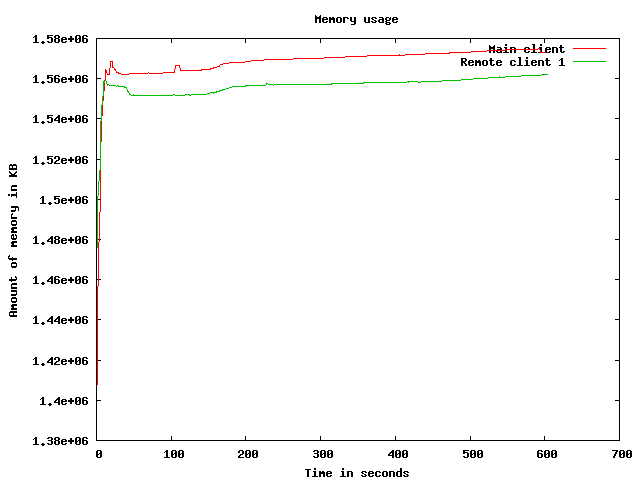
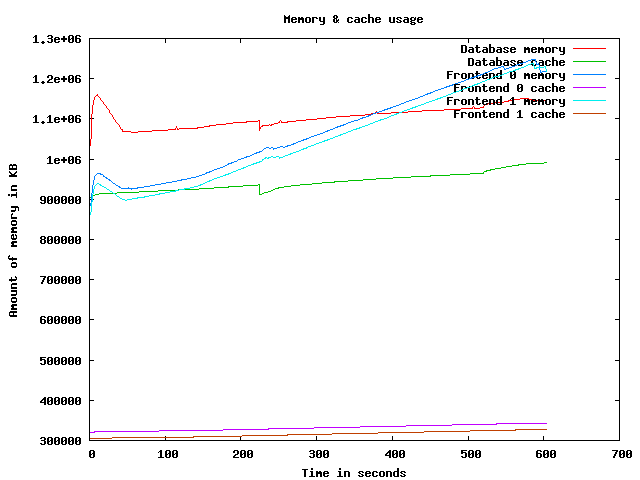
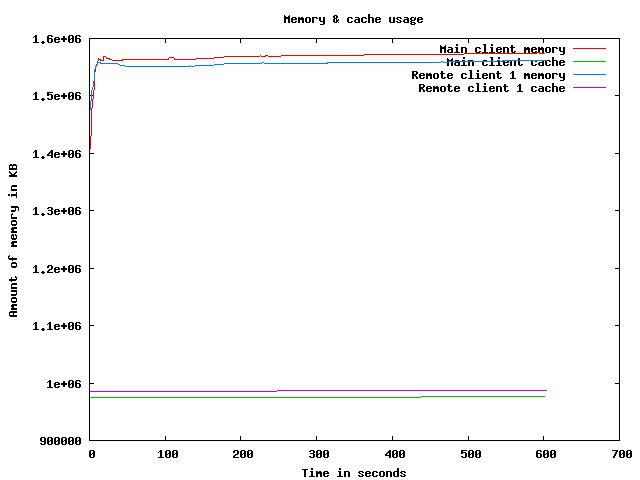
Memory usage graph
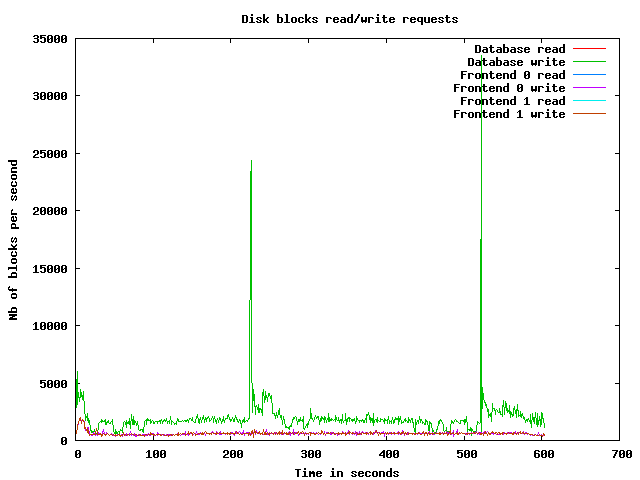
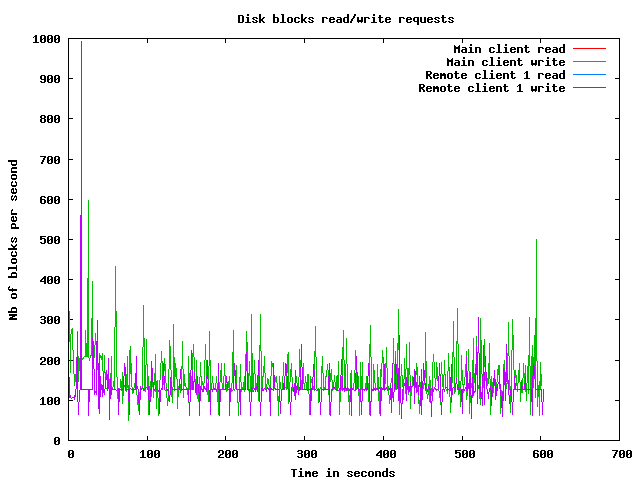
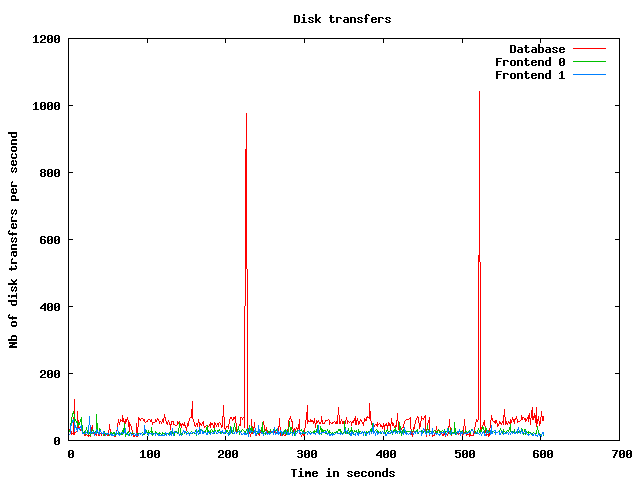
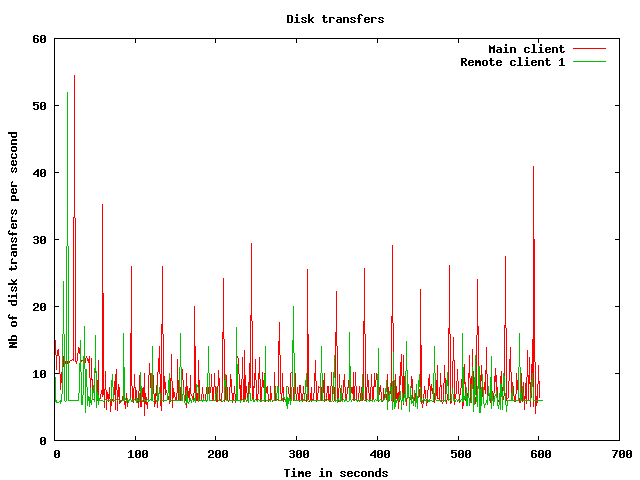
Disk usage graphs
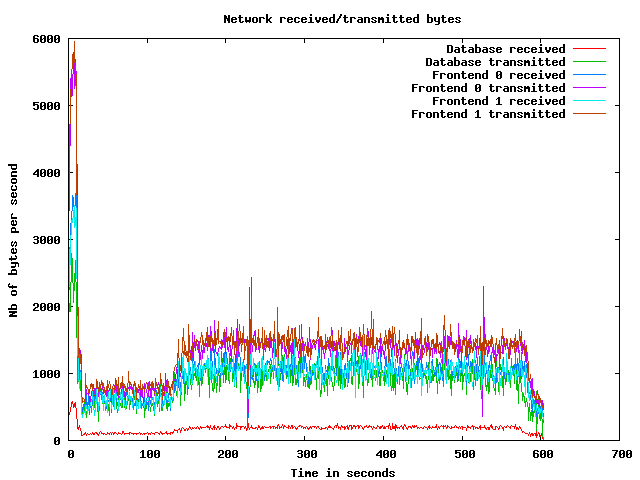
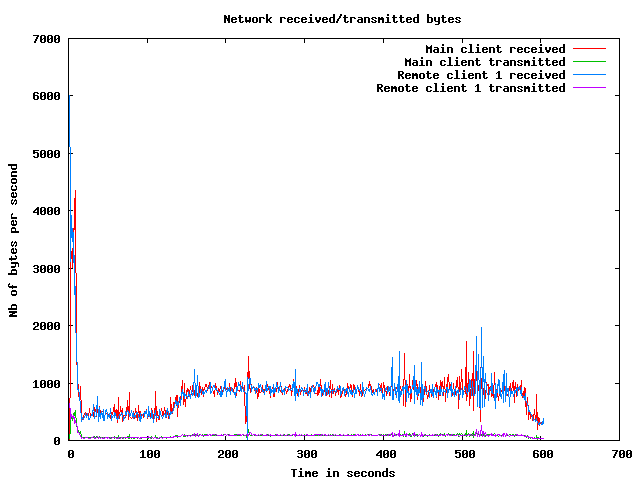
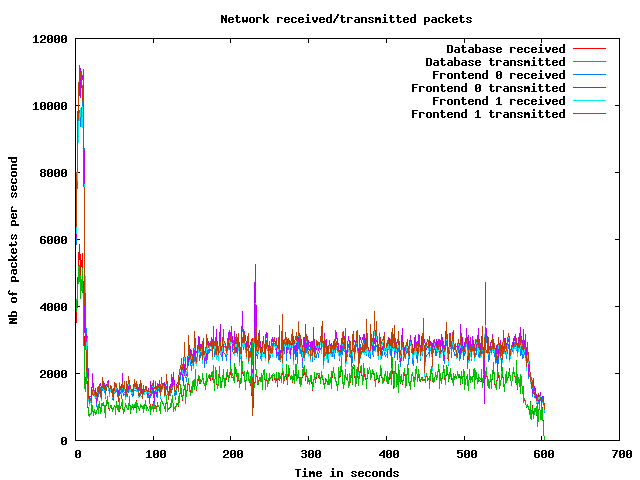
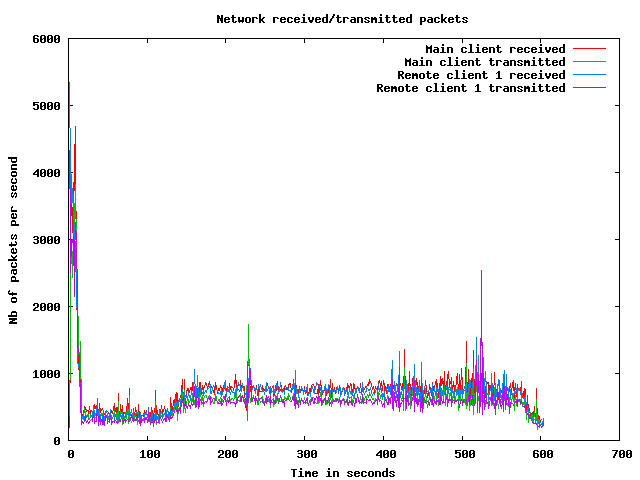
Network usage graphs
| Test start | 2009-3-19 16:45:58 |
| Up ramp start | 2009-3-19 16:46:10 |
| Runtime session start | 2009-3-19 16:48:10 |
| Down ramp start | 2009-3-19 16:55:40 |
| Test end | 2009-3-19 16:57:49 |
| Up ramp length | 2 minutes 1 millisecond (requested 120000 ms) |
| Runtime session length | 7 minutes 30 seconds 0 millisecond (requested 450000 ms) |
| Down ramp length | 30 seconds 0 millisecond (requested 30000 ms) |
| Total test length | 11 minutes 50 seconds 983 milliseconds |
| State name | % of total | Count | Errors | Minimum Time | Maximum Time | Average Time |
|---|---|---|---|---|---|---|
Home | 9 % | 2505 | 0 | 0 ms | 21005 ms | 1675 ms
|
Register | 1 % | 342 | 0 | 0 ms | 9025 ms | 554 ms
|
RegisterUser | 1 % | 316 | 0 | 5 ms | 9144 ms | 323 ms
|
Browse | 9 % | 2481 | 0 | 0 ms | 9818 ms | 495 ms
|
BrowseCategories | 6 % | 1630 | 0 | 3 ms | 9167 ms | 320 ms
|
SearchItemsInCategory | 14 % | 3667 | 0 | 0 ms | 9836 ms | 343 ms
|
BrowseRegions | 2 % | 693 | 0 | 3 ms | 9014 ms | 282 ms
|
BrowseCategoriesInRegion | 2 % | 646 | 0 | 3 ms | 9145 ms | 295 ms
|
SearchItemsInRegion | 4 % | 1255 | 0 | 0 ms | 9148 ms | 281 ms
|
ViewItem | 12 % | 3232 | 0 | 3 ms | 9863 ms | 275 ms
|
ViewUserInfo | 2 % | 617 | 0 | 3 ms | 9024 ms | 189 ms
|
ViewBidHistory | 1 % | 266 | 0 | 4 ms | 9031 ms | 240 ms
|
BuyNowAuth | 1 % | 257 | 0 | 2 ms | 9057 ms | 179 ms
|
BuyNow | 0 % | 230 | 32 | 4 ms | 9009 ms | 114 ms
|
StoreBuyBow | 0 % | 170 | 0 | 4 ms | 9006 ms | 137 ms
|
PutBidAuth | 4 % | 1104 | 0 | 0 ms | 9014 ms | 259 ms
|
PutBid | 4 % | 1076 | 171 | 4 ms | 9020 ms | 215 ms
|
StoreBid | 2 % | 619 | 0 | 4 ms | 9016 ms | 149 ms
|
PutCommentAuth | 0 % | 0 | 0 | 0 ms | 0 ms | 0 ms
|
PutComment | 0 % | 91 | 11 | 4 ms | 9839 ms | 165 ms
|
StoreComment | 0 % | 75 | 0 | 4 ms | 9115 ms | 221 ms
|
Sell | 0 % | 189 | 0 | 0 ms | 9135 ms | 572 ms
|
SelectCategoryToSellItem | 0 % | 179 | 0 | 4 ms | 9012 ms | 170 ms
|
SellItemForm | 0 % | 162 | 0 | 2 ms | 9014 ms | 144 ms
|
RegisterItem | 0 % | 150 | 0 | 4 ms | 9072 ms | 307 ms
|
AboutMe (auth form) | 2 % | 601 | 0 | 0 ms | 9050 ms | 438 ms
|
AboutMe | 3 % | 838 | 0 | 4 ms | 9058 ms | 444 ms
|
Back probability | 7 % | 1957 | 0 | 0 ms | 0 ms | 0 ms
|
End of Session | 0 % | 251 | 0 | 0 ms | 0 ms | 0 ms
|
Total | 100 % | 25599 | 214 | - | - | 422 ms
|
Average throughput | 215 req/s
| |||||
Completed sessions | 221
| |||||
Total time | 11420 seconds
| |||||
Average session time | 51 seconds
| |||||
| State name | % of total | Count | Errors | Minimum Time | Maximum Time | Average Time |
|---|---|---|---|---|---|---|
Home | 4 % | 5421 | 0 | 0 ms | 3000 ms | 2 ms
|
Register | 1 % | 1186 | 0 | 0 ms | 2997 ms | 4 ms
|
RegisterUser | 1 % | 1150 | 7 | 5 ms | 2006 ms | 15 ms
|
Browse | 7 % | 8139 | 0 | 0 ms | 3010 ms | 9 ms
|
BrowseCategories | 5 % | 5720 | 0 | 3 ms | 3021 ms | 13 ms
|
SearchItemsInCategory | 15 % | 17671 | 0 | 0 ms | 3024 ms | 15 ms
|
BrowseRegions | 2 % | 2338 | 0 | 3 ms | 3010 ms | 12 ms
|
BrowseCategoriesInRegion | 2 % | 2295 | 0 | 3 ms | 3007 ms | 12 ms
|
SearchItemsInRegion | 4 % | 5442 | 0 | 0 ms | 3039 ms | 23 ms
|
ViewItem | 14 % | 15823 | 0 | 3 ms | 3032 ms | 19 ms
|
ViewUserInfo | 3 % | 3454 | 0 | 3 ms | 3009 ms | 15 ms
|
ViewBidHistory | 1 % | 1799 | 0 | 3 ms | 3031 ms | 29 ms
|
BuyNowAuth | 1 % | 1430 | 0 | 2 ms | 2996 ms | 7 ms
|
BuyNow | 1 % | 1405 | 186 | 4 ms | 3017 ms | 17 ms
|
StoreBuyBow | 1 % | 1203 | 0 | 4 ms | 3012 ms | 23 ms
|
PutBidAuth | 4 % | 5478 | 0 | 0 ms | 3013 ms | 11 ms
|
PutBid | 5 % | 6090 | 789 | 3 ms | 3033 ms | 19 ms
|
StoreBid | 3 % | 3960 | 1 | 4 ms | 3037 ms | 18 ms
|
PutCommentAuth | 0 % | 0 | 0 | 0 ms | 0 ms | 0 ms
|
PutComment | 0 % | 521 | 49 | 4 ms | 3016 ms | 24 ms
|
StoreComment | 0 % | 464 | 0 | 4 ms | 3002 ms | 17 ms
|
Sell | 0 % | 655 | 0 | 0 ms | 1270 ms | 6 ms
|
SelectCategoryToSellItem | 0 % | 639 | 0 | 3 ms | 3008 ms | 23 ms
|
SellItemForm | 0 % | 631 | 0 | 2 ms | 3012 ms | 18 ms
|
RegisterItem | 0 % | 624 | 0 | 4 ms | 3011 ms | 26 ms
|
AboutMe (auth form) | 1 % | 1865 | 0 | 0 ms | 3005 ms | 4 ms
|
AboutMe | 2 % | 3288 | 0 | 4 ms | 3065 ms | 36 ms
|
Back probability | 10 % | 11203 | 0 | 0 ms | 0 ms | 0 ms
|
End of Session | 1 % | 1613 | 0 | 0 ms | 0 ms | 0 ms
|
Total | 100 % | 111507 | 1032 | - | - | 14 ms
|
Average throughput | 250 req/s
| |||||
Completed sessions | 1622
| |||||
Total time | 403200 seconds
| |||||
Average session time | 248 seconds
| |||||
| State name | % of total | Count | Errors | Minimum Time | Maximum Time | Average Time |
|---|---|---|---|---|---|---|
Home | 3 % | 144 | 0 | 0 ms | 3 ms | 0 ms
|
Register | 0 % | 33 | 0 | 0 ms | 5 ms | 1 ms
|
RegisterUser | 1 % | 38 | 1 | 5 ms | 29 ms | 7 ms
|
Browse | 6 % | 235 | 0 | 0 ms | 9 ms | 0 ms
|
BrowseCategories | 4 % | 175 | 0 | 3 ms | 17 ms | 4 ms
|
SearchItemsInCategory | 15 % | 582 | 0 | 0 ms | 40 ms | 7 ms
|
BrowseRegions | 1 % | 67 | 0 | 3 ms | 21 ms | 6 ms
|
BrowseCategoriesInRegion | 2 % | 87 | 0 | 3 ms | 14 ms | 4 ms
|
SearchItemsInRegion | 4 % | 177 | 0 | 0 ms | 126 ms | 15 ms
|
ViewItem | 14 % | 523 | 0 | 3 ms | 112 ms | 10 ms
|
ViewUserInfo | 4 % | 146 | 0 | 3 ms | 32 ms | 6 ms
|
ViewBidHistory | 1 % | 53 | 0 | 4 ms | 70 ms | 19 ms
|
BuyNowAuth | 1 % | 53 | 0 | 2 ms | 12 ms | 3 ms
|
BuyNow | 1 % | 48 | 10 | 4 ms | 15 ms | 7 ms
|
StoreBuyBow | 1 % | 38 | 0 | 5 ms | 11 ms | 5 ms
|
PutBidAuth | 4 % | 178 | 0 | 0 ms | 14 ms | 3 ms
|
PutBid | 6 % | 220 | 20 | 5 ms | 29 ms | 8 ms
|
StoreBid | 3 % | 130 | 0 | 4 ms | 24 ms | 6 ms
|
PutCommentAuth | 0 % | 0 | 0 | 0 ms | 0 ms | 0 ms
|
PutComment | 0 % | 15 | 0 | 5 ms | 12 ms | 2 ms
|
StoreComment | 0 % | 5 | 0 | 4 ms | 12 ms | 19 ms
|
Sell | 0 % | 16 | 0 | 0 ms | 3 ms | 0 ms
|
SelectCategoryToSellItem | 0 % | 19 | 0 | 4 ms | 21 ms | 9 ms
|
SellItemForm | 0 % | 19 | 0 | 2 ms | 6 ms | 3 ms
|
RegisterItem | 0 % | 19 | 0 | 4 ms | 28 ms | 8 ms
|
AboutMe (auth form) | 1 % | 63 | 0 | 0 ms | 2 ms | 0 ms
|
AboutMe | 3 % | 113 | 0 | 4 ms | 71 ms | 22 ms
|
Back probability | 10 % | 399 | 0 | 0 ms | 0 ms | 0 ms
|
End of Session | 1 % | 43 | 0 | 0 ms | 0 ms | 0 ms
|
Total | 100 % | 3638 | 31 | - | - | 6 ms
|
Average throughput | 122 req/s
| |||||
Completed sessions | 41
| |||||
Total time | 11362 seconds
| |||||
Average session time | 277 seconds
| |||||
| State name | % of total | Count | Errors | Minimum Time | Maximum Time | Average Time |
|---|---|---|---|---|---|---|
Home | 5 % | 8070 | 0 | 0 ms | 21005 ms | 521 ms
|
Register | 1 % | 1561 | 0 | 0 ms | 9025 ms | 125 ms
|
RegisterUser | 1 % | 1504 | 8 | 5 ms | 9144 ms | 79 ms
|
Browse | 7 % | 10855 | 0 | 0 ms | 9818 ms | 120 ms
|
BrowseCategories | 5 % | 7525 | 0 | 3 ms | 9167 ms | 79 ms
|
SearchItemsInCategory | 15 % | 22004 | 0 | 0 ms | 9836 ms | 69 ms
|
BrowseRegions | 2 % | 3098 | 0 | 3 ms | 9014 ms | 73 ms
|
BrowseCategoriesInRegion | 2 % | 3028 | 0 | 3 ms | 9145 ms | 72 ms
|
SearchItemsInRegion | 4 % | 6889 | 0 | 0 ms | 9148 ms | 70 ms
|
ViewItem | 13 % | 19610 | 0 | 3 ms | 9863 ms | 61 ms
|
ViewUserInfo | 3 % | 4231 | 0 | 3 ms | 9024 ms | 40 ms
|
ViewBidHistory | 1 % | 2124 | 0 | 3 ms | 9031 ms | 55 ms
|
BuyNowAuth | 1 % | 1740 | 0 | 2 ms | 9057 ms | 32 ms
|
BuyNow | 1 % | 1683 | 228 | 4 ms | 9009 ms | 30 ms
|
StoreBuyBow | 1 % | 1411 | 0 | 4 ms | 9006 ms | 36 ms
|
PutBidAuth | 4 % | 6760 | 0 | 0 ms | 9014 ms | 51 ms
|
PutBid | 5 % | 7404 | 980 | 3 ms | 9020 ms | 47 ms
|
StoreBid | 3 % | 4709 | 1 | 4 ms | 9016 ms | 35 ms
|
PutCommentAuth | 0 % | 0 | 0 | 0 ms | 0 ms | 0 ms
|
PutComment | 0 % | 627 | 60 | 4 ms | 9839 ms | 44 ms
|
StoreComment | 0 % | 544 | 0 | 4 ms | 9115 ms | 45 ms
|
Sell | 0 % | 860 | 0 | 0 ms | 9135 ms | 131 ms
|
SelectCategoryToSellItem | 0 % | 837 | 0 | 3 ms | 9012 ms | 54 ms
|
SellItemForm | 0 % | 812 | 0 | 2 ms | 9014 ms | 42 ms
|
RegisterItem | 0 % | 793 | 0 | 4 ms | 9072 ms | 79 ms
|
AboutMe (auth form) | 1 % | 2529 | 0 | 0 ms | 9050 ms | 107 ms
|
AboutMe | 3 % | 4262 | 0 | 4 ms | 9058 ms | 115 ms
|
Back probability | 9 % | 13559 | 0 | 0 ms | 0 ms | 0 ms
|
End of Session | 1 % | 1907 | 0 | 0 ms | 0 ms | 0 ms
|
Total | 100 % | 140936 | 1277 | - | - | 87 ms
|
Average throughput | 237 req/s
| |||||
Completed sessions | 1907
| |||||
Total time | 433972 seconds
| |||||
Average session time | 227 seconds
| |||||
An error occured while waiting for remote processes termination (Skipping waits)
Command is: /usr/bin/scp farm6.csail.mit.edu:/tmp/client1 /home/drkp/sandbox/txcache/src/RUBiS-1.4.3/bench/2009-3-19@16:45:58//client1.bin
Command is: /usr/bin/ssh -x localhost /bin/bash -c 'LANG=en_GB.UTF-8 /usr/bin/sar -n DEV -n SOCK -rubcw 1 605 -f /home/drkp/sandbox/txcache/src/RUBiS-1.4.3/bench/2009-3-19@16:45:58//client1.bin > /home/drkp/sandbox/txcache/src/RUBiS-1.4.3/bench/2009-3-19@16:45:58//client1'
Command is: /usr/bin/scp farm14:/tmp/db_server0 /home/drkp/sandbox/txcache/src/RUBiS-1.4.3/bench/2009-3-19@16:45:58//db_server0.bin
Command is: /usr/bin/ssh -x localhost /bin/bash -c 'LANG=en_GB.UTF-8 /usr/bin/sar -n DEV -n SOCK -rubcw 1 605 -f /home/drkp/sandbox/txcache/src/RUBiS-1.4.3/bench/2009-3-19@16:45:58//db_server0.bin > /home/drkp/sandbox/txcache/src/RUBiS-1.4.3/bench/2009-3-19@16:45:58//db_server0'
Command is: /usr/bin/scp farm12.csail.mit.edu:/tmp/web_server0 /home/drkp/sandbox/txcache/src/RUBiS-1.4.3/bench/2009-3-19@16:45:58//web_server0.bin
Command is: /usr/bin/ssh -x localhost /bin/bash -c 'LANG=en_GB.UTF-8 /usr/bin/sar -n DEV -n SOCK -rubcw 1 605 -f /home/drkp/sandbox/txcache/src/RUBiS-1.4.3/bench/2009-3-19@16:45:58//web_server0.bin > /home/drkp/sandbox/txcache/src/RUBiS-1.4.3/bench/2009-3-19@16:45:58//web_server0'
Command is: /usr/bin/scp farm13.csail.mit.edu:/tmp/web_server1 /home/drkp/sandbox/txcache/src/RUBiS-1.4.3/bench/2009-3-19@16:45:58//web_server1.bin
Command is: /usr/bin/ssh -x localhost /bin/bash -c 'LANG=en_GB.UTF-8 /usr/bin/sar -n DEV -n SOCK -rubcw 1 605 -f /home/drkp/sandbox/txcache/src/RUBiS-1.4.3/bench/2009-3-19@16:45:58//web_server1.bin > /home/drkp/sandbox/txcache/src/RUBiS-1.4.3/bench/2009-3-19@16:45:58//web_server1'
Command is: /usr/bin/scp localhost:/tmp/client0 /home/drkp/sandbox/txcache/src/RUBiS-1.4.3/bench/2009-3-19@16:45:58//client0.bin
Command is: /usr/bin/ssh -x localhost /bin/bash -c 'LANG=en_GB.UTF-8 /usr/bin/sar -n DEV -n SOCK -rubcw 1 605 -f /home/drkp/sandbox/txcache/src/RUBiS-1.4.3/bench/2009-3-19@16:45:58//client0.bin > /home/drkp/sandbox/txcache/src/RUBiS-1.4.3/bench/2009-3-19@16:45:58//client0'
Command is: /usr/bin/scp farm6.csail.mit.edu:/tmp/trace_client1.html /home/drkp/sandbox/txcache/src/RUBiS-1.4.3/bench/2009-3-19@16:45:58//
Command is: /usr/bin/scp farm6.csail.mit.edu:/tmp/stat_client1.html /home/drkp/sandbox/txcache/src/RUBiS-1.4.3/bench/2009-3-19@16:45:58//
|
|
|
|
|
|
 | 
|
 | 
|
 | 
|
 | 
|
 | 
|
 | 
|
 | 
|
 | 
|
 | 
|