Node information
Test timing information
Up ramp statistics
Runtime session statistics
Down ramp statistics
Overall statistics
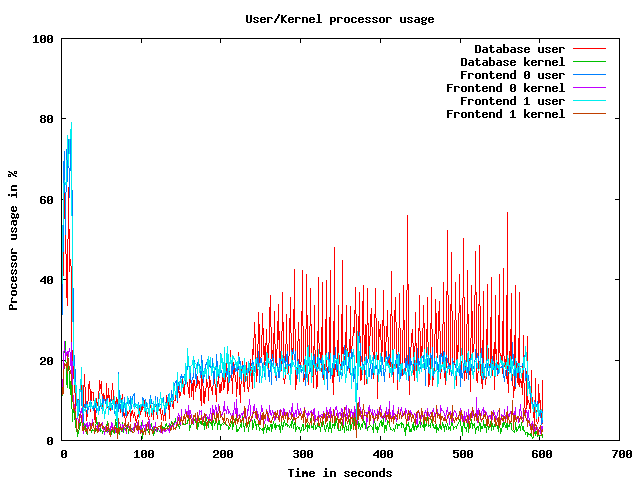
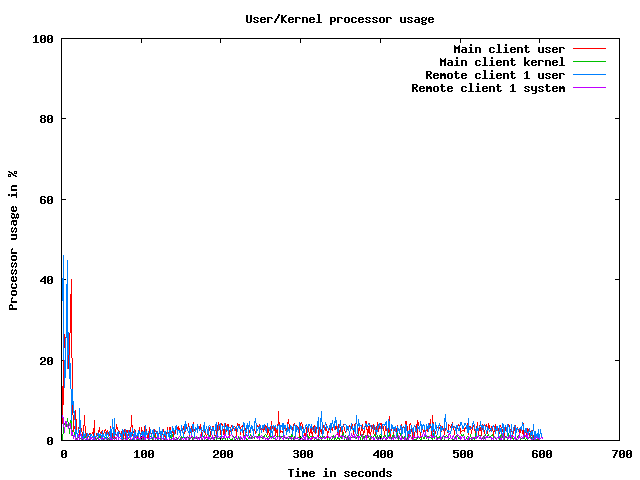
CPU usage graphs
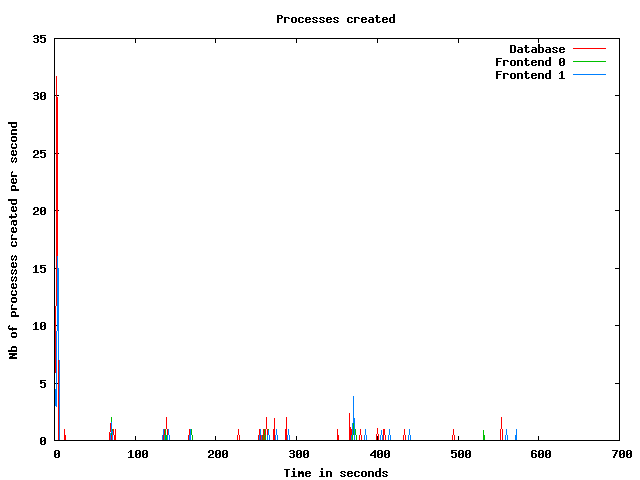
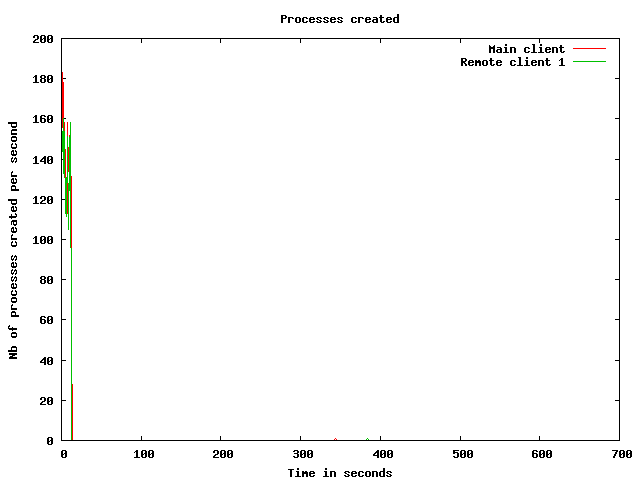
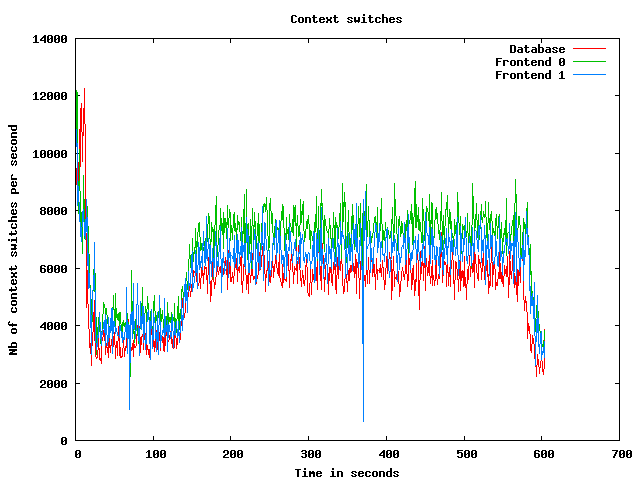
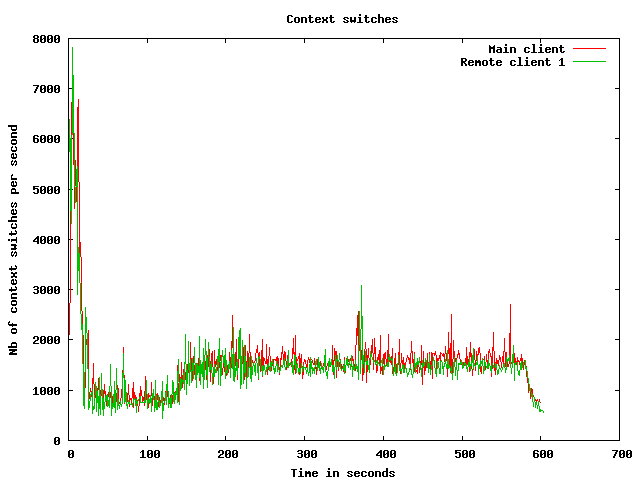
Processes usage graphs
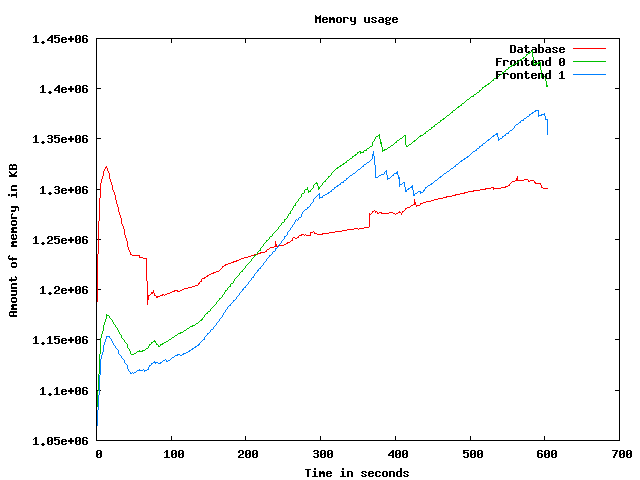
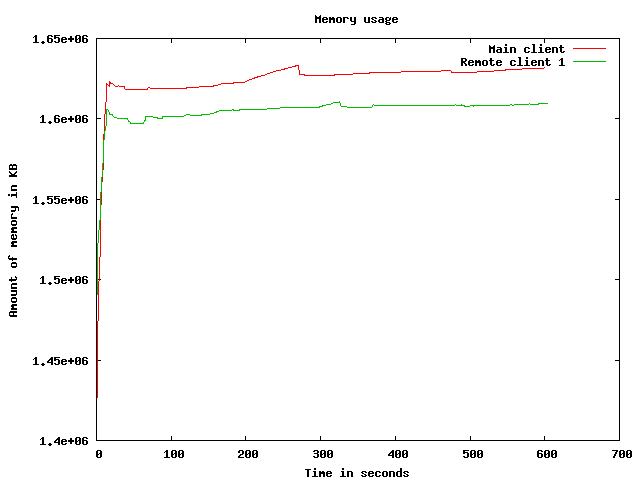
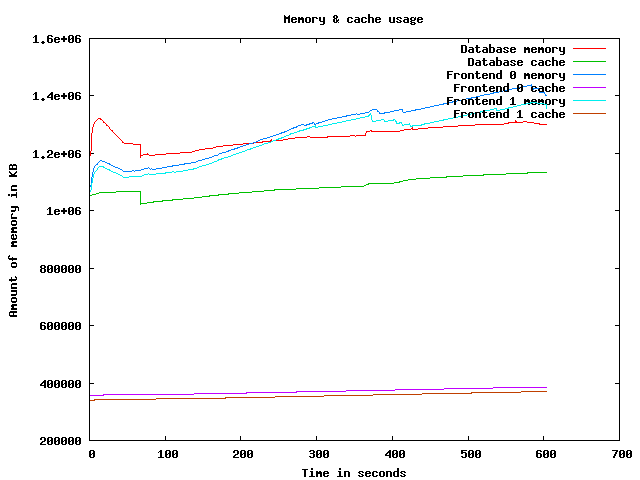
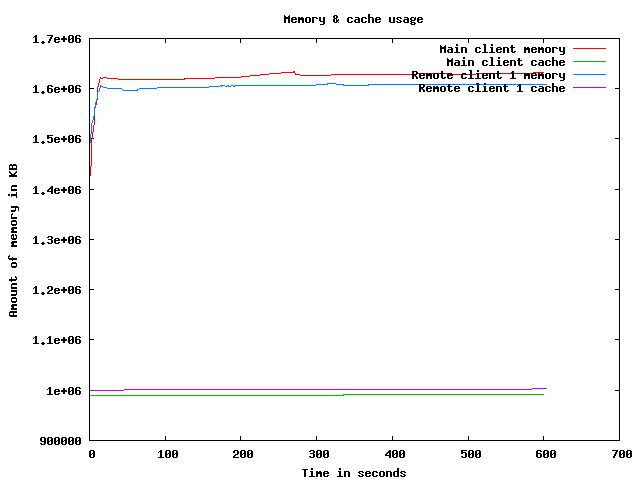
Memory usage graph
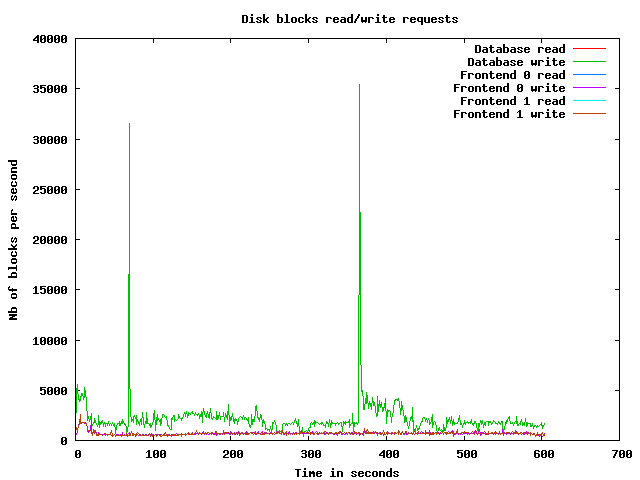
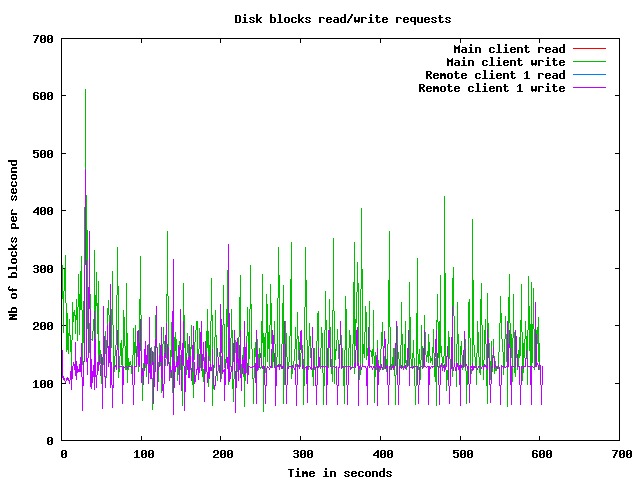
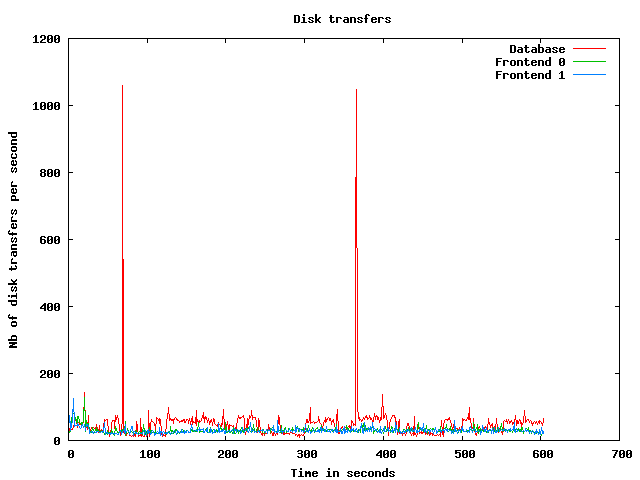
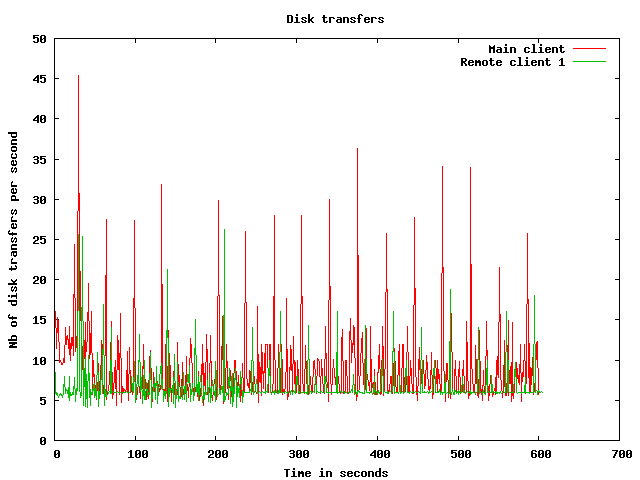
Disk usage graphs
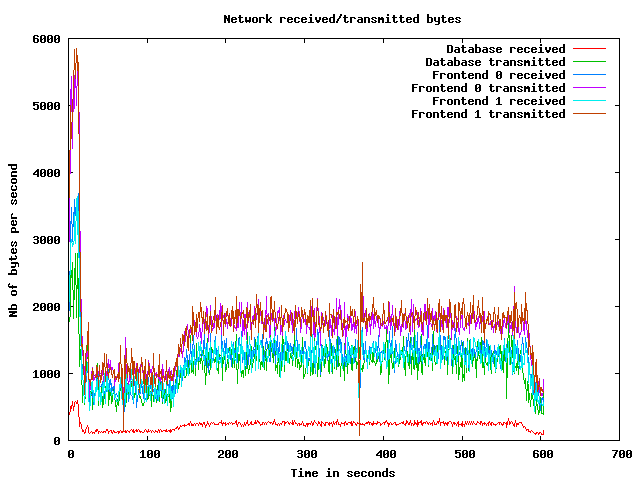
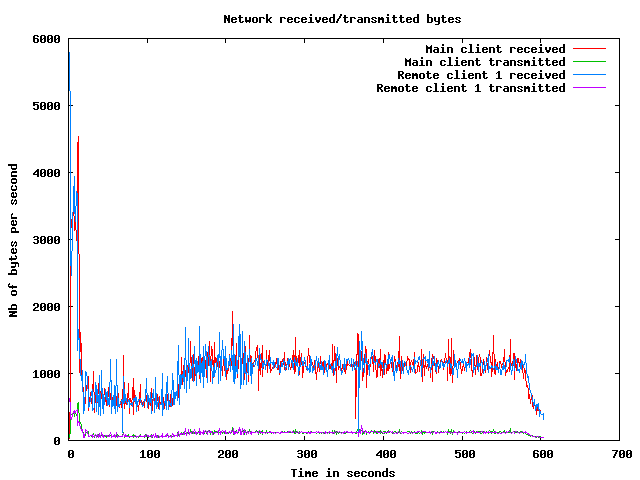
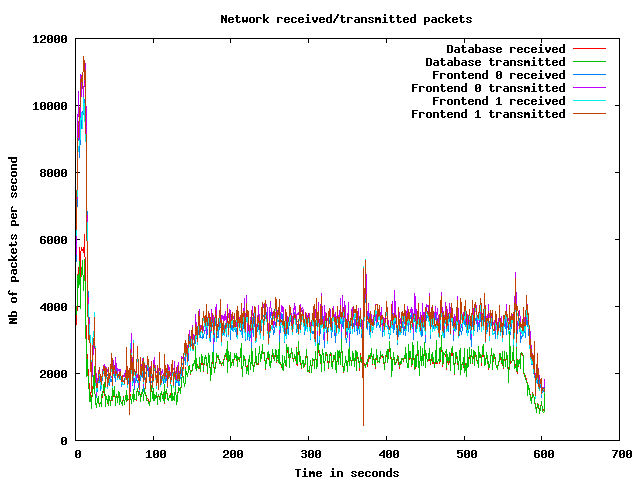
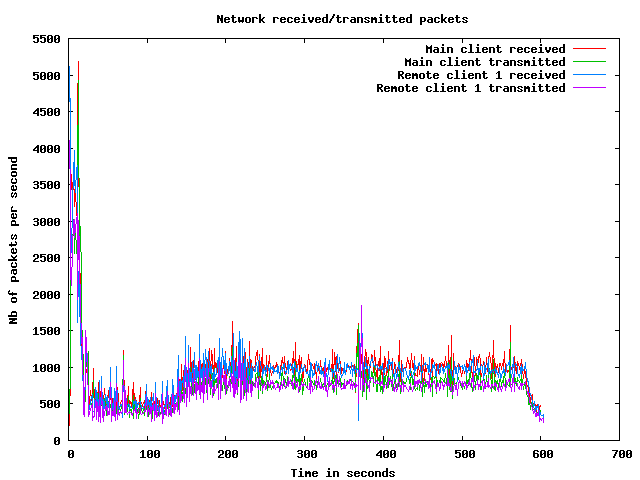
Network usage graphs
| Test start | 2009-3-19 16:58:34 |
| Up ramp start | 2009-3-19 16:58:50 |
| Runtime session start | 2009-3-19 17:0:50 |
| Down ramp start | 2009-3-19 17:8:20 |
| Test end | 2009-3-19 17:10:30 |
| Up ramp length | 2 minutes 0 millisecond (requested 120000 ms) |
| Runtime session length | 7 minutes 30 seconds 1 millisecond (requested 450000 ms) |
| Down ramp length | 30 seconds 0 millisecond (requested 30000 ms) |
| Total test length | 11 minutes 55 seconds 654 milliseconds |
| State name | % of total | Count | Errors | Minimum Time | Maximum Time | Average Time |
|---|---|---|---|---|---|---|
Home | 9 % | 3294 | 0 | 0 ms | 21029 ms | 2613 ms
|
Register | 1 % | 470 | 0 | 0 ms | 21018 ms | 882 ms
|
RegisterUser | 1 % | 435 | 1 | 5 ms | 21010 ms | 565 ms
|
Browse | 9 % | 3299 | 0 | 0 ms | 21007 ms | 754 ms
|
BrowseCategories | 6 % | 2186 | 0 | 3 ms | 21011 ms | 497 ms
|
SearchItemsInCategory | 14 % | 5121 | 0 | 0 ms | 21047 ms | 403 ms
|
BrowseRegions | 2 % | 920 | 0 | 3 ms | 21024 ms | 494 ms
|
BrowseCategoriesInRegion | 2 % | 860 | 0 | 3 ms | 21013 ms | 423 ms
|
SearchItemsInRegion | 4 % | 1718 | 0 | 0 ms | 21106 ms | 323 ms
|
ViewItem | 12 % | 4405 | 0 | 3 ms | 21032 ms | 371 ms
|
ViewUserInfo | 2 % | 769 | 0 | 3 ms | 21025 ms | 335 ms
|
ViewBidHistory | 1 % | 431 | 0 | 3 ms | 9070 ms | 231 ms
|
BuyNowAuth | 1 % | 352 | 0 | 2 ms | 20994 ms | 371 ms
|
BuyNow | 0 % | 316 | 44 | 4 ms | 9031 ms | 272 ms
|
StoreBuyBow | 0 % | 241 | 0 | 4 ms | 9006 ms | 228 ms
|
PutBidAuth | 4 % | 1481 | 0 | 0 ms | 21001 ms | 298 ms
|
PutBid | 4 % | 1440 | 205 | 4 ms | 21038 ms | 321 ms
|
StoreBid | 2 % | 826 | 1 | 4 ms | 21014 ms | 373 ms
|
PutCommentAuth | 0 % | 0 | 0 | 0 ms | 0 ms | 0 ms
|
PutComment | 0 % | 133 | 12 | 4 ms | 9364 ms | 309 ms
|
StoreComment | 0 % | 101 | 0 | 4 ms | 9060 ms | 452 ms
|
Sell | 0 % | 229 | 0 | 0 ms | 10056 ms | 497 ms
|
SelectCategoryToSellItem | 0 % | 214 | 0 | 4 ms | 9994 ms | 375 ms
|
SellItemForm | 0 % | 194 | 0 | 2 ms | 9011 ms | 294 ms
|
RegisterItem | 0 % | 174 | 0 | 4 ms | 21008 ms | 752 ms
|
AboutMe (auth form) | 2 % | 771 | 0 | 0 ms | 21005 ms | 823 ms
|
AboutMe | 3 % | 1059 | 0 | 4 ms | 21084 ms | 638 ms
|
Back probability | 8 % | 2774 | 0 | 0 ms | 0 ms | 0 ms
|
End of Session | 0 % | 338 | 0 | 0 ms | 0 ms | 0 ms
|
Total | 100 % | 34551 | 263 | - | - | 618 ms
|
Average throughput | 290 req/s
| |||||
Completed sessions | 308
| |||||
Total time | 14824 seconds
| |||||
Average session time | 48 seconds
| |||||
| State name | % of total | Count | Errors | Minimum Time | Maximum Time | Average Time |
|---|---|---|---|---|---|---|
Home | 4 % | 7118 | 0 | 0 ms | 3054 ms | 2 ms
|
Register | 1 % | 1569 | 0 | 0 ms | 3018 ms | 5 ms
|
RegisterUser | 1 % | 1532 | 16 | 4 ms | 3010 ms | 15 ms
|
Browse | 7 % | 10770 | 0 | 0 ms | 3045 ms | 7 ms
|
BrowseCategories | 5 % | 7421 | 0 | 3 ms | 3056 ms | 11 ms
|
SearchItemsInCategory | 15 % | 23081 | 0 | 0 ms | 3071 ms | 15 ms
|
BrowseRegions | 2 % | 3203 | 0 | 3 ms | 3005 ms | 8 ms
|
BrowseCategoriesInRegion | 2 % | 3162 | 0 | 3 ms | 3034 ms | 16 ms
|
SearchItemsInRegion | 5 % | 7555 | 0 | 0 ms | 3211 ms | 24 ms
|
ViewItem | 14 % | 21157 | 0 | 3 ms | 3075 ms | 19 ms
|
ViewUserInfo | 3 % | 4584 | 0 | 3 ms | 3018 ms | 12 ms
|
ViewBidHistory | 1 % | 2488 | 0 | 3 ms | 3009 ms | 27 ms
|
BuyNowAuth | 1 % | 1979 | 0 | 2 ms | 3049 ms | 7 ms
|
BuyNow | 1 % | 1947 | 286 | 4 ms | 1483 ms | 13 ms
|
StoreBuyBow | 1 % | 1624 | 1 | 4 ms | 3015 ms | 13 ms
|
PutBidAuth | 4 % | 7177 | 0 | 0 ms | 3013 ms | 7 ms
|
PutBid | 5 % | 8116 | 1072 | 4 ms | 3046 ms | 19 ms
|
StoreBid | 3 % | 5191 | 1 | 4 ms | 3120 ms | 20 ms
|
PutCommentAuth | 0 % | 0 | 0 | 0 ms | 0 ms | 0 ms
|
PutComment | 0 % | 703 | 61 | 4 ms | 1495 ms | 13 ms
|
StoreComment | 0 % | 636 | 0 | 4 ms | 3014 ms | 23 ms
|
Sell | 0 % | 792 | 0 | 0 ms | 1476 ms | 4 ms
|
SelectCategoryToSellItem | 0 % | 771 | 0 | 4 ms | 150 ms | 10 ms
|
SellItemForm | 0 % | 760 | 0 | 2 ms | 39 ms | 4 ms
|
RegisterItem | 0 % | 754 | 0 | 4 ms | 3025 ms | 22 ms
|
AboutMe (auth form) | 1 % | 2451 | 0 | 0 ms | 2999 ms | 9 ms
|
AboutMe | 2 % | 4175 | 0 | 4 ms | 3084 ms | 36 ms
|
Back probability | 10 % | 14910 | 0 | 0 ms | 0 ms | 0 ms
|
End of Session | 1 % | 2035 | 0 | 0 ms | 0 ms | 0 ms
|
Total | 100 % | 147661 | 1437 | - | - | 13 ms
|
Average throughput | 331 req/s
| |||||
Completed sessions | 2032
| |||||
Total time | 517240 seconds
| |||||
Average session time | 254 seconds
| |||||
| State name | % of total | Count | Errors | Minimum Time | Maximum Time | Average Time |
|---|---|---|---|---|---|---|
Home | 5 % | 257 | 0 | 0 ms | 8 ms | 0 ms
|
Register | 1 % | 58 | 0 | 0 ms | 6 ms | 0 ms
|
RegisterUser | 1 % | 57 | 0 | 5 ms | 32 ms | 8 ms
|
Browse | 7 % | 345 | 0 | 0 ms | 6 ms | 0 ms
|
BrowseCategories | 4 % | 233 | 0 | 3 ms | 34 ms | 5 ms
|
SearchItemsInCategory | 15 % | 750 | 0 | 0 ms | 83 ms | 10 ms
|
BrowseRegions | 2 % | 101 | 0 | 3 ms | 27 ms | 5 ms
|
BrowseCategoriesInRegion | 2 % | 107 | 0 | 3 ms | 31 ms | 5 ms
|
SearchItemsInRegion | 4 % | 241 | 0 | 0 ms | 57 ms | 13 ms
|
ViewItem | 14 % | 701 | 0 | 3 ms | 50 ms | 10 ms
|
ViewUserInfo | 3 % | 169 | 0 | 3 ms | 34 ms | 8 ms
|
ViewBidHistory | 1 % | 75 | 0 | 3 ms | 75 ms | 23 ms
|
BuyNowAuth | 1 % | 61 | 0 | 2 ms | 17 ms | 3 ms
|
BuyNow | 1 % | 62 | 20 | 4 ms | 34 ms | 10 ms
|
StoreBuyBow | 0 % | 46 | 0 | 4 ms | 21 ms | 8 ms
|
PutBidAuth | 4 % | 240 | 0 | 0 ms | 16 ms | 3 ms
|
PutBid | 5 % | 268 | 35 | 4 ms | 41 ms | 10 ms
|
StoreBid | 3 % | 171 | 1 | 4 ms | 74 ms | 9 ms
|
PutCommentAuth | 0 % | 0 | 0 | 0 ms | 0 ms | 0 ms
|
PutComment | 0 % | 18 | 2 | 4 ms | 16 ms | 6 ms
|
StoreComment | 0 % | 11 | 0 | 4 ms | 15 ms | 11 ms
|
Sell | 0 % | 28 | 0 | 0 ms | 4 ms | 1 ms
|
SelectCategoryToSellItem | 0 % | 37 | 0 | 4 ms | 18 ms | 6 ms
|
SellItemForm | 0 % | 30 | 0 | 2 ms | 13 ms | 3 ms
|
RegisterItem | 0 % | 25 | 0 | 4 ms | 16 ms | 7 ms
|
AboutMe (auth form) | 1 % | 92 | 0 | 0 ms | 9 ms | 0 ms
|
AboutMe | 2 % | 140 | 0 | 10 ms | 52 ms | 21 ms
|
Back probability | 10 % | 516 | 0 | 0 ms | 0 ms | 0 ms
|
End of Session | 1 % | 72 | 0 | 0 ms | 0 ms | 0 ms
|
Total | 100 % | 4911 | 58 | - | - | 7 ms
|
Average throughput | 165 req/s
| |||||
Completed sessions | 68
| |||||
Total time | 25785 seconds
| |||||
Average session time | 379 seconds
| |||||
| State name | % of total | Count | Errors | Minimum Time | Maximum Time | Average Time |
|---|---|---|---|---|---|---|
Home | 5 % | 10669 | 0 | 0 ms | 21029 ms | 808 ms
|
Register | 1 % | 2097 | 0 | 0 ms | 21018 ms | 202 ms
|
RegisterUser | 1 % | 2024 | 17 | 4 ms | 21010 ms | 133 ms
|
Browse | 7 % | 14414 | 0 | 0 ms | 21007 ms | 178 ms
|
BrowseCategories | 5 % | 9840 | 0 | 3 ms | 21011 ms | 119 ms
|
SearchItemsInCategory | 15 % | 29058 | 0 | 0 ms | 21047 ms | 83 ms
|
BrowseRegions | 2 % | 4224 | 0 | 3 ms | 21024 ms | 114 ms
|
BrowseCategoriesInRegion | 2 % | 4129 | 0 | 3 ms | 21013 ms | 101 ms
|
SearchItemsInRegion | 5 % | 9531 | 0 | 0 ms | 21106 ms | 77 ms
|
ViewItem | 14 % | 26313 | 0 | 3 ms | 21032 ms | 77 ms
|
ViewUserInfo | 2 % | 5540 | 0 | 3 ms | 21025 ms | 57 ms
|
ViewBidHistory | 1 % | 3000 | 0 | 3 ms | 9070 ms | 56 ms
|
BuyNowAuth | 1 % | 2392 | 0 | 2 ms | 20994 ms | 60 ms
|
BuyNow | 1 % | 2325 | 350 | 4 ms | 9031 ms | 48 ms
|
StoreBuyBow | 1 % | 1911 | 1 | 4 ms | 9006 ms | 40 ms
|
PutBidAuth | 4 % | 8898 | 0 | 0 ms | 21001 ms | 55 ms
|
PutBid | 5 % | 9846 | 1312 | 4 ms | 21038 ms | 63 ms
|
StoreBid | 3 % | 6188 | 3 | 4 ms | 21014 ms | 67 ms
|
PutCommentAuth | 0 % | 0 | 0 | 0 ms | 0 ms | 0 ms
|
PutComment | 0 % | 854 | 75 | 4 ms | 9364 ms | 59 ms
|
StoreComment | 0 % | 748 | 0 | 4 ms | 9060 ms | 80 ms
|
Sell | 0 % | 1049 | 0 | 0 ms | 10056 ms | 112 ms
|
SelectCategoryToSellItem | 0 % | 1022 | 0 | 4 ms | 9994 ms | 86 ms
|
SellItemForm | 0 % | 984 | 0 | 2 ms | 9011 ms | 61 ms
|
RegisterItem | 0 % | 953 | 0 | 4 ms | 21008 ms | 155 ms
|
AboutMe (auth form) | 1 % | 3314 | 0 | 0 ms | 21005 ms | 198 ms
|
AboutMe | 2 % | 5400 | 0 | 4 ms | 21084 ms | 153 ms
|
Back probability | 9 % | 18200 | 0 | 0 ms | 0 ms | 0 ms
|
End of Session | 1 % | 2445 | 0 | 0 ms | 0 ms | 0 ms
|
Total | 100 % | 187368 | 1758 | - | - | 124 ms
|
Average throughput | 315 req/s
| |||||
Completed sessions | 2445
| |||||
Total time | 570147 seconds
| |||||
Average session time | 233 seconds
| |||||
An error occured while waiting for remote processes termination (Skipping waits)
Command is: /usr/bin/scp farm6.csail.mit.edu:/tmp/client1 /home/drkp/sandbox/txcache/src/RUBiS-1.4.3/bench/2009-3-19@16:58:34//client1.bin
Command is: /usr/bin/ssh -x localhost /bin/bash -c 'LANG=en_GB.UTF-8 /usr/bin/sar -n DEV -n SOCK -rubcw 1 605 -f /home/drkp/sandbox/txcache/src/RUBiS-1.4.3/bench/2009-3-19@16:58:34//client1.bin > /home/drkp/sandbox/txcache/src/RUBiS-1.4.3/bench/2009-3-19@16:58:34//client1'
Command is: /usr/bin/scp farm14:/tmp/db_server0 /home/drkp/sandbox/txcache/src/RUBiS-1.4.3/bench/2009-3-19@16:58:34//db_server0.bin
Command is: /usr/bin/ssh -x localhost /bin/bash -c 'LANG=en_GB.UTF-8 /usr/bin/sar -n DEV -n SOCK -rubcw 1 605 -f /home/drkp/sandbox/txcache/src/RUBiS-1.4.3/bench/2009-3-19@16:58:34//db_server0.bin > /home/drkp/sandbox/txcache/src/RUBiS-1.4.3/bench/2009-3-19@16:58:34//db_server0'
Command is: /usr/bin/scp farm12.csail.mit.edu:/tmp/web_server0 /home/drkp/sandbox/txcache/src/RUBiS-1.4.3/bench/2009-3-19@16:58:34//web_server0.bin
Command is: /usr/bin/ssh -x localhost /bin/bash -c 'LANG=en_GB.UTF-8 /usr/bin/sar -n DEV -n SOCK -rubcw 1 605 -f /home/drkp/sandbox/txcache/src/RUBiS-1.4.3/bench/2009-3-19@16:58:34//web_server0.bin > /home/drkp/sandbox/txcache/src/RUBiS-1.4.3/bench/2009-3-19@16:58:34//web_server0'
Command is: /usr/bin/scp farm13.csail.mit.edu:/tmp/web_server1 /home/drkp/sandbox/txcache/src/RUBiS-1.4.3/bench/2009-3-19@16:58:34//web_server1.bin
Command is: /usr/bin/ssh -x localhost /bin/bash -c 'LANG=en_GB.UTF-8 /usr/bin/sar -n DEV -n SOCK -rubcw 1 605 -f /home/drkp/sandbox/txcache/src/RUBiS-1.4.3/bench/2009-3-19@16:58:34//web_server1.bin > /home/drkp/sandbox/txcache/src/RUBiS-1.4.3/bench/2009-3-19@16:58:34//web_server1'
Command is: /usr/bin/scp localhost:/tmp/client0 /home/drkp/sandbox/txcache/src/RUBiS-1.4.3/bench/2009-3-19@16:58:34//client0.bin
Command is: /usr/bin/ssh -x localhost /bin/bash -c 'LANG=en_GB.UTF-8 /usr/bin/sar -n DEV -n SOCK -rubcw 1 605 -f /home/drkp/sandbox/txcache/src/RUBiS-1.4.3/bench/2009-3-19@16:58:34//client0.bin > /home/drkp/sandbox/txcache/src/RUBiS-1.4.3/bench/2009-3-19@16:58:34//client0'
Command is: /usr/bin/scp farm6.csail.mit.edu:/tmp/trace_client1.html /home/drkp/sandbox/txcache/src/RUBiS-1.4.3/bench/2009-3-19@16:58:34//
Command is: /usr/bin/scp farm6.csail.mit.edu:/tmp/stat_client1.html /home/drkp/sandbox/txcache/src/RUBiS-1.4.3/bench/2009-3-19@16:58:34//
|
|
|
|
|
|
 | 
|
 | 
|
 | 
|
 | 
|
 | 
|
 | 
|
 | 
|
 | 
|
 | 
|