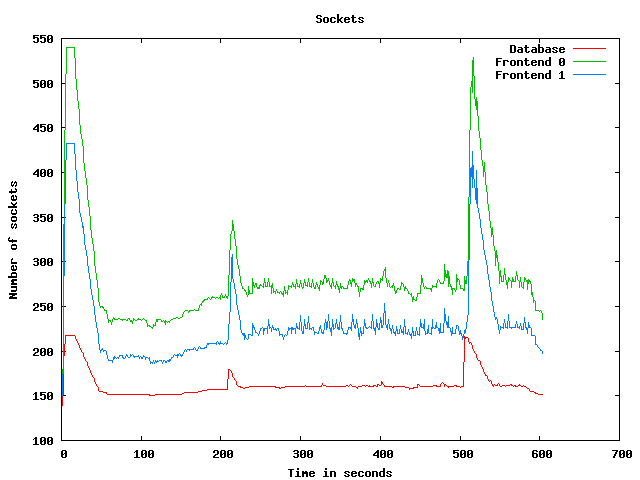
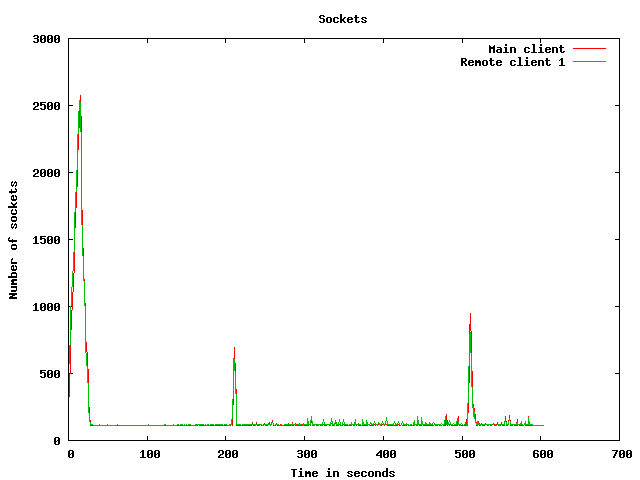
Node information
Test timing information
Up ramp statistics
Runtime session statistics
Down ramp statistics
Overall statistics
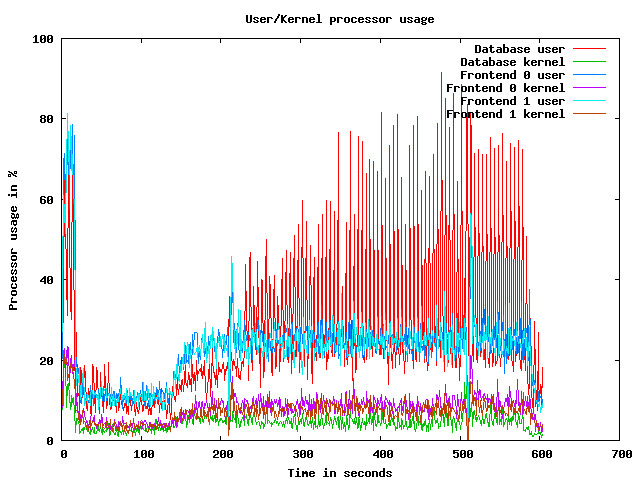
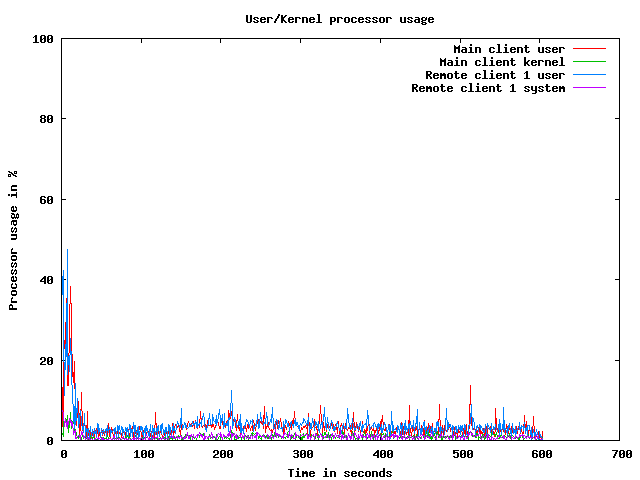
CPU usage graphs
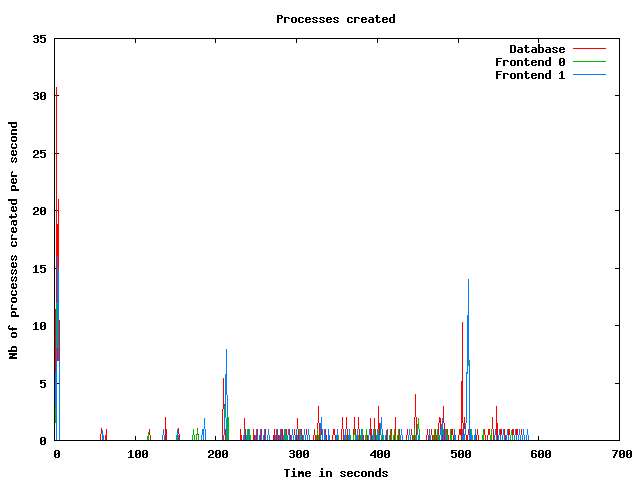
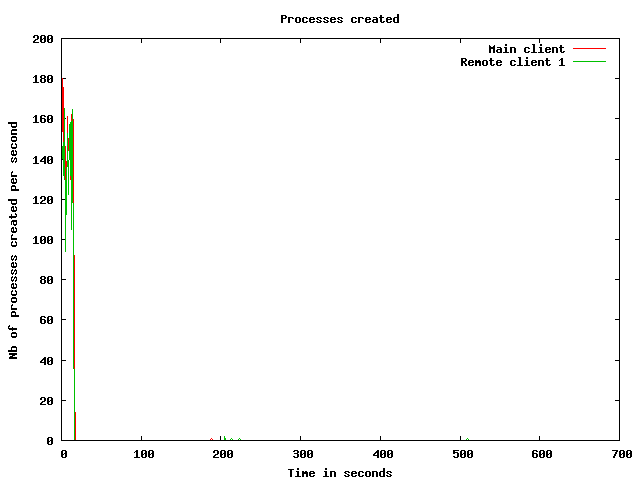
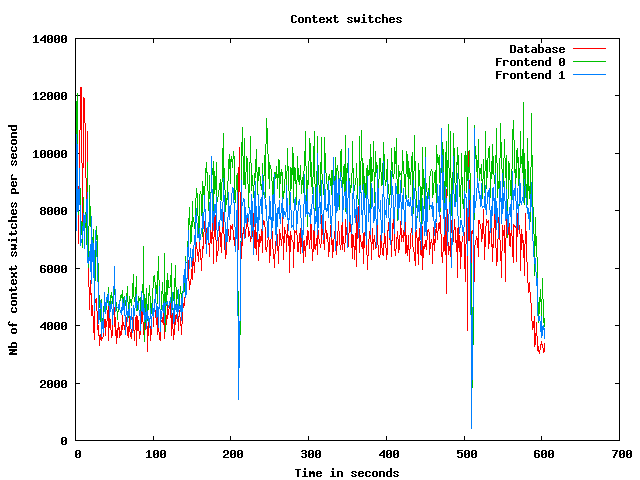
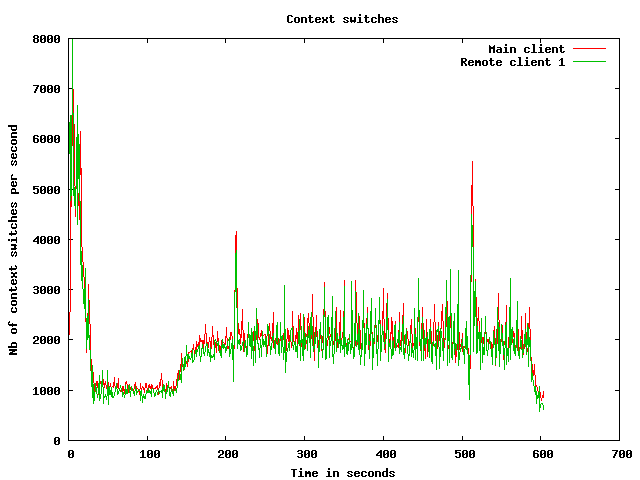
Processes usage graphs
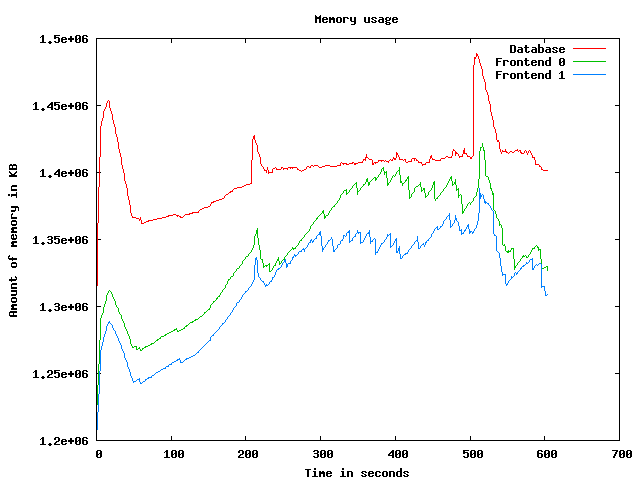
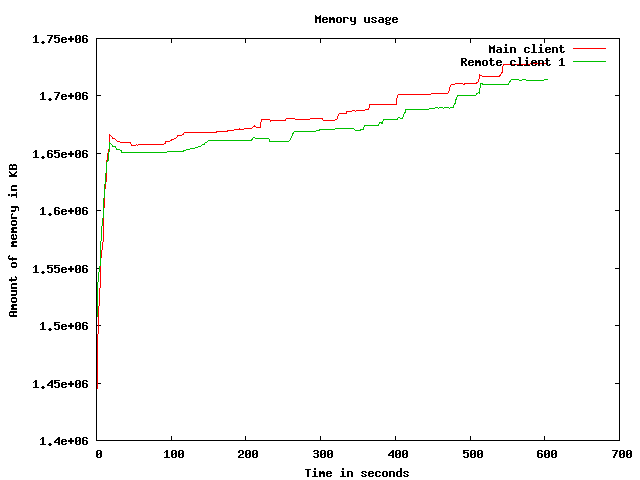
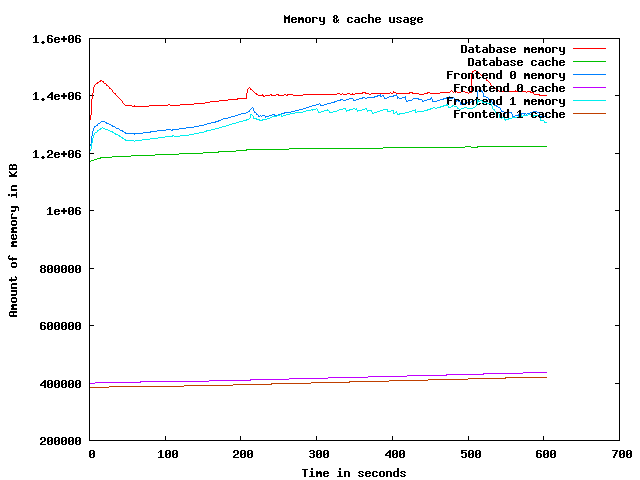
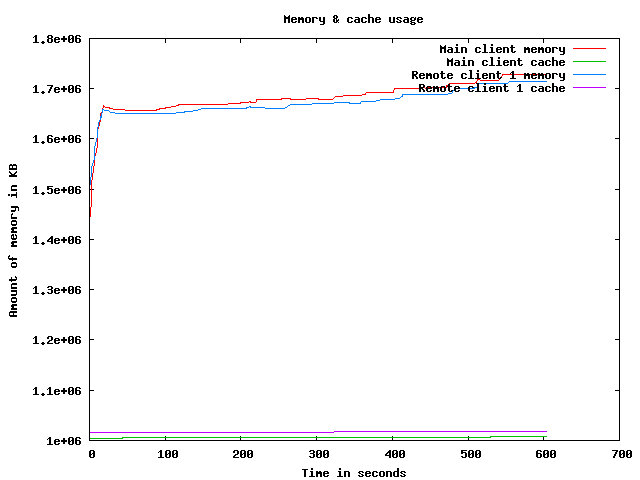
Memory usage graph
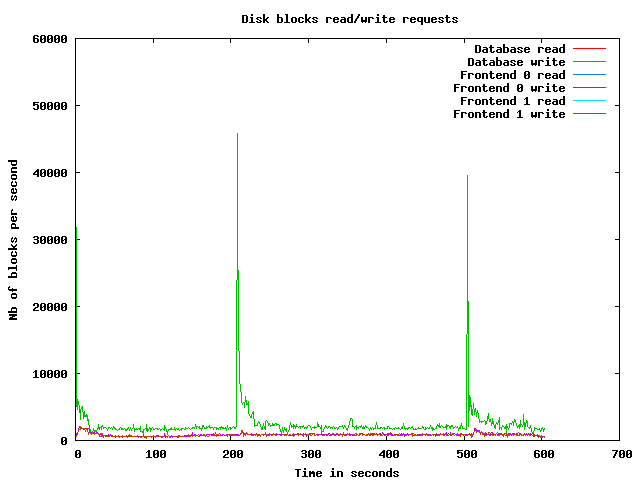
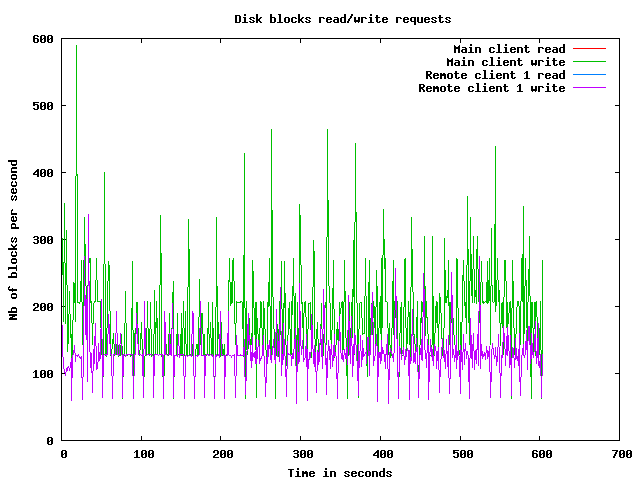
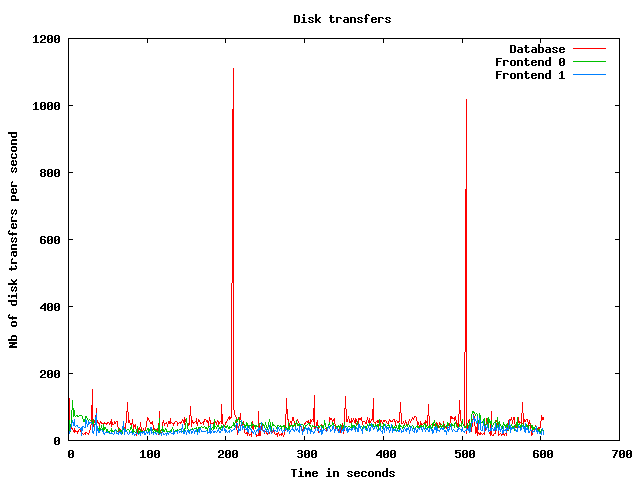
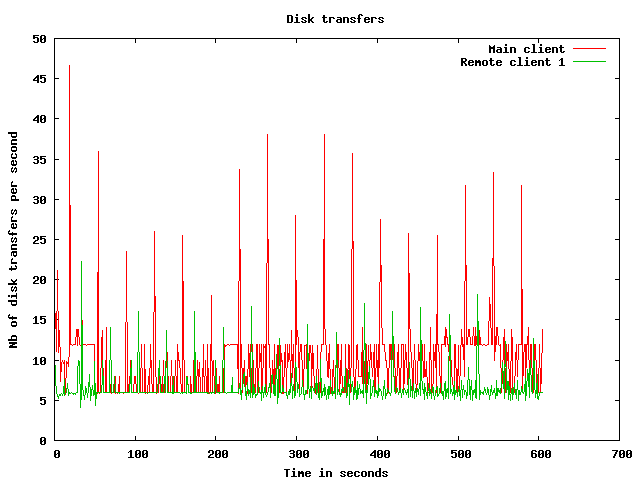
Disk usage graphs
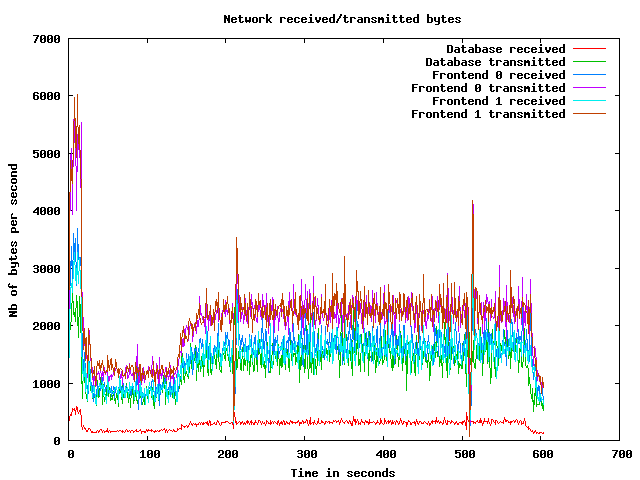
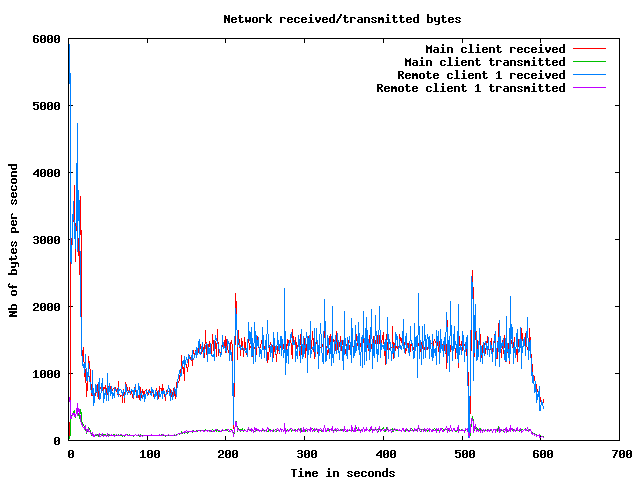
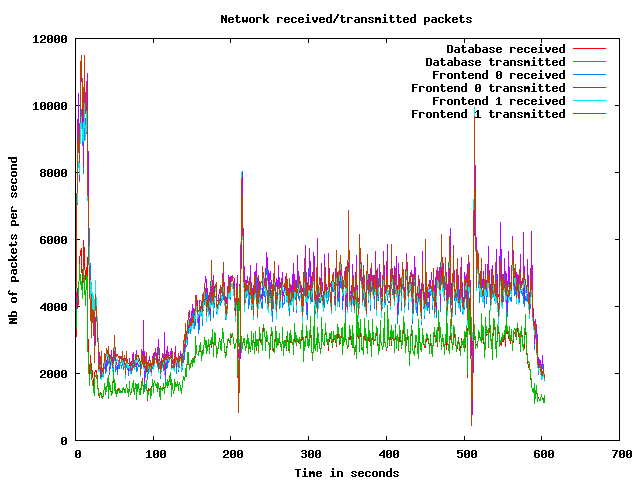
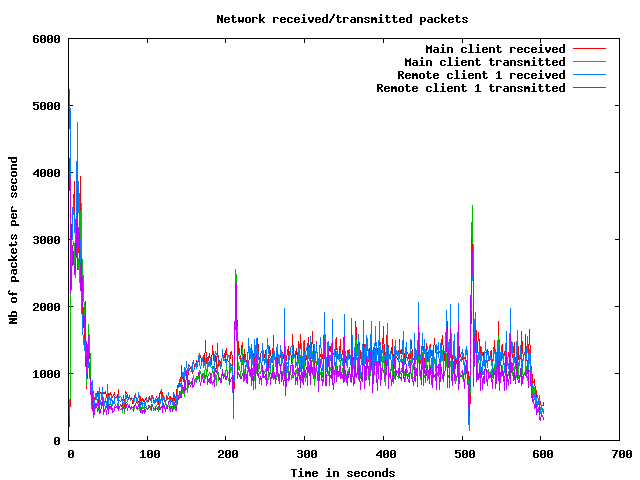
Network usage graphs
| Test start | 2009-3-19 17:11:15 |
| Up ramp start | 2009-3-19 17:11:33 |
| Runtime session start | 2009-3-19 17:13:33 |
| Down ramp start | 2009-3-19 17:21:3 |
| Test end | 2009-3-19 17:23:28 |
| Up ramp length | 2 minutes 1 millisecond (requested 120000 ms) |
| Runtime session length | 7 minutes 30 seconds 0 millisecond (requested 450000 ms) |
| Down ramp length | 30 seconds 0 millisecond (requested 30000 ms) |
| Total test length | 12 minutes 12 seconds 878 milliseconds |
| State name | % of total | Count | Errors | Minimum Time | Maximum Time | Average Time |
|---|---|---|---|---|---|---|
Home | 9 % | 4074 | 0 | 0 ms | 21236 ms | 2785 ms
|
Register | 1 % | 578 | 0 | 0 ms | 21222 ms | 724 ms
|
RegisterUser | 1 % | 538 | 3 | 5 ms | 21022 ms | 1058 ms
|
Browse | 9 % | 4094 | 0 | 0 ms | 21205 ms | 917 ms
|
BrowseCategories | 6 % | 2708 | 0 | 3 ms | 21103 ms | 599 ms
|
SearchItemsInCategory | 15 % | 6367 | 0 | 0 ms | 21236 ms | 552 ms
|
BrowseRegions | 2 % | 1131 | 0 | 3 ms | 21166 ms | 764 ms
|
BrowseCategoriesInRegion | 2 % | 1066 | 0 | 3 ms | 21154 ms | 638 ms
|
SearchItemsInRegion | 4 % | 2081 | 0 | 0 ms | 21171 ms | 460 ms
|
ViewItem | 12 % | 5342 | 0 | 3 ms | 21270 ms | 513 ms
|
ViewUserInfo | 2 % | 1059 | 0 | 3 ms | 21050 ms | 361 ms
|
ViewBidHistory | 1 % | 483 | 0 | 3 ms | 21044 ms | 388 ms
|
BuyNowAuth | 1 % | 436 | 0 | 2 ms | 21001 ms | 334 ms
|
BuyNow | 0 % | 404 | 63 | 5 ms | 21014 ms | 351 ms
|
StoreBuyBow | 0 % | 303 | 0 | 4 ms | 21054 ms | 694 ms
|
PutBidAuth | 4 % | 1743 | 0 | 0 ms | 21010 ms | 405 ms
|
PutBid | 3 % | 1678 | 223 | 4 ms | 21027 ms | 369 ms
|
StoreBid | 2 % | 966 | 1 | 4 ms | 21018 ms | 361 ms
|
PutCommentAuth | 0 % | 0 | 0 | 0 ms | 0 ms | 0 ms
|
PutComment | 0 % | 141 | 11 | 4 ms | 9055 ms | 384 ms
|
StoreComment | 0 % | 119 | 0 | 4 ms | 21119 ms | 438 ms
|
Sell | 0 % | 328 | 0 | 0 ms | 21012 ms | 1127 ms
|
SelectCategoryToSellItem | 0 % | 308 | 0 | 4 ms | 21021 ms | 678 ms
|
SellItemForm | 0 % | 288 | 0 | 2 ms | 21002 ms | 736 ms
|
RegisterItem | 0 % | 275 | 0 | 4 ms | 21006 ms | 639 ms
|
AboutMe (auth form) | 2 % | 866 | 0 | 0 ms | 21239 ms | 958 ms
|
AboutMe | 2 % | 1221 | 0 | 4 ms | 21230 ms | 673 ms
|
Back probability | 7 % | 3357 | 0 | 0 ms | 0 ms | 0 ms
|
End of Session | 1 % | 458 | 0 | 0 ms | 0 ms | 0 ms
|
Total | 100 % | 42412 | 301 | - | - | 748 ms
|
Average throughput | 355 req/s
| |||||
Completed sessions | 411
| |||||
Total time | 22053 seconds
| |||||
Average session time | 53 seconds
| |||||
| State name | % of total | Count | Errors | Minimum Time | Maximum Time | Average Time |
|---|---|---|---|---|---|---|
Home | 4 % | 8917 | 0 | 0 ms | 9005 ms | 14 ms
|
Register | 1 % | 1965 | 0 | 0 ms | 3531 ms | 32 ms
|
RegisterUser | 1 % | 1919 | 31 | 5 ms | 3752 ms | 49 ms
|
Browse | 7 % | 13359 | 0 | 0 ms | 9006 ms | 39 ms
|
BrowseCategories | 5 % | 9367 | 0 | 3 ms | 9021 ms | 43 ms
|
SearchItemsInCategory | 15 % | 29081 | 0 | 0 ms | 9038 ms | 59 ms
|
BrowseRegions | 2 % | 3848 | 0 | 3 ms | 9002 ms | 40 ms
|
BrowseCategoriesInRegion | 2 % | 3768 | 0 | 3 ms | 9021 ms | 46 ms
|
SearchItemsInRegion | 4 % | 9004 | 0 | 0 ms | 9043 ms | 56 ms
|
ViewItem | 14 % | 26220 | 0 | 3 ms | 9043 ms | 51 ms
|
ViewUserInfo | 3 % | 5716 | 0 | 3 ms | 9033 ms | 55 ms
|
ViewBidHistory | 1 % | 3125 | 0 | 3 ms | 9044 ms | 71 ms
|
BuyNowAuth | 1 % | 2443 | 0 | 2 ms | 9002 ms | 47 ms
|
BuyNow | 1 % | 2398 | 365 | 4 ms | 3591 ms | 56 ms
|
StoreBuyBow | 1 % | 2007 | 1 | 4 ms | 3771 ms | 64 ms
|
PutBidAuth | 4 % | 9154 | 0 | 0 ms | 9015 ms | 40 ms
|
PutBid | 5 % | 10386 | 1357 | 0 ms | 9027 ms | 49 ms
|
StoreBid | 3 % | 6730 | 1 | 4 ms | 9008 ms | 48 ms
|
PutCommentAuth | 0 % | 0 | 0 | 0 ms | 0 ms | 0 ms
|
PutComment | 0 % | 845 | 79 | 4 ms | 3569 ms | 43 ms
|
StoreComment | 0 % | 753 | 0 | 4 ms | 3743 ms | 51 ms
|
Sell | 0 % | 1082 | 0 | 0 ms | 8994 ms | 53 ms
|
SelectCategoryToSellItem | 0 % | 1066 | 0 | 4 ms | 3503 ms | 39 ms
|
SellItemForm | 0 % | 1046 | 0 | 2 ms | 3607 ms | 30 ms
|
RegisterItem | 0 % | 1028 | 0 | 4 ms | 9019 ms | 57 ms
|
AboutMe (auth form) | 1 % | 3153 | 0 | 0 ms | 9005 ms | 41 ms
|
AboutMe | 2 % | 5272 | 0 | 4 ms | 9083 ms | 78 ms
|
Back probability | 10 % | 18776 | 0 | 0 ms | 0 ms | 0 ms
|
End of Session | 1 % | 2626 | 0 | 0 ms | 0 ms | 0 ms
|
Total | 100 % | 185054 | 1834 | - | - | 43 ms
|
Average throughput | 415 req/s
| |||||
Completed sessions | 2636
| |||||
Total time | 666687 seconds
| |||||
Average session time | 252 seconds
| |||||
| State name | % of total | Count | Errors | Minimum Time | Maximum Time | Average Time |
|---|---|---|---|---|---|---|
Home | 4 % | 289 | 0 | 0 ms | 6 ms | 0 ms
|
Register | 1 % | 71 | 0 | 0 ms | 2 ms | 0 ms
|
RegisterUser | 0 % | 45 | 0 | 5 ms | 34 ms | 14 ms
|
Browse | 7 % | 460 | 0 | 0 ms | 39 ms | 0 ms
|
BrowseCategories | 4 % | 309 | 0 | 3 ms | 32 ms | 5 ms
|
SearchItemsInCategory | 15 % | 950 | 0 | 0 ms | 209 ms | 12 ms
|
BrowseRegions | 2 % | 126 | 0 | 3 ms | 38 ms | 6 ms
|
BrowseCategoriesInRegion | 2 % | 130 | 0 | 3 ms | 38 ms | 6 ms
|
SearchItemsInRegion | 4 % | 304 | 0 | 0 ms | 109 ms | 14 ms
|
ViewItem | 14 % | 881 | 0 | 3 ms | 95 ms | 12 ms
|
ViewUserInfo | 3 % | 212 | 0 | 4 ms | 83 ms | 9 ms
|
ViewBidHistory | 1 % | 92 | 0 | 3 ms | 286 ms | 32 ms
|
BuyNowAuth | 1 % | 86 | 0 | 2 ms | 8 ms | 3 ms
|
BuyNow | 1 % | 94 | 12 | 4 ms | 29 ms | 8 ms
|
StoreBuyBow | 1 % | 63 | 0 | 4 ms | 39 ms | 8 ms
|
PutBidAuth | 5 % | 323 | 0 | 0 ms | 36 ms | 3 ms
|
PutBid | 5 % | 363 | 50 | 4 ms | 50 ms | 10 ms
|
StoreBid | 3 % | 213 | 0 | 5 ms | 52 ms | 10 ms
|
PutCommentAuth | 0 % | 0 | 0 | 0 ms | 0 ms | 0 ms
|
PutComment | 0 % | 30 | 3 | 6 ms | 38 ms | 10 ms
|
StoreComment | 0 % | 25 | 0 | 4 ms | 19 ms | 8 ms
|
Sell | 0 % | 35 | 0 | 0 ms | 4 ms | 0 ms
|
SelectCategoryToSellItem | 0 % | 27 | 0 | 4 ms | 26 ms | 9 ms
|
SellItemForm | 0 % | 29 | 0 | 2 ms | 20 ms | 3 ms
|
RegisterItem | 0 % | 26 | 0 | 4 ms | 17 ms | 10 ms
|
AboutMe (auth form) | 1 % | 96 | 0 | 0 ms | 25 ms | 1 ms
|
AboutMe | 3 % | 191 | 0 | 9 ms | 377 ms | 31 ms
|
Back probability | 10 % | 647 | 0 | 0 ms | 0 ms | 0 ms
|
End of Session | 1 % | 90 | 0 | 0 ms | 0 ms | 0 ms
|
Total | 100 % | 6207 | 65 | - | - | 8 ms
|
Average throughput | 209 req/s
| |||||
Completed sessions | 85
| |||||
Total time | 27324 seconds
| |||||
Average session time | 321 seconds
| |||||
| State name | % of total | Count | Errors | Minimum Time | Maximum Time | Average Time |
|---|---|---|---|---|---|---|
Home | 5 % | 13280 | 0 | 0 ms | 21236 ms | 864 ms
|
Register | 1 % | 2614 | 0 | 0 ms | 21222 ms | 184 ms
|
RegisterUser | 1 % | 2502 | 34 | 5 ms | 21022 ms | 265 ms
|
Browse | 7 % | 17913 | 0 | 0 ms | 21205 ms | 239 ms
|
BrowseCategories | 5 % | 12384 | 0 | 3 ms | 21103 ms | 163 ms
|
SearchItemsInCategory | 15 % | 36521 | 0 | 0 ms | 21236 ms | 144 ms
|
BrowseRegions | 2 % | 5105 | 0 | 3 ms | 21166 ms | 199 ms
|
BrowseCategoriesInRegion | 2 % | 4964 | 0 | 3 ms | 21154 ms | 172 ms
|
SearchItemsInRegion | 4 % | 11416 | 0 | 0 ms | 21171 ms | 129 ms
|
ViewItem | 13 % | 32518 | 0 | 3 ms | 21270 ms | 126 ms
|
ViewUserInfo | 2 % | 7001 | 0 | 3 ms | 21050 ms | 100 ms
|
ViewBidHistory | 1 % | 3709 | 0 | 3 ms | 21044 ms | 112 ms
|
BuyNowAuth | 1 % | 2965 | 0 | 2 ms | 21001 ms | 88 ms
|
BuyNow | 1 % | 2896 | 440 | 4 ms | 21014 ms | 96 ms
|
StoreBuyBow | 1 % | 2373 | 1 | 4 ms | 21054 ms | 143 ms
|
PutBidAuth | 4 % | 11220 | 0 | 0 ms | 21010 ms | 96 ms
|
PutBid | 5 % | 12452 | 1630 | 0 ms | 21027 ms | 91 ms
|
StoreBid | 3 % | 7909 | 2 | 4 ms | 21018 ms | 85 ms
|
PutCommentAuth | 0 % | 0 | 0 | 0 ms | 0 ms | 0 ms
|
PutComment | 0 % | 1016 | 93 | 4 ms | 9055 ms | 89 ms
|
StoreComment | 0 % | 897 | 0 | 4 ms | 21119 ms | 101 ms
|
Sell | 0 % | 1445 | 0 | 0 ms | 21012 ms | 295 ms
|
SelectCategoryToSellItem | 0 % | 1401 | 0 | 4 ms | 21021 ms | 179 ms
|
SellItemForm | 0 % | 1363 | 0 | 2 ms | 21002 ms | 178 ms
|
RegisterItem | 0 % | 1329 | 0 | 4 ms | 21006 ms | 176 ms
|
AboutMe (auth form) | 1 % | 4115 | 0 | 0 ms | 21239 ms | 233 ms
|
AboutMe | 2 % | 6731 | 0 | 4 ms | 21230 ms | 184 ms
|
Back probability | 9 % | 22780 | 0 | 0 ms | 0 ms | 0 ms
|
End of Session | 1 % | 3174 | 0 | 0 ms | 0 ms | 0 ms
|
Total | 100 % | 233993 | 2200 | - | - | 169 ms
|
Average throughput | 393 req/s
| |||||
Completed sessions | 3174
| |||||
Total time | 732089 seconds
| |||||
Average session time | 230 seconds
| |||||
An error occured while waiting for remote processes termination (Skipping waits)
Command is: /usr/bin/scp farm6.csail.mit.edu:/tmp/client1 /home/drkp/sandbox/txcache/src/RUBiS-1.4.3/bench/2009-3-19@17:11:15//client1.bin
Command is: /usr/bin/ssh -x localhost /bin/bash -c 'LANG=en_GB.UTF-8 /usr/bin/sar -n DEV -n SOCK -rubcw 1 605 -f /home/drkp/sandbox/txcache/src/RUBiS-1.4.3/bench/2009-3-19@17:11:15//client1.bin > /home/drkp/sandbox/txcache/src/RUBiS-1.4.3/bench/2009-3-19@17:11:15//client1'
Command is: /usr/bin/scp farm14:/tmp/db_server0 /home/drkp/sandbox/txcache/src/RUBiS-1.4.3/bench/2009-3-19@17:11:15//db_server0.bin
Command is: /usr/bin/ssh -x localhost /bin/bash -c 'LANG=en_GB.UTF-8 /usr/bin/sar -n DEV -n SOCK -rubcw 1 605 -f /home/drkp/sandbox/txcache/src/RUBiS-1.4.3/bench/2009-3-19@17:11:15//db_server0.bin > /home/drkp/sandbox/txcache/src/RUBiS-1.4.3/bench/2009-3-19@17:11:15//db_server0'
Command is: /usr/bin/scp farm12.csail.mit.edu:/tmp/web_server0 /home/drkp/sandbox/txcache/src/RUBiS-1.4.3/bench/2009-3-19@17:11:15//web_server0.bin
Command is: /usr/bin/ssh -x localhost /bin/bash -c 'LANG=en_GB.UTF-8 /usr/bin/sar -n DEV -n SOCK -rubcw 1 605 -f /home/drkp/sandbox/txcache/src/RUBiS-1.4.3/bench/2009-3-19@17:11:15//web_server0.bin > /home/drkp/sandbox/txcache/src/RUBiS-1.4.3/bench/2009-3-19@17:11:15//web_server0'
Command is: /usr/bin/scp farm13.csail.mit.edu:/tmp/web_server1 /home/drkp/sandbox/txcache/src/RUBiS-1.4.3/bench/2009-3-19@17:11:15//web_server1.bin
Command is: /usr/bin/ssh -x localhost /bin/bash -c 'LANG=en_GB.UTF-8 /usr/bin/sar -n DEV -n SOCK -rubcw 1 605 -f /home/drkp/sandbox/txcache/src/RUBiS-1.4.3/bench/2009-3-19@17:11:15//web_server1.bin > /home/drkp/sandbox/txcache/src/RUBiS-1.4.3/bench/2009-3-19@17:11:15//web_server1'
Command is: /usr/bin/scp localhost:/tmp/client0 /home/drkp/sandbox/txcache/src/RUBiS-1.4.3/bench/2009-3-19@17:11:15//client0.bin
Command is: /usr/bin/ssh -x localhost /bin/bash -c 'LANG=en_GB.UTF-8 /usr/bin/sar -n DEV -n SOCK -rubcw 1 605 -f /home/drkp/sandbox/txcache/src/RUBiS-1.4.3/bench/2009-3-19@17:11:15//client0.bin > /home/drkp/sandbox/txcache/src/RUBiS-1.4.3/bench/2009-3-19@17:11:15//client0'
Command is: /usr/bin/scp farm6.csail.mit.edu:/tmp/trace_client1.html /home/drkp/sandbox/txcache/src/RUBiS-1.4.3/bench/2009-3-19@17:11:15//
Command is: /usr/bin/scp farm6.csail.mit.edu:/tmp/stat_client1.html /home/drkp/sandbox/txcache/src/RUBiS-1.4.3/bench/2009-3-19@17:11:15//
|
|
|
|
|
|
 | 
|
 | 
|
 | 
|
 | 
|
 | 
|
 | 
|
 | 
|
 | 
|
 | 
|