
Node information
Test timing information
Up ramp statistics
Runtime session statistics
Down ramp statistics
Overall statistics
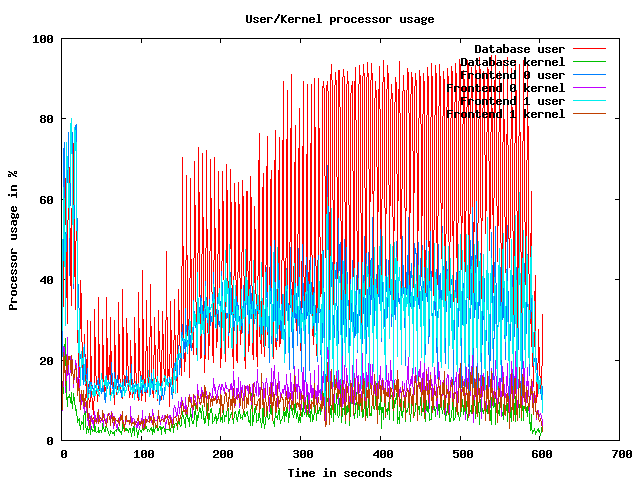
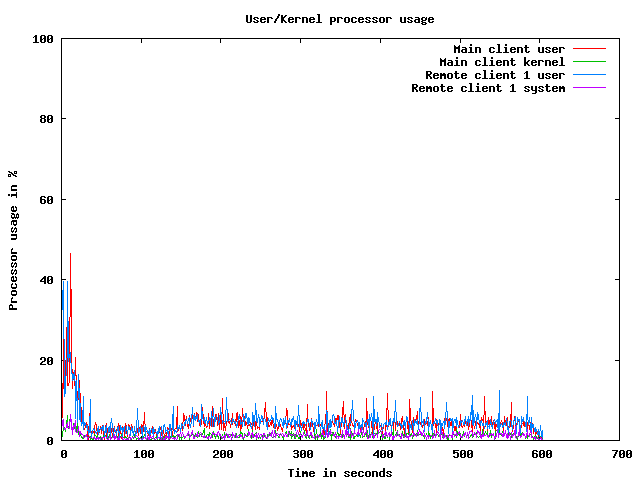
CPU usage graphs
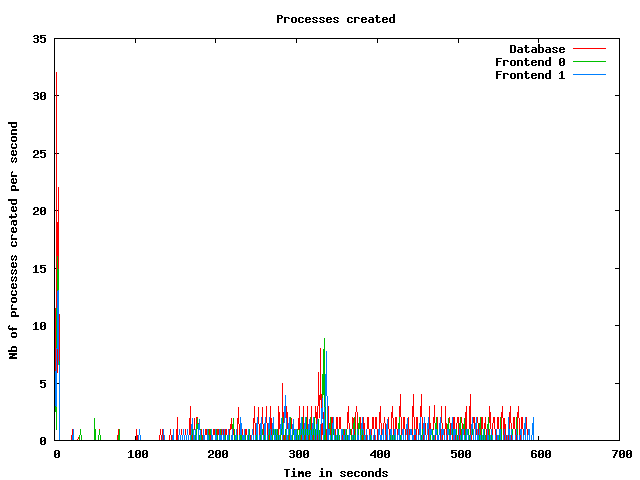
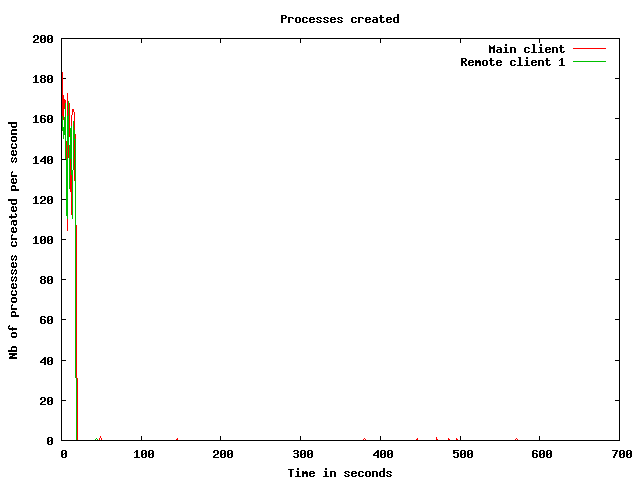
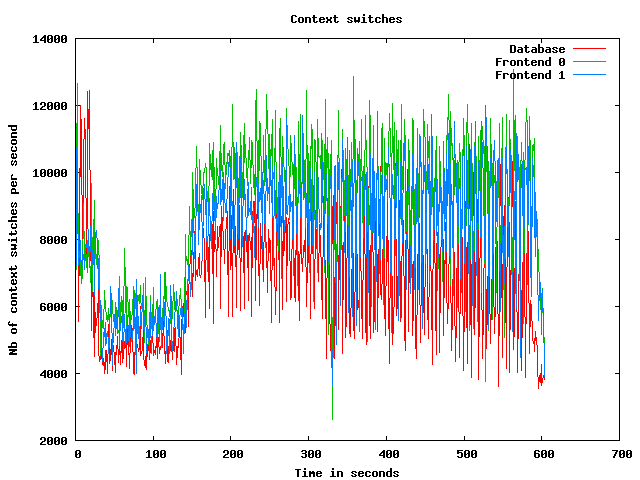
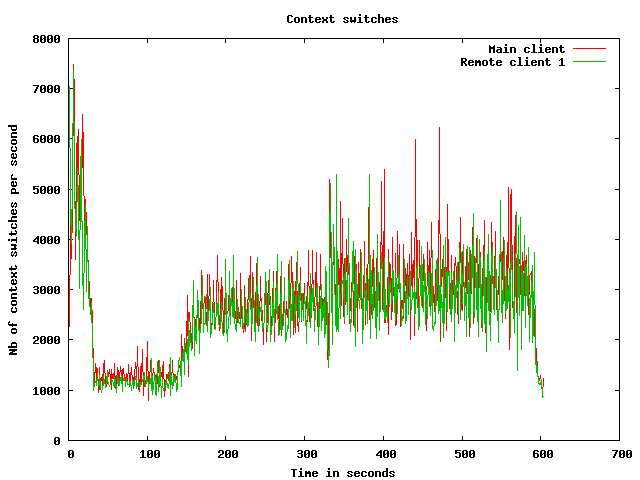
Processes usage graphs
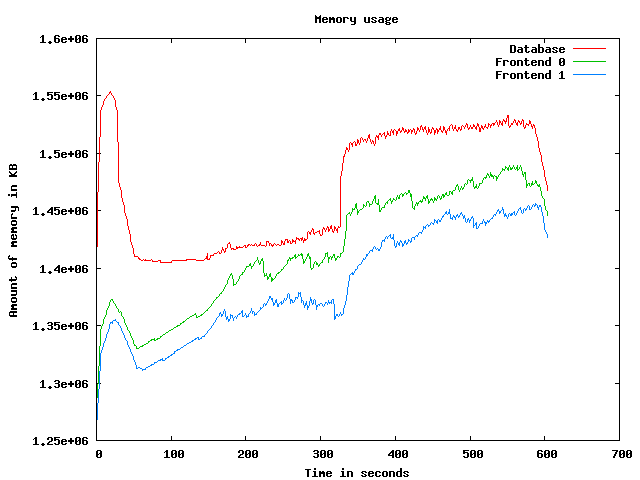
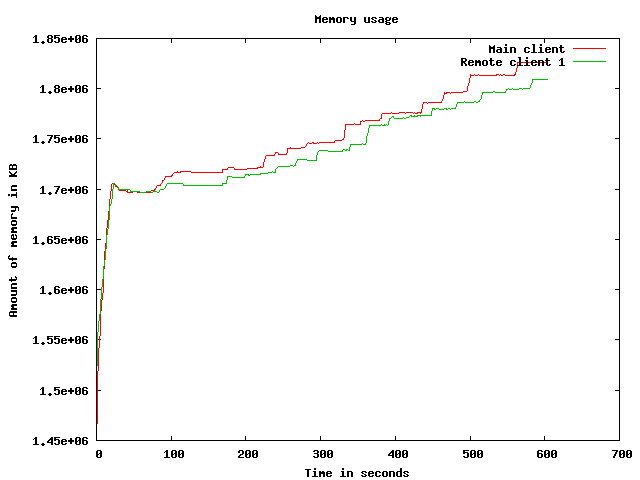
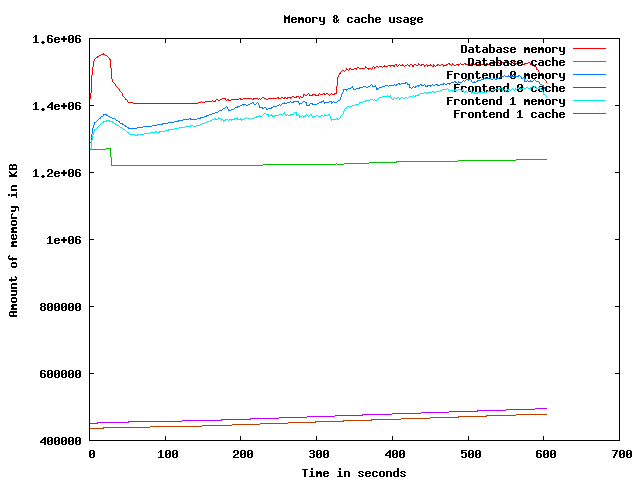
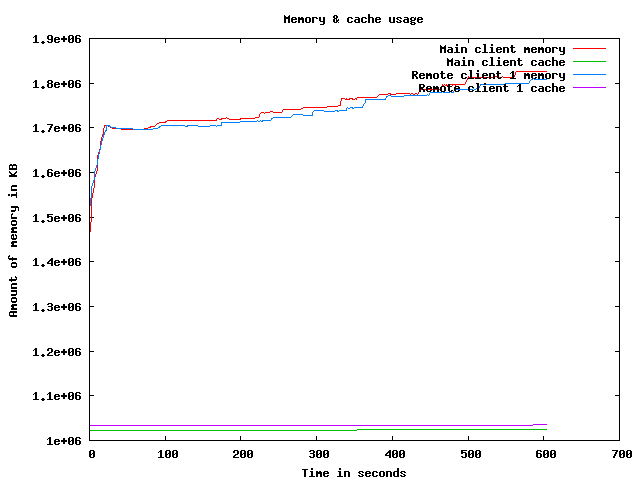
Memory usage graph
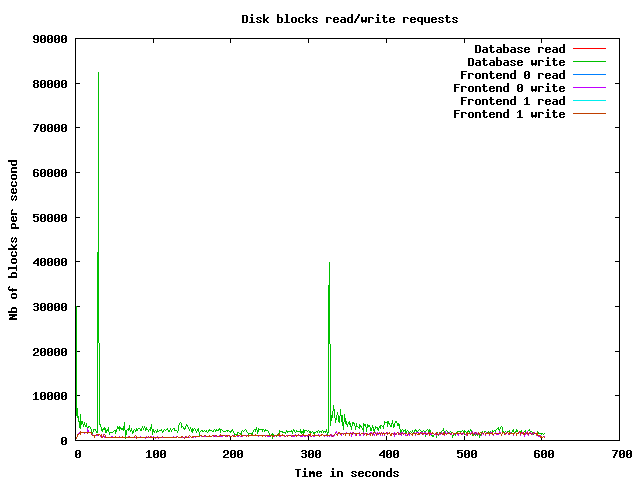
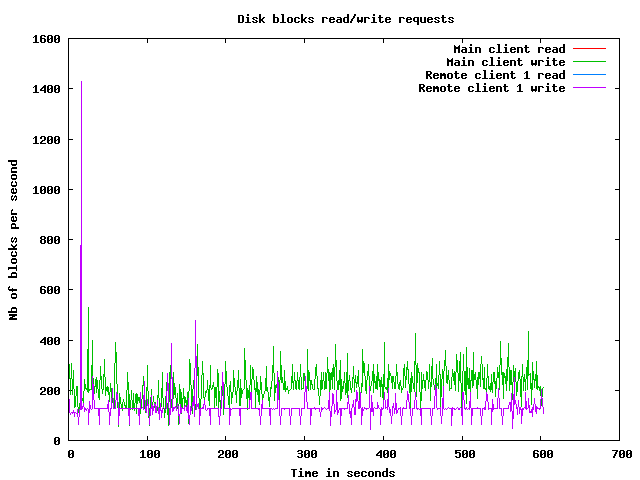
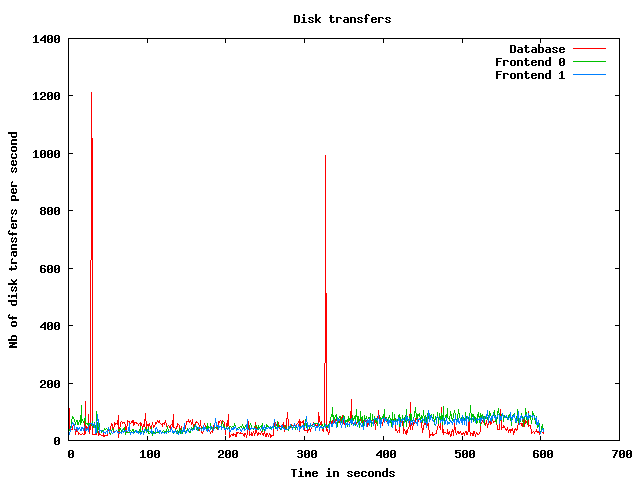
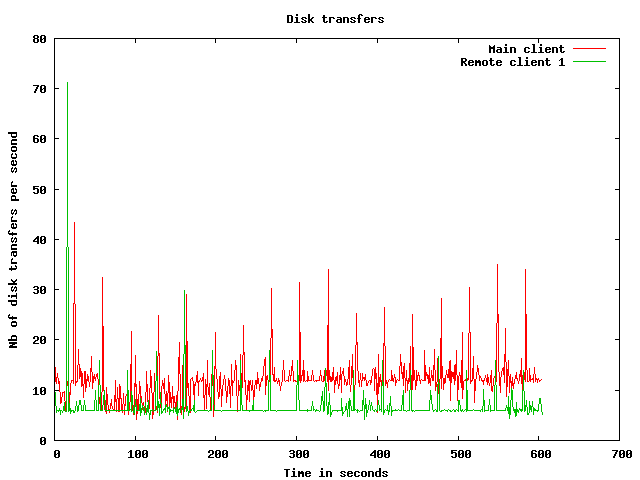
Disk usage graphs
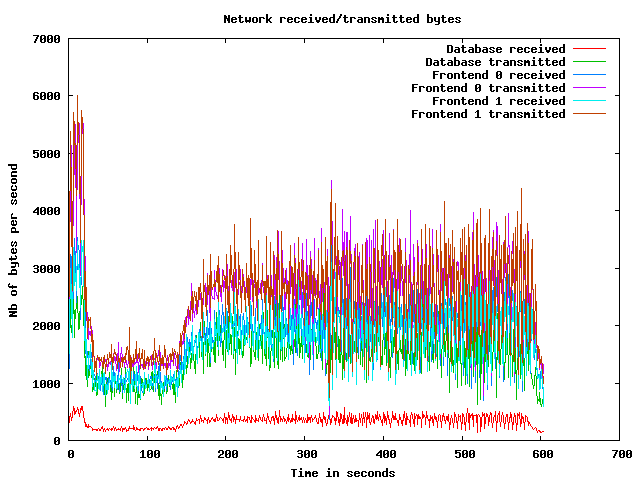
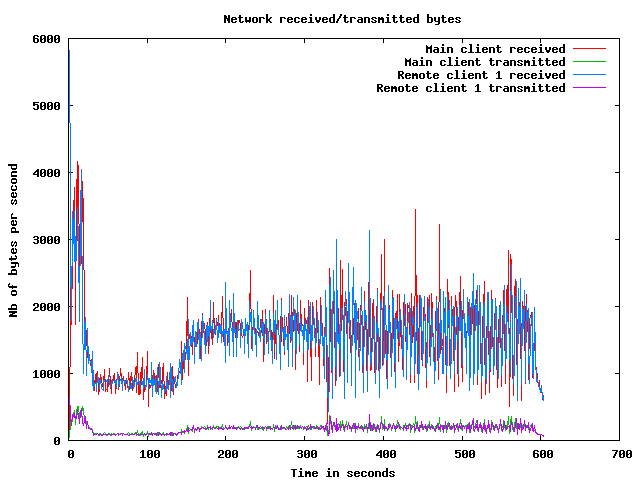
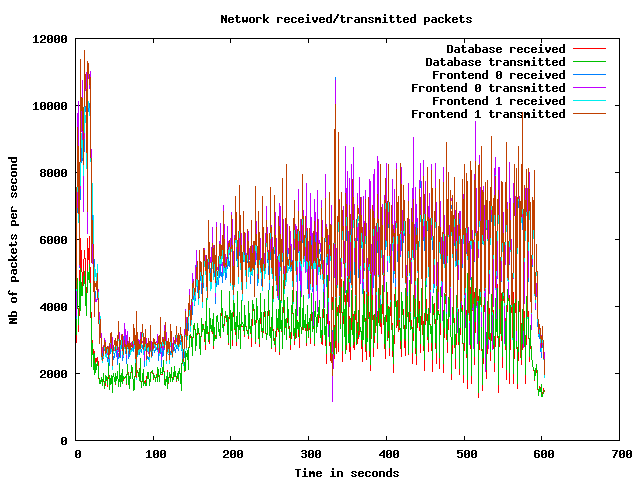
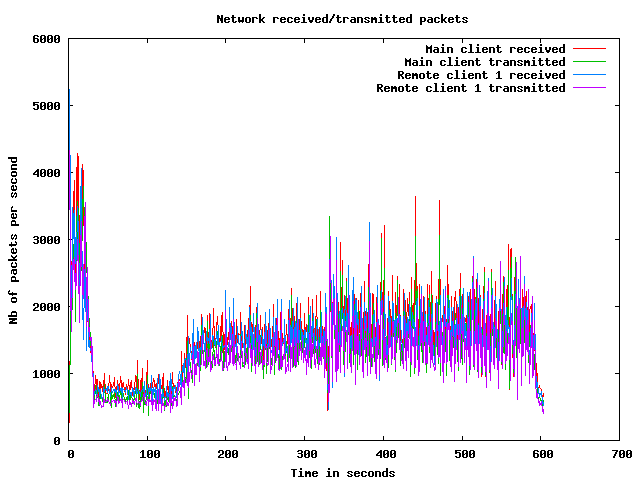
Network usage graphs
| Test start | 2009-3-19 17:24:14 |
| Up ramp start | 2009-3-19 17:24:35 |
| Runtime session start | 2009-3-19 17:26:35 |
| Down ramp start | 2009-3-19 17:34:5 |
| Test end | 2009-3-19 17:36:28 |
| Up ramp length | 2 minutes 0 millisecond (requested 120000 ms) |
| Runtime session length | 7 minutes 30 seconds 0 millisecond (requested 450000 ms) |
| Down ramp length | 30 seconds 1 millisecond (requested 30000 ms) |
| Total test length | 12 minutes 13 seconds 912 milliseconds |
| State name | % of total | Count | Errors | Minimum Time | Maximum Time | Average Time |
|---|---|---|---|---|---|---|
Home | 9 % | 5022 | 0 | 0 ms | 45000 ms | 2725 ms
|
Register | 1 % | 658 | 0 | 0 ms | 22896 ms | 1065 ms
|
RegisterUser | 1 % | 612 | 4 | 5 ms | 45000 ms | 945 ms
|
Browse | 9 % | 4954 | 0 | 0 ms | 45000 ms | 1064 ms
|
BrowseCategories | 6 % | 3309 | 0 | 3 ms | 45007 ms | 783 ms
|
SearchItemsInCategory | 14 % | 7593 | 0 | 0 ms | 45068 ms | 622 ms
|
BrowseRegions | 2 % | 1356 | 0 | 3 ms | 45001 ms | 831 ms
|
BrowseCategoriesInRegion | 2 % | 1268 | 0 | 3 ms | 21732 ms | 683 ms
|
SearchItemsInRegion | 4 % | 2549 | 0 | 0 ms | 21620 ms | 589 ms
|
ViewItem | 12 % | 6624 | 0 | 3 ms | 22409 ms | 616 ms
|
ViewUserInfo | 2 % | 1193 | 0 | 3 ms | 21573 ms | 632 ms
|
ViewBidHistory | 1 % | 684 | 0 | 3 ms | 21069 ms | 780 ms
|
BuyNowAuth | 1 % | 607 | 0 | 2 ms | 21007 ms | 455 ms
|
BuyNow | 1 % | 554 | 96 | 4 ms | 21079 ms | 391 ms
|
StoreBuyBow | 0 % | 398 | 0 | 4 ms | 22025 ms | 458 ms
|
PutBidAuth | 4 % | 2198 | 0 | 0 ms | 21511 ms | 534 ms
|
PutBid | 4 % | 2161 | 334 | 4 ms | 45003 ms | 439 ms
|
StoreBid | 2 % | 1209 | 1 | 4 ms | 21072 ms | 442 ms
|
PutCommentAuth | 0 % | 0 | 0 | 0 ms | 0 ms | 0 ms
|
PutComment | 0 % | 191 | 14 | 5 ms | 21315 ms | 603 ms
|
StoreComment | 0 % | 159 | 0 | 4 ms | 9005 ms | 151 ms
|
Sell | 0 % | 331 | 0 | 0 ms | 21513 ms | 1245 ms
|
SelectCategoryToSellItem | 0 % | 314 | 0 | 4 ms | 21364 ms | 661 ms
|
SellItemForm | 0 % | 289 | 0 | 2 ms | 21012 ms | 518 ms
|
RegisterItem | 0 % | 263 | 0 | 4 ms | 21028 ms | 711 ms
|
AboutMe (auth form) | 2 % | 1167 | 0 | 0 ms | 21950 ms | 992 ms
|
AboutMe | 3 % | 1651 | 0 | 4 ms | 22901 ms | 703 ms
|
Back probability | 7 % | 4127 | 0 | 0 ms | 0 ms | 0 ms
|
End of Session | 1 % | 526 | 0 | 0 ms | 0 ms | 0 ms
|
Total | 100 % | 51967 | 449 | - | - | 823 ms
|
Average throughput | 436 req/s
| |||||
Completed sessions | 466
| |||||
Total time | 24985 seconds
| |||||
Average session time | 53 seconds
| |||||
| State name | % of total | Count | Errors | Minimum Time | Maximum Time | Average Time |
|---|---|---|---|---|---|---|
Home | 4 % | 10033 | 0 | 0 ms | 5133 ms | 75 ms
|
Register | 1 % | 2238 | 0 | 0 ms | 3097 ms | 175 ms
|
RegisterUser | 1 % | 2185 | 47 | 4 ms | 3364 ms | 216 ms
|
Browse | 7 % | 15462 | 0 | 0 ms | 5190 ms | 197 ms
|
BrowseCategories | 5 % | 10755 | 0 | 3 ms | 4858 ms | 202 ms
|
SearchItemsInCategory | 15 % | 33249 | 0 | 0 ms | 6092 ms | 319 ms
|
BrowseRegions | 2 % | 4484 | 0 | 3 ms | 5227 ms | 208 ms
|
BrowseCategoriesInRegion | 2 % | 4424 | 0 | 3 ms | 4840 ms | 197 ms
|
SearchItemsInRegion | 4 % | 10669 | 0 | 0 ms | 5293 ms | 282 ms
|
ViewItem | 14 % | 30714 | 0 | 3 ms | 5321 ms | 229 ms
|
ViewUserInfo | 3 % | 6878 | 0 | 3 ms | 5198 ms | 211 ms
|
ViewBidHistory | 1 % | 3706 | 0 | 3 ms | 5385 ms | 294 ms
|
BuyNowAuth | 1 % | 2824 | 0 | 2 ms | 21003 ms | 217 ms
|
BuyNow | 1 % | 2773 | 455 | 5 ms | 21016 ms | 240 ms
|
StoreBuyBow | 1 % | 2294 | 0 | 4 ms | 4939 ms | 212 ms
|
PutBidAuth | 4 % | 10602 | 0 | 0 ms | 5227 ms | 208 ms
|
PutBid | 5 % | 12109 | 1481 | 4 ms | 4961 ms | 233 ms
|
StoreBid | 3 % | 7858 | 8 | 4 ms | 4780 ms | 222 ms
|
PutCommentAuth | 0 % | 0 | 0 | 0 ms | 0 ms | 0 ms
|
PutComment | 0 % | 1060 | 92 | 5 ms | 3395 ms | 229 ms
|
StoreComment | 0 % | 954 | 0 | 4 ms | 3124 ms | 224 ms
|
Sell | 0 % | 1226 | 0 | 0 ms | 5273 ms | 205 ms
|
SelectCategoryToSellItem | 0 % | 1198 | 0 | 4 ms | 3123 ms | 223 ms
|
SellItemForm | 0 % | 1187 | 0 | 2 ms | 3279 ms | 189 ms
|
RegisterItem | 0 % | 1174 | 0 | 4 ms | 4339 ms | 236 ms
|
AboutMe (auth form) | 1 % | 3584 | 0 | 0 ms | 5223 ms | 178 ms
|
AboutMe | 2 % | 6083 | 0 | 4 ms | 5268 ms | 280 ms
|
Back probability | 10 % | 21971 | 0 | 0 ms | 0 ms | 0 ms
|
End of Session | 1 % | 3056 | 0 | 0 ms | 0 ms | 0 ms
|
Total | 100 % | 214750 | 2083 | - | - | 204 ms
|
Average throughput | 481 req/s
| |||||
Completed sessions | 3077
| |||||
Total time | 756402 seconds
| |||||
Average session time | 245 seconds
| |||||
| State name | % of total | Count | Errors | Minimum Time | Maximum Time | Average Time |
|---|---|---|---|---|---|---|
Home | 4 % | 319 | 0 | 0 ms | 2999 ms | 23 ms
|
Register | 0 % | 63 | 0 | 0 ms | 3004 ms | 214 ms
|
RegisterUser | 0 % | 72 | 4 | 5 ms | 3064 ms | 113 ms
|
Browse | 7 % | 529 | 0 | 0 ms | 3036 ms | 94 ms
|
BrowseCategories | 5 % | 379 | 0 | 3 ms | 3060 ms | 67 ms
|
SearchItemsInCategory | 16 % | 1194 | 0 | 1 ms | 3066 ms | 129 ms
|
BrowseRegions | 2 % | 162 | 0 | 3 ms | 3052 ms | 57 ms
|
BrowseCategoriesInRegion | 1 % | 144 | 0 | 3 ms | 3067 ms | 91 ms
|
SearchItemsInRegion | 4 % | 343 | 0 | 0 ms | 3112 ms | 134 ms
|
ViewItem | 14 % | 1026 | 0 | 3 ms | 3124 ms | 113 ms
|
ViewUserInfo | 3 % | 259 | 0 | 3 ms | 3058 ms | 58 ms
|
ViewBidHistory | 2 % | 146 | 0 | 5 ms | 3149 ms | 103 ms
|
BuyNowAuth | 1 % | 89 | 0 | 2 ms | 3004 ms | 71 ms
|
BuyNow | 1 % | 98 | 13 | 5 ms | 3000 ms | 72 ms
|
StoreBuyBow | 1 % | 90 | 0 | 5 ms | 601 ms | 17 ms
|
PutBidAuth | 5 % | 376 | 0 | 0 ms | 3014 ms | 29 ms
|
PutBid | 5 % | 379 | 37 | 4 ms | 3076 ms | 113 ms
|
StoreBid | 3 % | 237 | 0 | 5 ms | 3056 ms | 168 ms
|
PutCommentAuth | 0 % | 0 | 0 | 0 ms | 0 ms | 0 ms
|
PutComment | 0 % | 31 | 3 | 5 ms | 3079 ms | 349 ms
|
StoreComment | 0 % | 22 | 0 | 5 ms | 3026 ms | 291 ms
|
Sell | 0 % | 33 | 0 | 0 ms | 3033 ms | 158 ms
|
SelectCategoryToSellItem | 0 % | 30 | 0 | 5 ms | 77 ms | 15 ms
|
SellItemForm | 0 % | 37 | 0 | 2 ms | 3010 ms | 83 ms
|
RegisterItem | 0 % | 30 | 0 | 5 ms | 42 ms | 11 ms
|
AboutMe (auth form) | 1 % | 126 | 0 | 0 ms | 3008 ms | 48 ms
|
AboutMe | 2 % | 202 | 0 | 9 ms | 3021 ms | 112 ms
|
Back probability | 10 % | 737 | 0 | 0 ms | 0 ms | 0 ms
|
End of Session | 1 % | 96 | 0 | 0 ms | 0 ms | 0 ms
|
Total | 100 % | 7249 | 57 | - | - | 87 ms
|
Average throughput | 243 req/s
| |||||
Completed sessions | 88
| |||||
Total time | 30583 seconds
| |||||
Average session time | 347 seconds
| |||||
| State name | % of total | Count | Errors | Minimum Time | Maximum Time | Average Time |
|---|---|---|---|---|---|---|
Home | 5 % | 15374 | 0 | 0 ms | 45000 ms | 940 ms
|
Register | 1 % | 2959 | 0 | 0 ms | 22896 ms | 374 ms
|
RegisterUser | 1 % | 2869 | 55 | 4 ms | 45000 ms | 369 ms
|
Browse | 7 % | 20945 | 0 | 0 ms | 45000 ms | 399 ms
|
BrowseCategories | 5 % | 14443 | 0 | 3 ms | 45007 ms | 331 ms
|
SearchItemsInCategory | 15 % | 42198 | 0 | 0 ms | 45068 ms | 367 ms
|
BrowseRegions | 2 % | 6002 | 0 | 3 ms | 45001 ms | 345 ms
|
BrowseCategoriesInRegion | 2 % | 5836 | 0 | 3 ms | 21732 ms | 300 ms
|
SearchItemsInRegion | 4 % | 13578 | 0 | 0 ms | 21620 ms | 336 ms
|
ViewItem | 14 % | 38442 | 0 | 3 ms | 22409 ms | 292 ms
|
ViewUserInfo | 3 % | 8348 | 0 | 3 ms | 21573 ms | 266 ms
|
ViewBidHistory | 1 % | 4548 | 0 | 3 ms | 21069 ms | 360 ms
|
BuyNowAuth | 1 % | 3520 | 0 | 2 ms | 21007 ms | 255 ms
|
BuyNow | 1 % | 3425 | 564 | 4 ms | 21079 ms | 260 ms
|
StoreBuyBow | 1 % | 2782 | 0 | 4 ms | 22025 ms | 241 ms
|
PutBidAuth | 4 % | 13176 | 0 | 0 ms | 21511 ms | 257 ms
|
PutBid | 5 % | 14684 | 1852 | 4 ms | 45003 ms | 260 ms
|
StoreBid | 3 % | 9304 | 9 | 4 ms | 21072 ms | 250 ms
|
PutCommentAuth | 0 % | 0 | 0 | 0 ms | 0 ms | 0 ms
|
PutComment | 0 % | 1282 | 109 | 5 ms | 21315 ms | 288 ms
|
StoreComment | 0 % | 1135 | 0 | 4 ms | 9005 ms | 215 ms
|
Sell | 0 % | 1591 | 0 | 0 ms | 21513 ms | 420 ms
|
SelectCategoryToSellItem | 0 % | 1542 | 0 | 4 ms | 21364 ms | 308 ms
|
SellItemForm | 0 % | 1513 | 0 | 2 ms | 21012 ms | 249 ms
|
RegisterItem | 0 % | 1467 | 0 | 4 ms | 21028 ms | 317 ms
|
AboutMe (auth form) | 1 % | 4877 | 0 | 0 ms | 21950 ms | 369 ms
|
AboutMe | 2 % | 7978 | 0 | 4 ms | 22901 ms | 362 ms
|
Back probability | 9 % | 26836 | 0 | 0 ms | 0 ms | 0 ms
|
End of Session | 1 % | 3678 | 0 | 0 ms | 0 ms | 0 ms
|
Total | 100 % | 274332 | 2589 | - | - | 318 ms
|
Average throughput | 461 req/s
| |||||
Completed sessions | 3678
| |||||
Total time | 832989 seconds
| |||||
Average session time | 226 seconds
| |||||
An error occured while waiting for remote processes termination (Skipping waits)
Command is: /usr/bin/scp farm6.csail.mit.edu:/tmp/client1 /home/drkp/sandbox/txcache/src/RUBiS-1.4.3/bench/2009-3-19@17:24:14//client1.bin
Command is: /usr/bin/ssh -x localhost /bin/bash -c 'LANG=en_GB.UTF-8 /usr/bin/sar -n DEV -n SOCK -rubcw 1 605 -f /home/drkp/sandbox/txcache/src/RUBiS-1.4.3/bench/2009-3-19@17:24:14//client1.bin > /home/drkp/sandbox/txcache/src/RUBiS-1.4.3/bench/2009-3-19@17:24:14//client1'
Command is: /usr/bin/scp farm14:/tmp/db_server0 /home/drkp/sandbox/txcache/src/RUBiS-1.4.3/bench/2009-3-19@17:24:14//db_server0.bin
Command is: /usr/bin/ssh -x localhost /bin/bash -c 'LANG=en_GB.UTF-8 /usr/bin/sar -n DEV -n SOCK -rubcw 1 605 -f /home/drkp/sandbox/txcache/src/RUBiS-1.4.3/bench/2009-3-19@17:24:14//db_server0.bin > /home/drkp/sandbox/txcache/src/RUBiS-1.4.3/bench/2009-3-19@17:24:14//db_server0'
Command is: /usr/bin/scp farm12.csail.mit.edu:/tmp/web_server0 /home/drkp/sandbox/txcache/src/RUBiS-1.4.3/bench/2009-3-19@17:24:14//web_server0.bin
Command is: /usr/bin/ssh -x localhost /bin/bash -c 'LANG=en_GB.UTF-8 /usr/bin/sar -n DEV -n SOCK -rubcw 1 605 -f /home/drkp/sandbox/txcache/src/RUBiS-1.4.3/bench/2009-3-19@17:24:14//web_server0.bin > /home/drkp/sandbox/txcache/src/RUBiS-1.4.3/bench/2009-3-19@17:24:14//web_server0'
Command is: /usr/bin/scp farm13.csail.mit.edu:/tmp/web_server1 /home/drkp/sandbox/txcache/src/RUBiS-1.4.3/bench/2009-3-19@17:24:14//web_server1.bin
Command is: /usr/bin/ssh -x localhost /bin/bash -c 'LANG=en_GB.UTF-8 /usr/bin/sar -n DEV -n SOCK -rubcw 1 605 -f /home/drkp/sandbox/txcache/src/RUBiS-1.4.3/bench/2009-3-19@17:24:14//web_server1.bin > /home/drkp/sandbox/txcache/src/RUBiS-1.4.3/bench/2009-3-19@17:24:14//web_server1'
Command is: /usr/bin/scp localhost:/tmp/client0 /home/drkp/sandbox/txcache/src/RUBiS-1.4.3/bench/2009-3-19@17:24:14//client0.bin
Command is: /usr/bin/ssh -x localhost /bin/bash -c 'LANG=en_GB.UTF-8 /usr/bin/sar -n DEV -n SOCK -rubcw 1 605 -f /home/drkp/sandbox/txcache/src/RUBiS-1.4.3/bench/2009-3-19@17:24:14//client0.bin > /home/drkp/sandbox/txcache/src/RUBiS-1.4.3/bench/2009-3-19@17:24:14//client0'
Command is: /usr/bin/scp farm6.csail.mit.edu:/tmp/trace_client1.html /home/drkp/sandbox/txcache/src/RUBiS-1.4.3/bench/2009-3-19@17:24:14//
Command is: /usr/bin/scp farm6.csail.mit.edu:/tmp/stat_client1.html /home/drkp/sandbox/txcache/src/RUBiS-1.4.3/bench/2009-3-19@17:24:14//
|
|
|
|
|
|
 | 
|
 | 
|
 | 
|
 | 
|
 | 
|
 | 
|
 | 
|
 | 
|
 | 
|