Node information
Test timing information
Up ramp statistics
Runtime session statistics
Down ramp statistics
Overall statistics
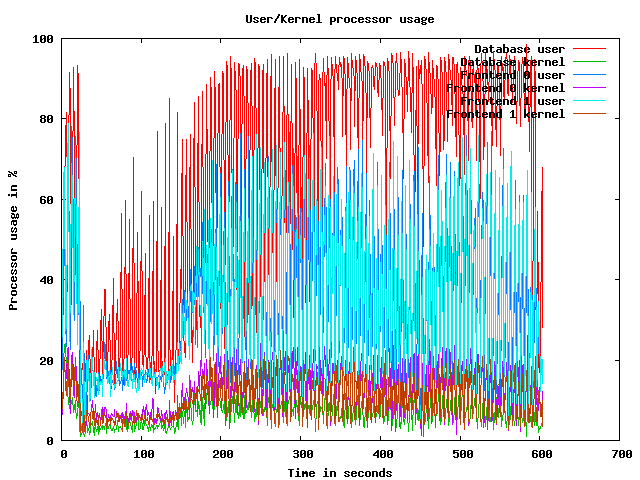
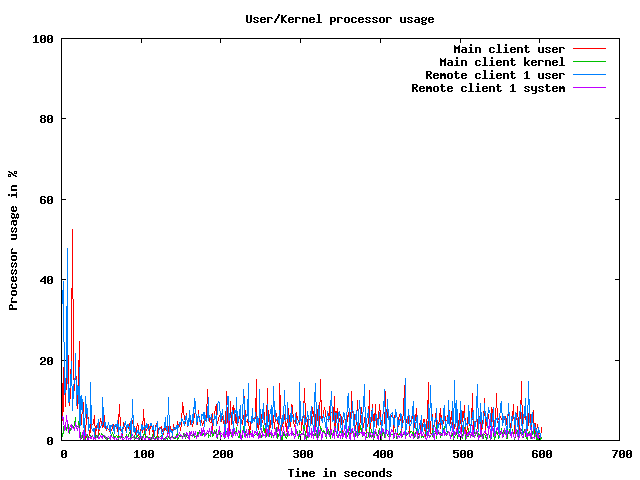
CPU usage graphs
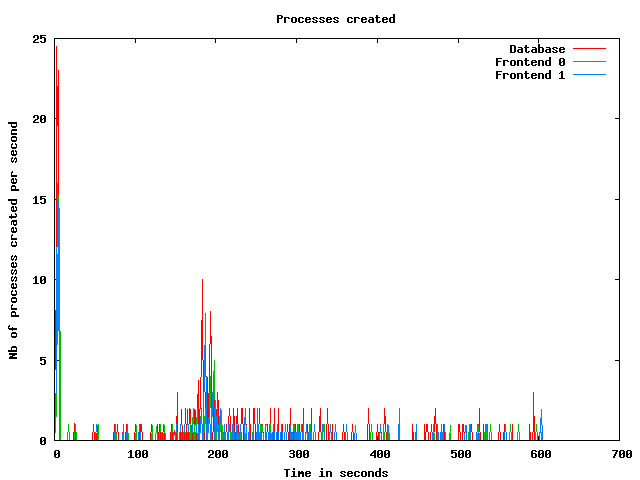
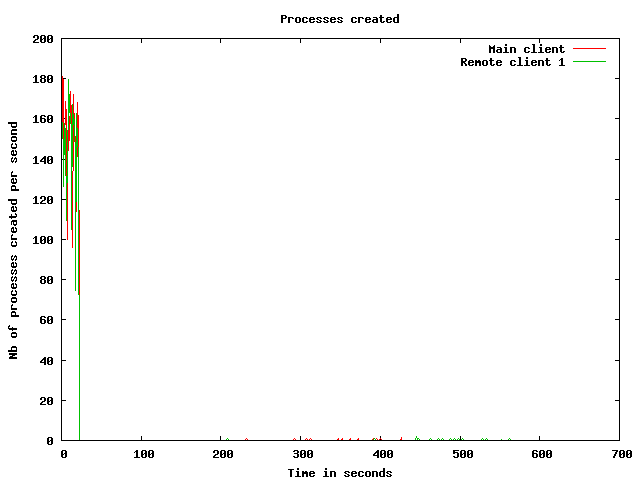
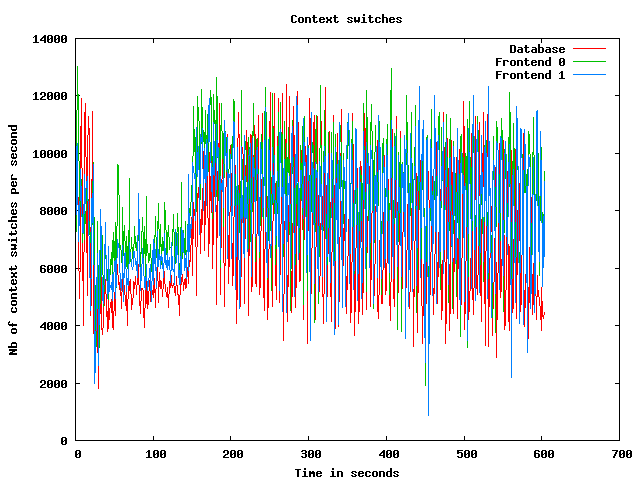
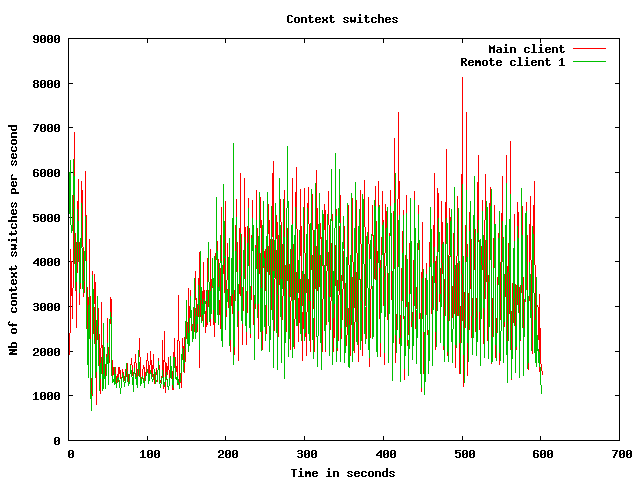
Processes usage graphs
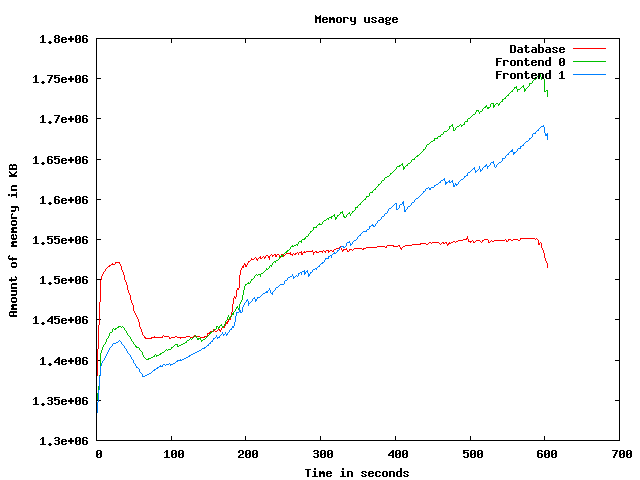
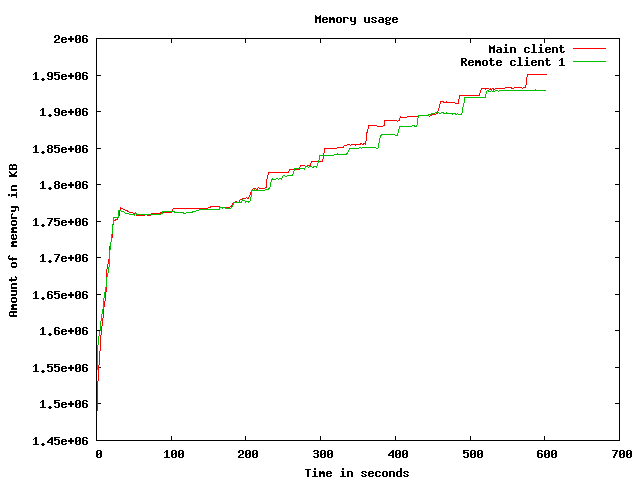
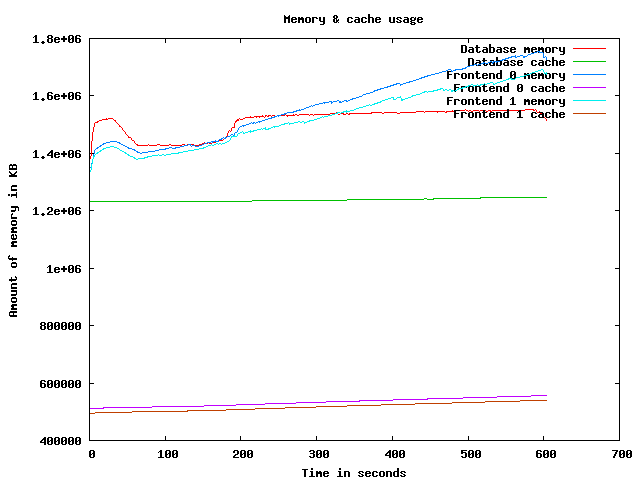
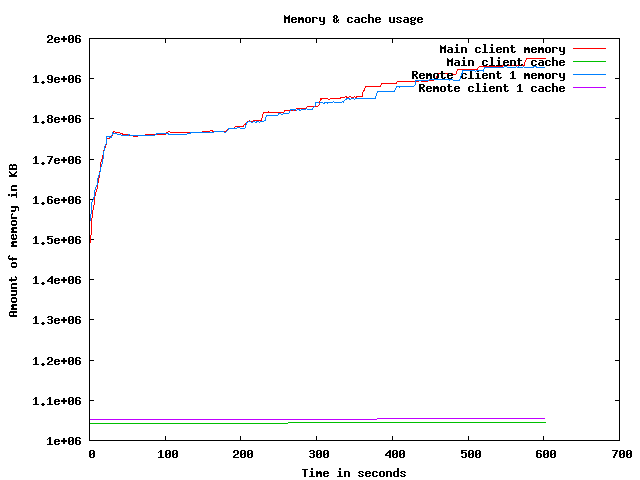
Memory usage graph
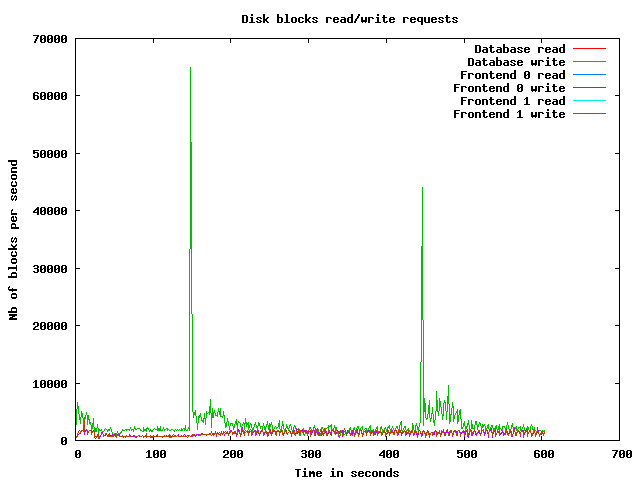
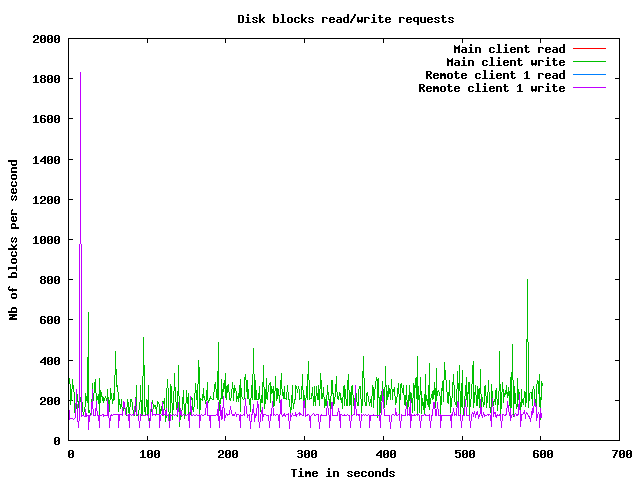
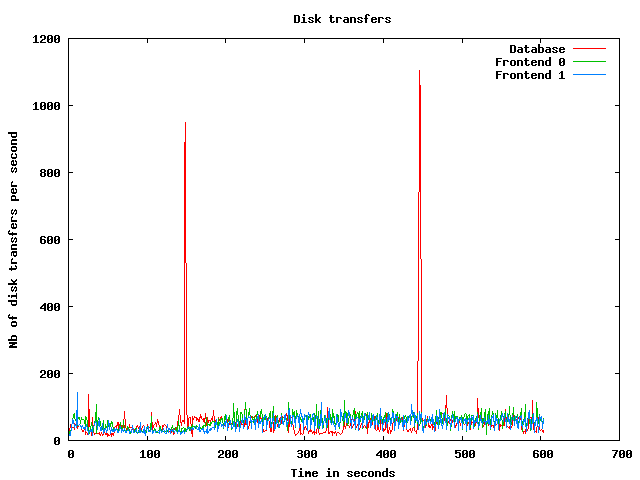
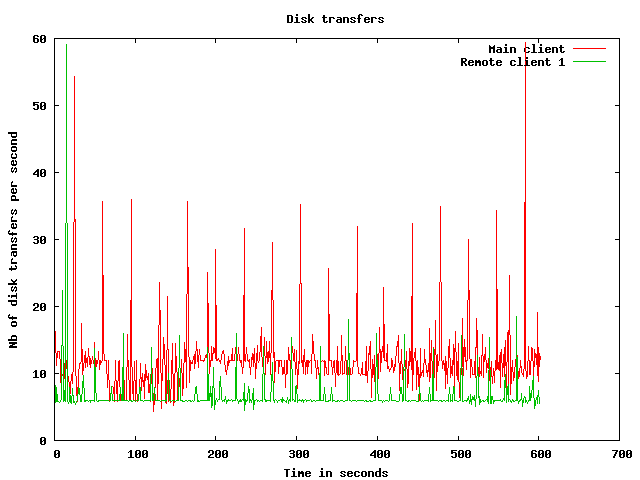
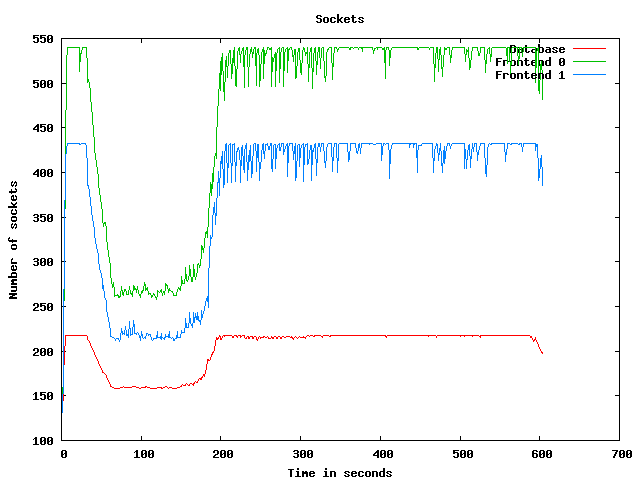
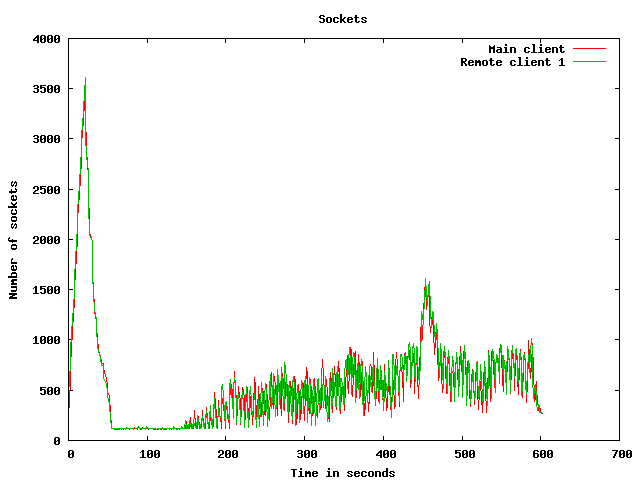
Disk usage graphs
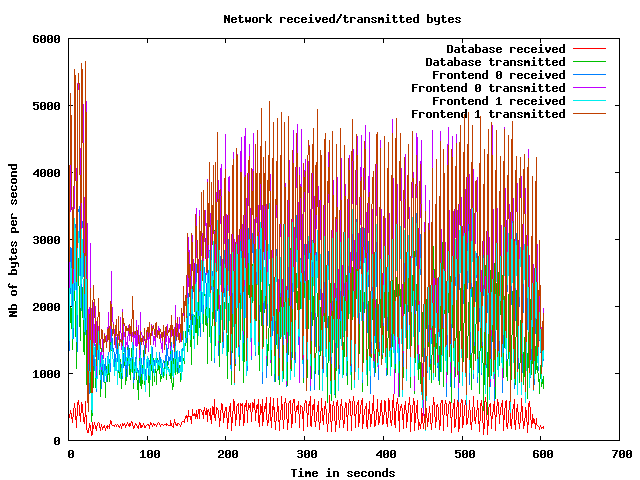
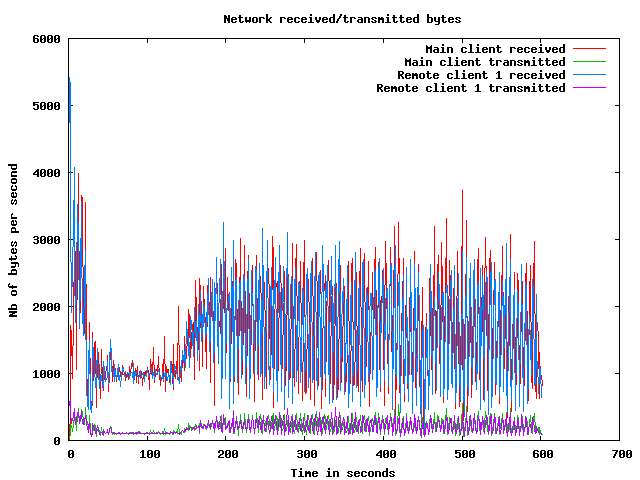
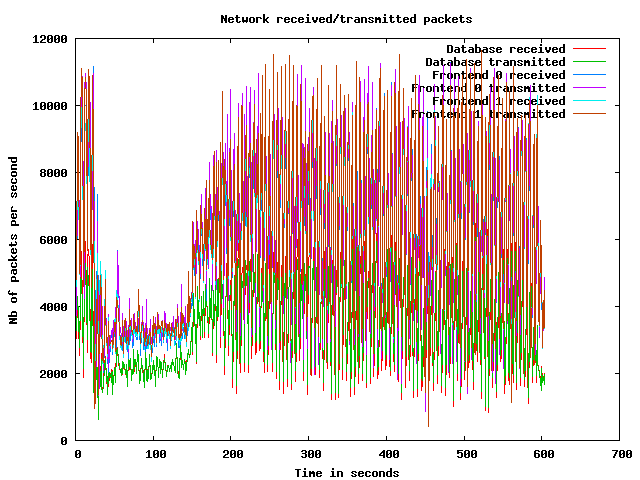
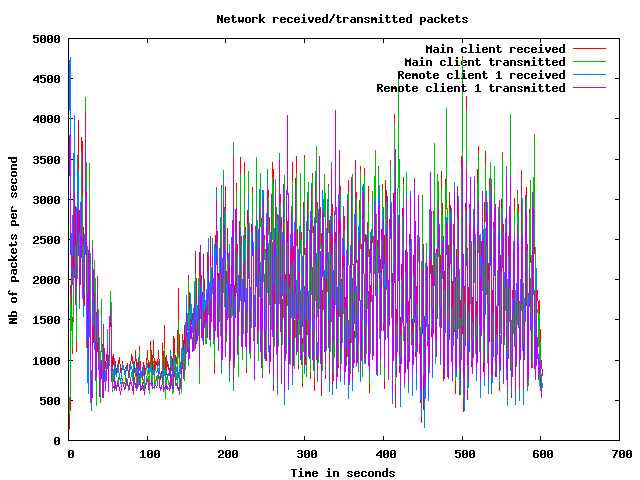
Network usage graphs
| Test start | 2009-3-19 17:37:15 |
| Up ramp start | 2009-3-19 17:37:39 |
| Runtime session start | 2009-3-19 17:39:39 |
| Down ramp start | 2009-3-19 17:47:9 |
| Test end | 2009-3-19 17:49:42 |
| Up ramp length | 2 minutes 0 millisecond (requested 120000 ms) |
| Runtime session length | 7 minutes 30 seconds 0 millisecond (requested 450000 ms) |
| Down ramp length | 30 seconds 1 millisecond (requested 30000 ms) |
| Total test length | 12 minutes 26 seconds 887 milliseconds |
| State name | % of total | Count | Errors | Minimum Time | Maximum Time | Average Time |
|---|---|---|---|---|---|---|
Home | 10 % | 5447 | 0 | 0 ms | 45360 ms | 5398 ms
|
Register | 1 % | 765 | 0 | 0 ms | 45009 ms | 2141 ms
|
RegisterUser | 1 % | 709 | 12 | 5 ms | 45125 ms | 1317 ms
|
Browse | 9 % | 5352 | 0 | 0 ms | 45429 ms | 1829 ms
|
BrowseCategories | 6 % | 3520 | 0 | 3 ms | 45406 ms | 1353 ms
|
SearchItemsInCategory | 14 % | 8062 | 0 | 0 ms | 45445 ms | 1018 ms
|
BrowseRegions | 2 % | 1492 | 0 | 3 ms | 45434 ms | 1187 ms
|
BrowseCategoriesInRegion | 2 % | 1382 | 0 | 3 ms | 45160 ms | 1061 ms
|
SearchItemsInRegion | 4 % | 2633 | 0 | 0 ms | 45396 ms | 762 ms
|
ViewItem | 12 % | 6723 | 0 | 3 ms | 45455 ms | 840 ms
|
ViewUserInfo | 2 % | 1192 | 0 | 3 ms | 45375 ms | 841 ms
|
ViewBidHistory | 1 % | 571 | 0 | 3 ms | 45027 ms | 630 ms
|
BuyNowAuth | 1 % | 606 | 0 | 2 ms | 45087 ms | 553 ms
|
BuyNow | 1 % | 541 | 88 | 5 ms | 45016 ms | 798 ms
|
StoreBuyBow | 0 % | 391 | 0 | 4 ms | 45002 ms | 930 ms
|
PutBidAuth | 4 % | 2194 | 0 | 0 ms | 45023 ms | 743 ms
|
PutBid | 3 % | 2098 | 285 | 4 ms | 45195 ms | 502 ms
|
StoreBid | 2 % | 1189 | 0 | 4 ms | 45022 ms | 553 ms
|
PutCommentAuth | 0 % | 0 | 0 | 0 ms | 0 ms | 0 ms
|
PutComment | 0 % | 172 | 13 | 4 ms | 21014 ms | 323 ms
|
StoreComment | 0 % | 129 | 0 | 4 ms | 44996 ms | 644 ms
|
Sell | 0 % | 358 | 0 | 0 ms | 45008 ms | 1757 ms
|
SelectCategoryToSellItem | 0 % | 336 | 0 | 4 ms | 45584 ms | 2283 ms
|
SellItemForm | 0 % | 313 | 0 | 2 ms | 23922 ms | 819 ms
|
RegisterItem | 0 % | 288 | 0 | 4 ms | 45005 ms | 967 ms
|
AboutMe (auth form) | 2 % | 1198 | 0 | 0 ms | 45366 ms | 2156 ms
|
AboutMe | 3 % | 1642 | 0 | 4 ms | 45486 ms | 1287 ms
|
Back probability | 7 % | 4042 | 0 | 0 ms | 0 ms | 0 ms
|
End of Session | 0 % | 523 | 0 | 0 ms | 0 ms | 0 ms
|
Total | 100 % | 53868 | 398 | - | - | 1441 ms
|
Average throughput | 452 req/s
| |||||
Completed sessions | 474
| |||||
Total time | 28124 seconds
| |||||
Average session time | 59 seconds
| |||||
| State name | % of total | Count | Errors | Minimum Time | Maximum Time | Average Time |
|---|---|---|---|---|---|---|
Home | 4 % | 10222 | 0 | 0 ms | 93847 ms | 379 ms
|
Register | 1 % | 2421 | 0 | 0 ms | 46317 ms | 794 ms
|
RegisterUser | 1 % | 2377 | 51 | 5 ms | 93694 ms | 979 ms
|
Browse | 7 % | 16188 | 0 | 0 ms | 93685 ms | 861 ms
|
BrowseCategories | 4 % | 11265 | 0 | 3 ms | 93510 ms | 853 ms
|
SearchItemsInCategory | 15 % | 35234 | 0 | 0 ms | 190019 ms | 1117 ms
|
BrowseRegions | 2 % | 4706 | 0 | 3 ms | 93690 ms | 975 ms
|
BrowseCategoriesInRegion | 2 % | 4625 | 0 | 3 ms | 190104 ms | 997 ms
|
SearchItemsInRegion | 5 % | 11465 | 0 | 0 ms | 93829 ms | 1041 ms
|
ViewItem | 14 % | 32032 | 0 | 3 ms | 96823 ms | 942 ms
|
ViewUserInfo | 3 % | 7328 | 0 | 3 ms | 96829 ms | 941 ms
|
ViewBidHistory | 1 % | 3832 | 0 | 3 ms | 46810 ms | 1074 ms
|
BuyNowAuth | 1 % | 2980 | 0 | 2 ms | 93086 ms | 874 ms
|
BuyNow | 1 % | 2934 | 480 | 5 ms | 93427 ms | 910 ms
|
StoreBuyBow | 1 % | 2394 | 0 | 5 ms | 93547 ms | 940 ms
|
PutBidAuth | 4 % | 11106 | 0 | 0 ms | 96716 ms | 870 ms
|
PutBid | 5 % | 12723 | 1471 | 5 ms | 93773 ms | 996 ms
|
StoreBid | 3 % | 8280 | 3 | 5 ms | 93485 ms | 950 ms
|
PutCommentAuth | 0 % | 0 | 0 | 0 ms | 0 ms | 0 ms
|
PutComment | 0 % | 1073 | 81 | 5 ms | 97855 ms | 990 ms
|
StoreComment | 0 % | 979 | 0 | 5 ms | 93115 ms | 914 ms
|
Sell | 0 % | 1292 | 0 | 0 ms | 22493 ms | 839 ms
|
SelectCategoryToSellItem | 0 % | 1266 | 0 | 4 ms | 21066 ms | 809 ms
|
SellItemForm | 0 % | 1244 | 0 | 2 ms | 93375 ms | 947 ms
|
RegisterItem | 0 % | 1218 | 0 | 4 ms | 93721 ms | 876 ms
|
AboutMe (auth form) | 1 % | 3832 | 0 | 0 ms | 93399 ms | 943 ms
|
AboutMe | 2 % | 6468 | 0 | 6 ms | 93793 ms | 1031 ms
|
Back probability | 10 % | 23421 | 0 | 0 ms | 0 ms | 0 ms
|
End of Session | 1 % | 3145 | 0 | 0 ms | 0 ms | 0 ms
|
Total | 100 % | 226050 | 2086 | - | - | 823 ms
|
Average throughput | 506 req/s
| |||||
Completed sessions | 3159
| |||||
Total time | 832679 seconds
| |||||
Average session time | 263 seconds
| |||||
| State name | % of total | Count | Errors | Minimum Time | Maximum Time | Average Time |
|---|---|---|---|---|---|---|
Home | 4 % | 358 | 0 | 0 ms | 45001 ms | 683 ms
|
Register | 1 % | 92 | 0 | 0 ms | 9678 ms | 441 ms
|
RegisterUser | 1 % | 84 | 2 | 5 ms | 45007 ms | 3160 ms
|
Browse | 7 % | 590 | 0 | 0 ms | 45002 ms | 1101 ms
|
BrowseCategories | 4 % | 415 | 0 | 3 ms | 92999 ms | 1450 ms
|
SearchItemsInCategory | 16 % | 1345 | 0 | 0 ms | 45644 ms | 1367 ms
|
BrowseRegions | 1 % | 167 | 0 | 3 ms | 45005 ms | 1061 ms
|
BrowseCategoriesInRegion | 1 % | 162 | 0 | 3 ms | 93001 ms | 1786 ms
|
SearchItemsInRegion | 4 % | 411 | 0 | 0 ms | 45787 ms | 1268 ms
|
ViewItem | 14 % | 1179 | 0 | 3 ms | 93023 ms | 1329 ms
|
ViewUserInfo | 3 % | 254 | 0 | 3 ms | 93012 ms | 1657 ms
|
ViewBidHistory | 1 % | 137 | 0 | 5 ms | 45663 ms | 1666 ms
|
BuyNowAuth | 1 % | 115 | 0 | 2 ms | 45003 ms | 1543 ms
|
BuyNow | 1 % | 124 | 17 | 5 ms | 45020 ms | 1896 ms
|
StoreBuyBow | 1 % | 117 | 0 | 5 ms | 21013 ms | 483 ms
|
PutBidAuth | 4 % | 401 | 0 | 0 ms | 45001 ms | 1484 ms
|
PutBid | 5 % | 489 | 53 | 5 ms | 93008 ms | 1337 ms
|
StoreBid | 3 % | 311 | 0 | 4 ms | 93014 ms | 1496 ms
|
PutCommentAuth | 0 % | 0 | 0 | 0 ms | 0 ms | 0 ms
|
PutComment | 0 % | 33 | 8 | 5 ms | 45669 ms | 2004 ms
|
StoreComment | 0 % | 31 | 0 | 5 ms | 21002 ms | 1681 ms
|
Sell | 0 % | 49 | 0 | 0 ms | 21001 ms | 628 ms
|
SelectCategoryToSellItem | 0 % | 52 | 0 | 4 ms | 22200 ms | 818 ms
|
SellItemForm | 0 % | 43 | 0 | 2 ms | 3333 ms | 391 ms
|
RegisterItem | 0 % | 50 | 0 | 4 ms | 12892 ms | 401 ms
|
AboutMe (auth form) | 1 % | 138 | 0 | 0 ms | 45004 ms | 1571 ms
|
AboutMe | 2 % | 219 | 0 | 12 ms | 21068 ms | 832 ms
|
Back probability | 10 % | 896 | 0 | 0 ms | 0 ms | 0 ms
|
End of Session | 1 % | 107 | 0 | 0 ms | 0 ms | 0 ms
|
Total | 100 % | 8369 | 80 | - | - | 1143 ms
|
Average throughput | 281 req/s
| |||||
Completed sessions | 89
| |||||
Total time | 31440 seconds
| |||||
Average session time | 353 seconds
| |||||
| State name | % of total | Count | Errors | Minimum Time | Maximum Time | Average Time |
|---|---|---|---|---|---|---|
Home | 5 % | 16029 | 0 | 0 ms | 93847 ms | 2091 ms
|
Register | 1 % | 3278 | 0 | 0 ms | 93004 ms | 1127 ms
|
RegisterUser | 1 % | 3171 | 65 | 5 ms | 93694 ms | 1112 ms
|
Browse | 7 % | 22131 | 0 | 0 ms | 93685 ms | 1106 ms
|
BrowseCategories | 5 % | 15201 | 0 | 3 ms | 190006 ms | 997 ms
|
SearchItemsInCategory | 15 % | 44833 | 0 | 0 ms | 190046 ms | 1115 ms
|
BrowseRegions | 2 % | 6365 | 0 | 3 ms | 93690 ms | 1027 ms
|
BrowseCategoriesInRegion | 2 % | 6169 | 0 | 3 ms | 190104 ms | 1032 ms
|
SearchItemsInRegion | 5 % | 14554 | 0 | 0 ms | 93829 ms | 1000 ms
|
ViewItem | 13 % | 40000 | 0 | 3 ms | 96823 ms | 946 ms
|
ViewUserInfo | 3 % | 8791 | 0 | 3 ms | 96829 ms | 946 ms
|
ViewBidHistory | 1 % | 4551 | 0 | 3 ms | 46810 ms | 1034 ms
|
BuyNowAuth | 1 % | 3701 | 0 | 2 ms | 189998 ms | 919 ms
|
BuyNow | 1 % | 3601 | 586 | 5 ms | 93427 ms | 952 ms
|
StoreBuyBow | 1 % | 2902 | 0 | 4 ms | 93547 ms | 921 ms
|
PutBidAuth | 4 % | 13704 | 0 | 0 ms | 96716 ms | 868 ms
|
PutBid | 5 % | 15350 | 1810 | 4 ms | 190009 ms | 973 ms
|
StoreBid | 3 % | 9783 | 3 | 4 ms | 190001 ms | 948 ms
|
PutCommentAuth | 0 % | 0 | 0 | 0 ms | 0 ms | 0 ms
|
PutComment | 0 % | 1278 | 102 | 4 ms | 97855 ms | 926 ms
|
StoreComment | 0 % | 1139 | 0 | 4 ms | 93115 ms | 904 ms
|
Sell | 0 % | 1699 | 0 | 0 ms | 45008 ms | 1026 ms
|
SelectCategoryToSellItem | 0 % | 1654 | 0 | 4 ms | 45584 ms | 1109 ms
|
SellItemForm | 0 % | 1600 | 0 | 2 ms | 93375 ms | 907 ms
|
RegisterItem | 0 % | 1556 | 0 | 4 ms | 93721 ms | 878 ms
|
AboutMe (auth form) | 1 % | 5168 | 0 | 0 ms | 93399 ms | 1241 ms
|
AboutMe | 2 % | 8374 | 0 | 4 ms | 190017 ms | 1093 ms
|
Back probability | 9 % | 28360 | 0 | 0 ms | 0 ms | 0 ms
|
End of Session | 1 % | 3776 | 0 | 0 ms | 0 ms | 0 ms
|
Total | 100 % | 288718 | 2566 | - | - | 956 ms
|
Average throughput | 485 req/s
| |||||
Completed sessions | 3776
| |||||
Total time | 912081 seconds
| |||||
Average session time | 241 seconds
| |||||
An error occured while waiting for remote processes termination (Skipping waits)
Command is: /usr/bin/scp farm6.csail.mit.edu:/tmp/client1 /home/drkp/sandbox/txcache/src/RUBiS-1.4.3/bench/2009-3-19@17:37:15//client1.bin
Command is: /usr/bin/ssh -x localhost /bin/bash -c 'LANG=en_GB.UTF-8 /usr/bin/sar -n DEV -n SOCK -rubcw 1 605 -f /home/drkp/sandbox/txcache/src/RUBiS-1.4.3/bench/2009-3-19@17:37:15//client1.bin > /home/drkp/sandbox/txcache/src/RUBiS-1.4.3/bench/2009-3-19@17:37:15//client1'
Command is: /usr/bin/scp farm14:/tmp/db_server0 /home/drkp/sandbox/txcache/src/RUBiS-1.4.3/bench/2009-3-19@17:37:15//db_server0.bin
Command is: /usr/bin/ssh -x localhost /bin/bash -c 'LANG=en_GB.UTF-8 /usr/bin/sar -n DEV -n SOCK -rubcw 1 605 -f /home/drkp/sandbox/txcache/src/RUBiS-1.4.3/bench/2009-3-19@17:37:15//db_server0.bin > /home/drkp/sandbox/txcache/src/RUBiS-1.4.3/bench/2009-3-19@17:37:15//db_server0'
Command is: /usr/bin/scp farm12.csail.mit.edu:/tmp/web_server0 /home/drkp/sandbox/txcache/src/RUBiS-1.4.3/bench/2009-3-19@17:37:15//web_server0.bin
Command is: /usr/bin/ssh -x localhost /bin/bash -c 'LANG=en_GB.UTF-8 /usr/bin/sar -n DEV -n SOCK -rubcw 1 605 -f /home/drkp/sandbox/txcache/src/RUBiS-1.4.3/bench/2009-3-19@17:37:15//web_server0.bin > /home/drkp/sandbox/txcache/src/RUBiS-1.4.3/bench/2009-3-19@17:37:15//web_server0'
Command is: /usr/bin/scp farm13.csail.mit.edu:/tmp/web_server1 /home/drkp/sandbox/txcache/src/RUBiS-1.4.3/bench/2009-3-19@17:37:15//web_server1.bin
Command is: /usr/bin/ssh -x localhost /bin/bash -c 'LANG=en_GB.UTF-8 /usr/bin/sar -n DEV -n SOCK -rubcw 1 605 -f /home/drkp/sandbox/txcache/src/RUBiS-1.4.3/bench/2009-3-19@17:37:15//web_server1.bin > /home/drkp/sandbox/txcache/src/RUBiS-1.4.3/bench/2009-3-19@17:37:15//web_server1'
Command is: /usr/bin/scp localhost:/tmp/client0 /home/drkp/sandbox/txcache/src/RUBiS-1.4.3/bench/2009-3-19@17:37:15//client0.bin
Command is: /usr/bin/ssh -x localhost /bin/bash -c 'LANG=en_GB.UTF-8 /usr/bin/sar -n DEV -n SOCK -rubcw 1 605 -f /home/drkp/sandbox/txcache/src/RUBiS-1.4.3/bench/2009-3-19@17:37:15//client0.bin > /home/drkp/sandbox/txcache/src/RUBiS-1.4.3/bench/2009-3-19@17:37:15//client0'
Command is: /usr/bin/scp farm6.csail.mit.edu:/tmp/trace_client1.html /home/drkp/sandbox/txcache/src/RUBiS-1.4.3/bench/2009-3-19@17:37:15//
Command is: /usr/bin/scp farm6.csail.mit.edu:/tmp/stat_client1.html /home/drkp/sandbox/txcache/src/RUBiS-1.4.3/bench/2009-3-19@17:37:15//
|
|
|
|
|
|
 | 
|
 | 
|
 | 
|
 | 
|
 | 
|
 | 
|
 | 
|
 | 
|
 | 
|