Node information
Test timing information
Up ramp statistics
Runtime session statistics
Down ramp statistics
Overall statistics
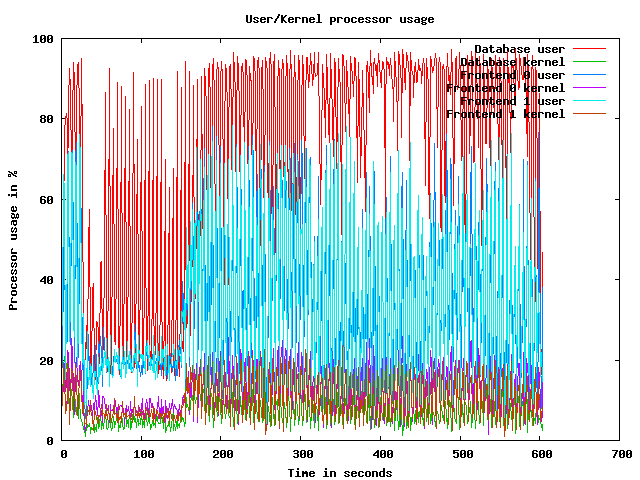
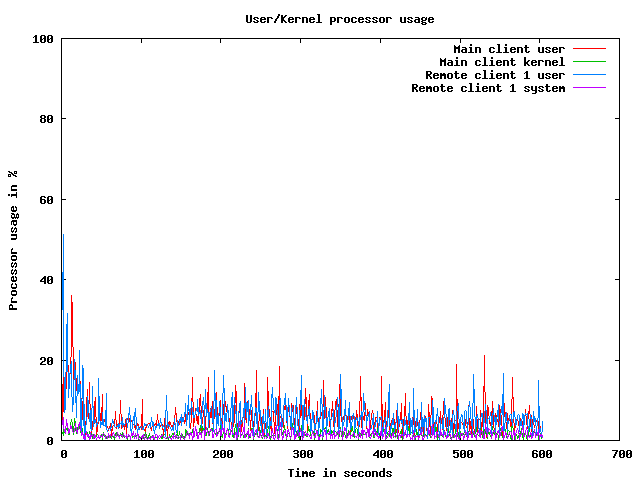
CPU usage graphs
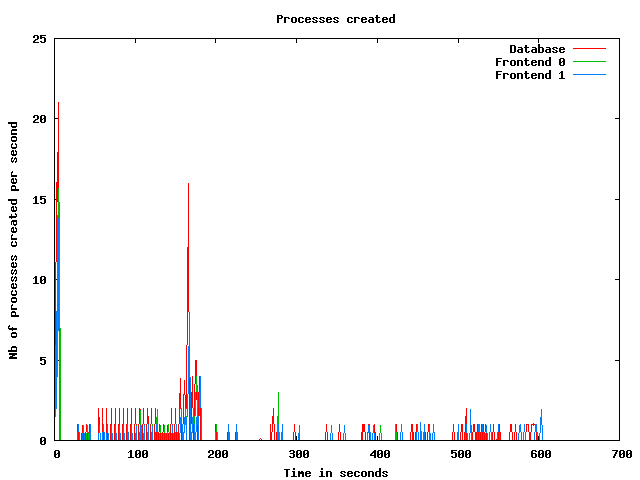
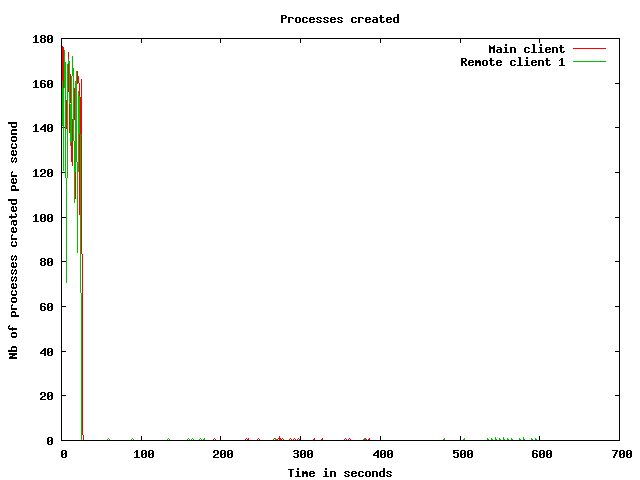
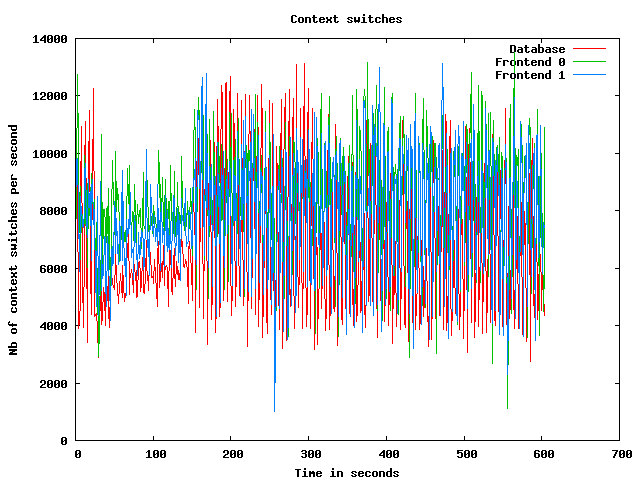
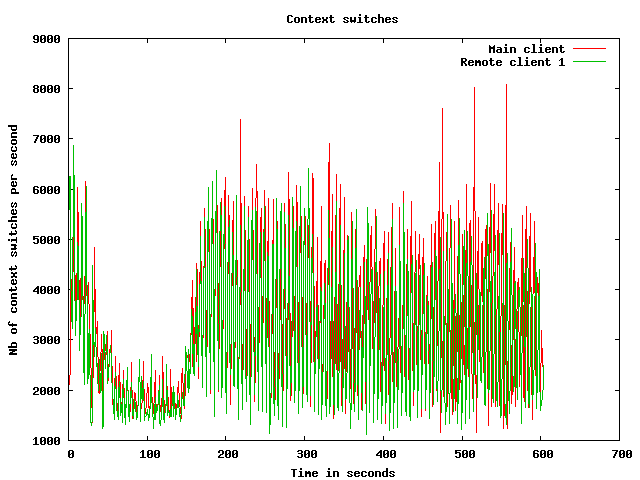
Processes usage graphs
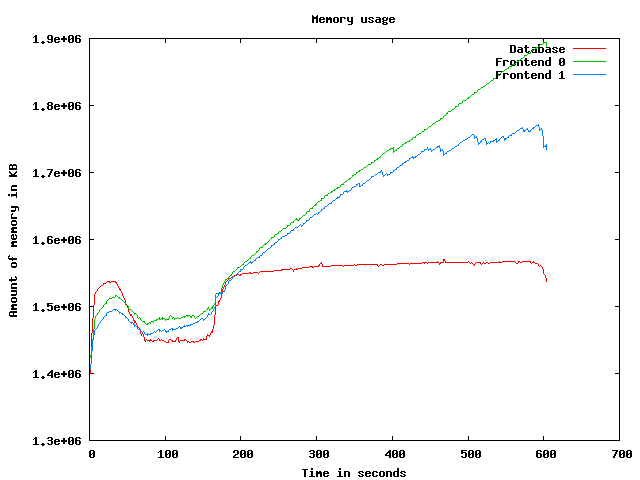
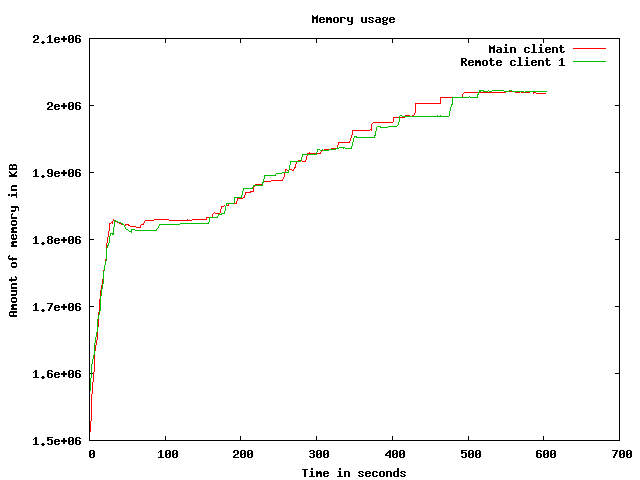
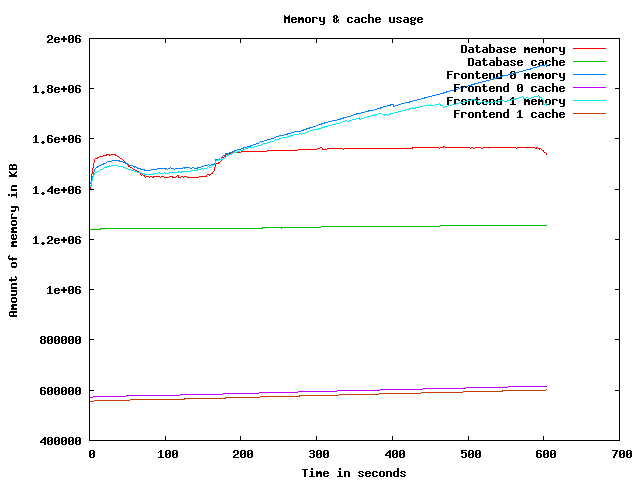
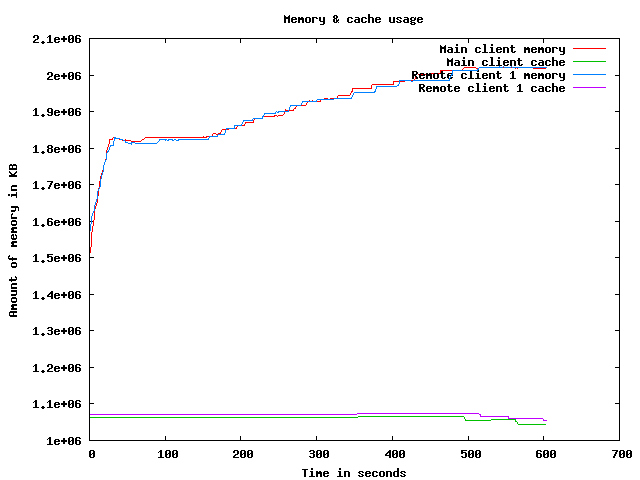
Memory usage graph
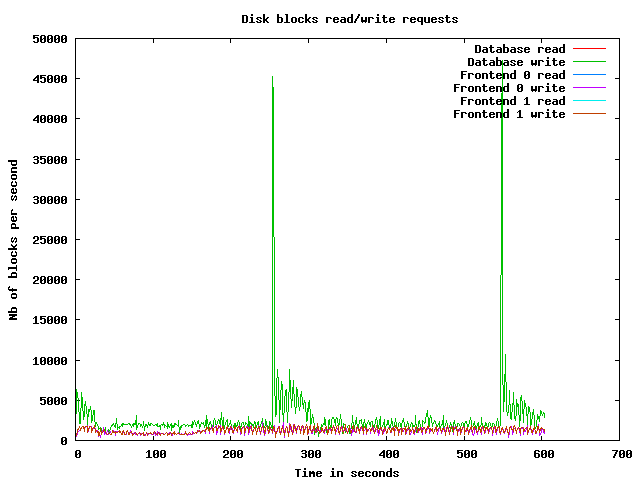
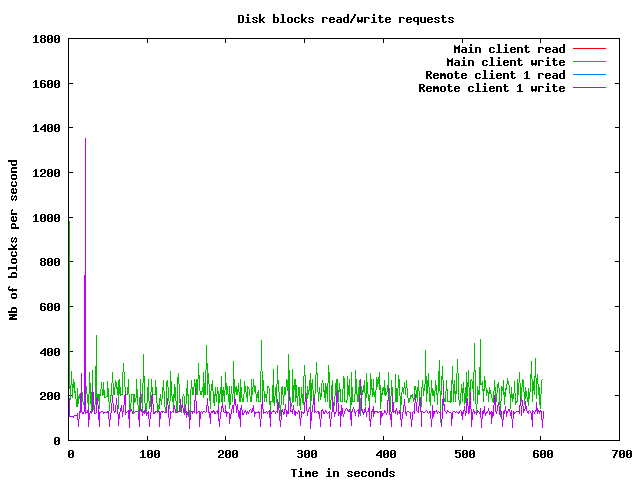
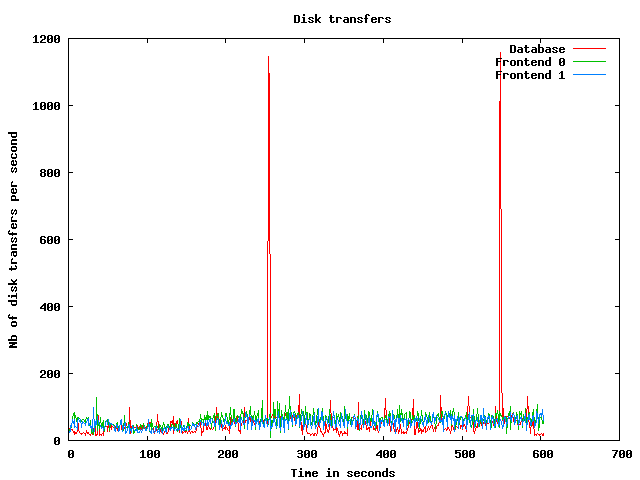
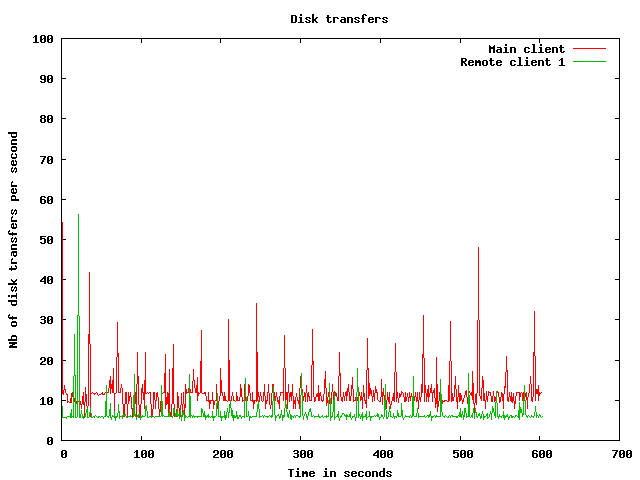
Disk usage graphs
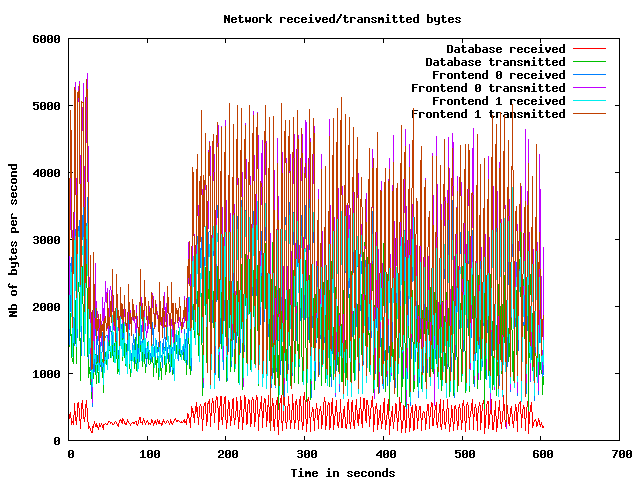
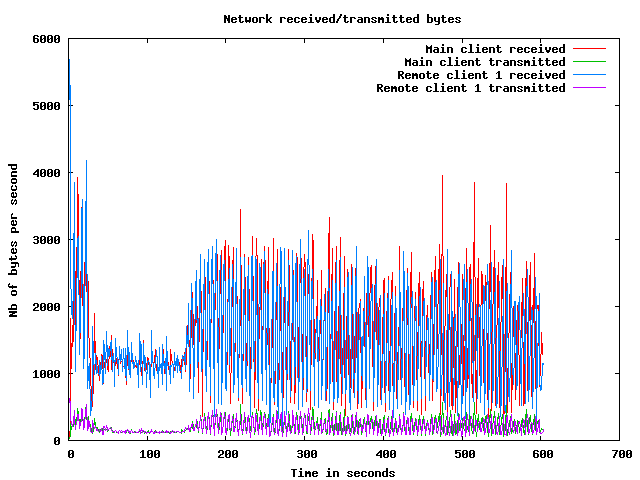
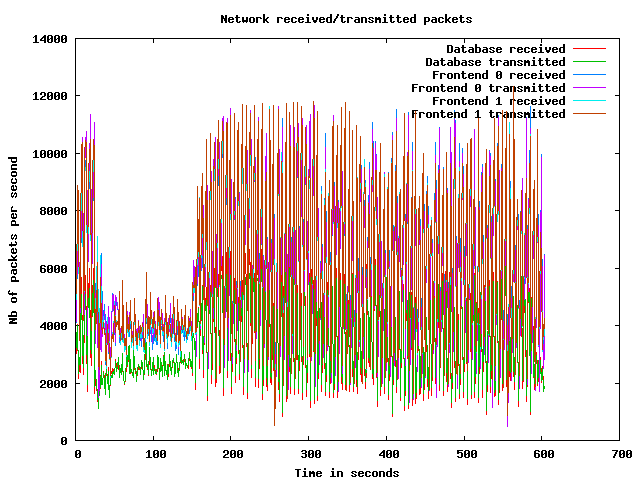
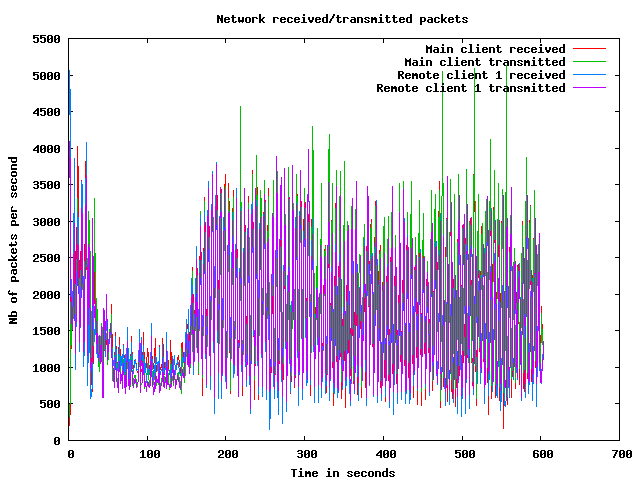
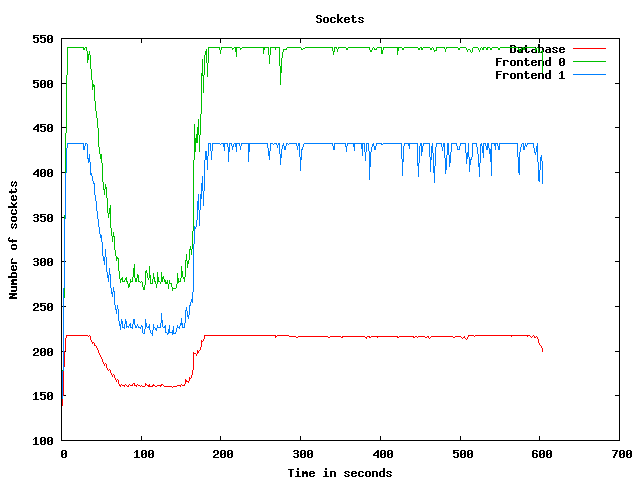
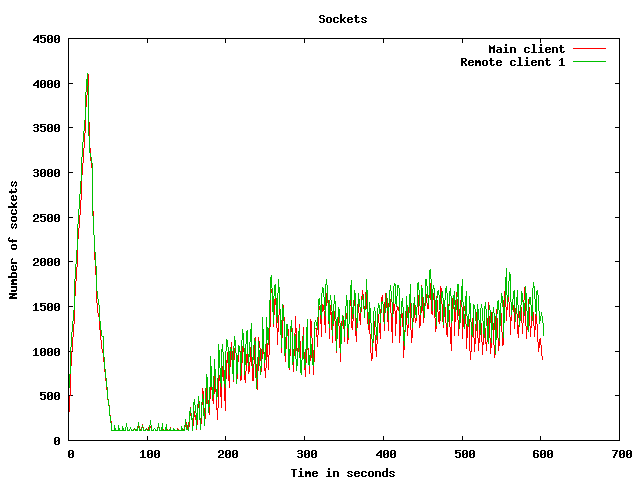
Network usage graphs
| Test start | 2009-3-19 17:50:29 |
| Up ramp start | 2009-3-19 17:50:57 |
| Runtime session start | 2009-3-19 17:52:57 |
| Down ramp start | 2009-3-19 18:0:27 |
| Test end | 2009-3-19 18:3:2 |
| Up ramp length | 2 minutes 1 millisecond (requested 120000 ms) |
| Runtime session length | 7 minutes 30 seconds 0 millisecond (requested 450000 ms) |
| Down ramp length | 30 seconds 0 millisecond (requested 30000 ms) |
| Total test length | 12 minutes 33 seconds 298 milliseconds |
| State name | % of total | Count | Errors | Minimum Time | Maximum Time | Average Time |
|---|---|---|---|---|---|---|
Home | 10 % | 6210 | 0 | 0 ms | 53549 ms | 6296 ms
|
Register | 1 % | 825 | 0 | 0 ms | 45345 ms | 1733 ms
|
RegisterUser | 1 % | 768 | 30 | 5 ms | 45014 ms | 901 ms
|
Browse | 9 % | 6077 | 0 | 0 ms | 45645 ms | 2084 ms
|
BrowseCategories | 6 % | 3966 | 0 | 3 ms | 45564 ms | 1509 ms
|
SearchItemsInCategory | 14 % | 9057 | 0 | 0 ms | 46104 ms | 1012 ms
|
BrowseRegions | 2 % | 1720 | 0 | 3 ms | 45500 ms | 1147 ms
|
BrowseCategoriesInRegion | 2 % | 1588 | 0 | 3 ms | 45370 ms | 1248 ms
|
SearchItemsInRegion | 4 % | 3061 | 0 | 0 ms | 45581 ms | 1036 ms
|
ViewItem | 12 % | 7489 | 0 | 3 ms | 45150 ms | 748 ms
|
ViewUserInfo | 2 % | 1316 | 0 | 3 ms | 45050 ms | 857 ms
|
ViewBidHistory | 1 % | 695 | 0 | 3 ms | 45162 ms | 756 ms
|
BuyNowAuth | 1 % | 660 | 0 | 2 ms | 45033 ms | 799 ms
|
BuyNow | 0 % | 586 | 85 | 4 ms | 45005 ms | 524 ms
|
StoreBuyBow | 0 % | 431 | 0 | 5 ms | 45012 ms | 792 ms
|
PutBidAuth | 4 % | 2629 | 0 | 0 ms | 45527 ms | 845 ms
|
PutBid | 4 % | 2566 | 347 | 1 ms | 45168 ms | 697 ms
|
StoreBid | 2 % | 1484 | 0 | 4 ms | 45016 ms | 617 ms
|
PutCommentAuth | 0 % | 0 | 0 | 0 ms | 0 ms | 0 ms
|
PutComment | 0 % | 204 | 22 | 5 ms | 31088 ms | 1342 ms
|
StoreComment | 0 % | 161 | 0 | 5 ms | 21021 ms | 544 ms
|
Sell | 0 % | 410 | 0 | 0 ms | 45326 ms | 1723 ms
|
SelectCategoryToSellItem | 0 % | 375 | 0 | 4 ms | 45021 ms | 1366 ms
|
SellItemForm | 0 % | 345 | 0 | 2 ms | 45006 ms | 1270 ms
|
RegisterItem | 0 % | 320 | 0 | 4 ms | 45009 ms | 843 ms
|
AboutMe (auth form) | 2 % | 1374 | 0 | 0 ms | 45532 ms | 1795 ms
|
AboutMe | 2 % | 1832 | 0 | 4 ms | 45713 ms | 1075 ms
|
Back probability | 7 % | 4555 | 0 | 0 ms | 0 ms | 0 ms
|
End of Session | 0 % | 613 | 0 | 0 ms | 0 ms | 0 ms
|
Total | 100 % | 61317 | 484 | - | - | 1557 ms
|
Average throughput | 515 req/s
| |||||
Completed sessions | 557
| |||||
Total time | 32791 seconds
| |||||
Average session time | 58 seconds
| |||||
| State name | % of total | Count | Errors | Minimum Time | Maximum Time | Average Time |
|---|---|---|---|---|---|---|
Home | 4 % | 9453 | 0 | 0 ms | 190018 ms | 772 ms
|
Register | 1 % | 2273 | 0 | 0 ms | 190030 ms | 2001 ms
|
RegisterUser | 1 % | 2244 | 66 | 5 ms | 193724 ms | 2145 ms
|
Browse | 7 % | 15336 | 0 | 0 ms | 193382 ms | 2287 ms
|
BrowseCategories | 4 % | 10714 | 0 | 3 ms | 190401 ms | 2270 ms
|
SearchItemsInCategory | 15 % | 33763 | 0 | 0 ms | 214039 ms | 2582 ms
|
BrowseRegions | 2 % | 4465 | 0 | 3 ms | 190045 ms | 2191 ms
|
BrowseCategoriesInRegion | 2 % | 4416 | 0 | 3 ms | 213925 ms | 2219 ms
|
SearchItemsInRegion | 5 % | 10982 | 0 | 0 ms | 202340 ms | 2202 ms
|
ViewItem | 14 % | 30723 | 0 | 3 ms | 380012 ms | 2345 ms
|
ViewUserInfo | 3 % | 6964 | 0 | 3 ms | 202986 ms | 2345 ms
|
ViewBidHistory | 1 % | 3799 | 0 | 3 ms | 200965 ms | 2700 ms
|
BuyNowAuth | 1 % | 2832 | 0 | 2 ms | 193183 ms | 1848 ms
|
BuyNow | 1 % | 2779 | 378 | 5 ms | 190035 ms | 2022 ms
|
StoreBuyBow | 1 % | 2359 | 1 | 5 ms | 199880 ms | 2333 ms
|
PutBidAuth | 4 % | 10608 | 0 | 0 ms | 194138 ms | 2378 ms
|
PutBid | 5 % | 12233 | 1385 | 4 ms | 193475 ms | 2160 ms
|
StoreBid | 3 % | 7994 | 6 | 4 ms | 235665 ms | 2326 ms
|
PutCommentAuth | 0 % | 0 | 0 | 0 ms | 0 ms | 0 ms
|
PutComment | 0 % | 1054 | 93 | 5 ms | 190086 ms | 3001 ms
|
StoreComment | 0 % | 956 | 0 | 5 ms | 190021 ms | 2377 ms
|
Sell | 0 % | 1222 | 0 | 0 ms | 95772 ms | 1969 ms
|
SelectCategoryToSellItem | 0 % | 1204 | 0 | 5 ms | 190032 ms | 2929 ms
|
SellItemForm | 0 % | 1175 | 0 | 2 ms | 193423 ms | 1733 ms
|
RegisterItem | 0 % | 1151 | 0 | 5 ms | 193021 ms | 2517 ms
|
AboutMe (auth form) | 1 % | 3592 | 0 | 0 ms | 383687 ms | 2201 ms
|
AboutMe | 2 % | 6135 | 0 | 5 ms | 193448 ms | 2355 ms
|
Back probability | 10 % | 22700 | 0 | 0 ms | 0 ms | 0 ms
|
End of Session | 1 % | 3139 | 0 | 0 ms | 0 ms | 0 ms
|
Total | 100 % | 216265 | 1929 | - | - | 1975 ms
|
Average throughput | 484 req/s
| |||||
Completed sessions | 3137
| |||||
Total time | 847016 seconds
| |||||
Average session time | 270 seconds
| |||||
| State name | % of total | Count | Errors | Minimum Time | Maximum Time | Average Time |
|---|---|---|---|---|---|---|
Home | 4 % | 381 | 0 | 0 ms | 46895 ms | 1328 ms
|
Register | 1 % | 88 | 0 | 0 ms | 93002 ms | 2503 ms
|
RegisterUser | 1 % | 90 | 3 | 4 ms | 93006 ms | 4881 ms
|
Browse | 7 % | 646 | 0 | 0 ms | 190021 ms | 3974 ms
|
BrowseCategories | 5 % | 434 | 0 | 3 ms | 211007 ms | 4884 ms
|
SearchItemsInCategory | 15 % | 1346 | 0 | 3 ms | 211017 ms | 4746 ms
|
BrowseRegions | 2 % | 180 | 0 | 3 ms | 190006 ms | 4202 ms
|
BrowseCategoriesInRegion | 1 % | 163 | 0 | 3 ms | 211018 ms | 5307 ms
|
SearchItemsInRegion | 4 % | 393 | 0 | 0 ms | 190013 ms | 4148 ms
|
ViewItem | 13 % | 1209 | 0 | 3 ms | 238258 ms | 4077 ms
|
ViewUserInfo | 3 % | 280 | 0 | 3 ms | 401058 ms | 3241 ms
|
ViewBidHistory | 1 % | 159 | 0 | 4 ms | 93136 ms | 4092 ms
|
BuyNowAuth | 1 % | 108 | 0 | 2 ms | 190002 ms | 4318 ms
|
BuyNow | 1 % | 106 | 22 | 5 ms | 93065 ms | 2385 ms
|
StoreBuyBow | 1 % | 103 | 0 | 5 ms | 93007 ms | 3300 ms
|
PutBidAuth | 5 % | 438 | 0 | 0 ms | 189999 ms | 2811 ms
|
PutBid | 5 % | 490 | 51 | 5 ms | 238142 ms | 4737 ms
|
StoreBid | 3 % | 334 | 0 | 5 ms | 190043 ms | 5108 ms
|
PutCommentAuth | 0 % | 0 | 0 | 0 ms | 0 ms | 0 ms
|
PutComment | 0 % | 34 | 3 | 5 ms | 93011 ms | 3898 ms
|
StoreComment | 0 % | 27 | 0 | 5 ms | 93048 ms | 8827 ms
|
Sell | 0 % | 46 | 0 | 0 ms | 202682 ms | 9774 ms
|
SelectCategoryToSellItem | 0 % | 49 | 0 | 5 ms | 93005 ms | 3057 ms
|
SellItemForm | 0 % | 48 | 0 | 2 ms | 21007 ms | 1438 ms
|
RegisterItem | 0 % | 47 | 0 | 4 ms | 45010 ms | 2598 ms
|
AboutMe (auth form) | 1 % | 150 | 0 | 0 ms | 93002 ms | 3749 ms
|
AboutMe | 2 % | 248 | 0 | 12 ms | 190048 ms | 3044 ms
|
Back probability | 10 % | 910 | 0 | 0 ms | 0 ms | 0 ms
|
End of Session | 1 % | 136 | 0 | 0 ms | 0 ms | 0 ms
|
Total | 100 % | 8643 | 79 | - | - | 3528 ms
|
Average throughput | 290 req/s
| |||||
Completed sessions | 124
| |||||
Total time | 45525 seconds
| |||||
Average session time | 367 seconds
| |||||
| State name | % of total | Count | Errors | Minimum Time | Maximum Time | Average Time |
|---|---|---|---|---|---|---|
Home | 5 % | 16047 | 0 | 0 ms | 190018 ms | 2952 ms
|
Register | 1 % | 3192 | 0 | 0 ms | 190030 ms | 2174 ms
|
RegisterUser | 1 % | 3111 | 99 | 4 ms | 193724 ms | 2046 ms
|
Browse | 7 % | 22083 | 0 | 0 ms | 283021 ms | 2488 ms
|
BrowseCategories | 5 % | 15142 | 0 | 3 ms | 283035 ms | 2354 ms
|
SearchItemsInCategory | 15 % | 44415 | 0 | 0 ms | 283012 ms | 2463 ms
|
BrowseRegions | 2 % | 6375 | 0 | 3 ms | 190045 ms | 2021 ms
|
BrowseCategoriesInRegion | 2 % | 6171 | 0 | 3 ms | 213925 ms | 2117 ms
|
SearchItemsInRegion | 5 % | 14503 | 0 | 0 ms | 283026 ms | 2173 ms
|
ViewItem | 13 % | 39546 | 0 | 3 ms | 380012 ms | 2200 ms
|
ViewUserInfo | 2 % | 8595 | 0 | 3 ms | 401058 ms | 2239 ms
|
ViewBidHistory | 1 % | 4681 | 0 | 3 ms | 200965 ms | 2612 ms
|
BuyNowAuth | 1 % | 3602 | 0 | 2 ms | 193183 ms | 1977 ms
|
BuyNow | 1 % | 3476 | 485 | 4 ms | 190035 ms | 1871 ms
|
StoreBuyBow | 1 % | 2897 | 1 | 5 ms | 199880 ms | 2375 ms
|
PutBidAuth | 4 % | 13698 | 0 | 0 ms | 283025 ms | 2271 ms
|
PutBid | 5 % | 15364 | 1786 | 1 ms | 238142 ms | 2182 ms
|
StoreBid | 3 % | 9832 | 6 | 4 ms | 235665 ms | 2391 ms
|
PutCommentAuth | 0 % | 0 | 0 | 0 ms | 0 ms | 0 ms
|
PutComment | 0 % | 1293 | 118 | 5 ms | 190086 ms | 2832 ms
|
StoreComment | 0 % | 1145 | 0 | 5 ms | 190021 ms | 2269 ms
|
Sell | 0 % | 1680 | 0 | 0 ms | 202682 ms | 2120 ms
|
SelectCategoryToSellItem | 0 % | 1628 | 0 | 4 ms | 190032 ms | 2687 ms
|
SellItemForm | 0 % | 1570 | 0 | 2 ms | 193423 ms | 1797 ms
|
RegisterItem | 0 % | 1521 | 0 | 4 ms | 193021 ms | 2407 ms
|
AboutMe (auth form) | 1 % | 5121 | 0 | 0 ms | 383687 ms | 2318 ms
|
AboutMe | 2 % | 8292 | 0 | 4 ms | 193448 ms | 2161 ms
|
Back probability | 9 % | 28205 | 0 | 0 ms | 0 ms | 0 ms
|
End of Session | 1 % | 3902 | 0 | 0 ms | 0 ms | 0 ms
|
Total | 100 % | 287087 | 2495 | - | - | 2057 ms
|
Average throughput | 482 req/s
| |||||
Completed sessions | 3902
| |||||
Total time | 964537 seconds
| |||||
Average session time | 247 seconds
| |||||
An error occured while waiting for remote processes termination (Skipping waits)
Command is: /usr/bin/scp farm6.csail.mit.edu:/tmp/client1 /home/drkp/sandbox/txcache/src/RUBiS-1.4.3/bench/2009-3-19@17:50:29//client1.bin
Command is: /usr/bin/ssh -x localhost /bin/bash -c 'LANG=en_GB.UTF-8 /usr/bin/sar -n DEV -n SOCK -rubcw 1 605 -f /home/drkp/sandbox/txcache/src/RUBiS-1.4.3/bench/2009-3-19@17:50:29//client1.bin > /home/drkp/sandbox/txcache/src/RUBiS-1.4.3/bench/2009-3-19@17:50:29//client1'
Command is: /usr/bin/scp farm14:/tmp/db_server0 /home/drkp/sandbox/txcache/src/RUBiS-1.4.3/bench/2009-3-19@17:50:29//db_server0.bin
Command is: /usr/bin/ssh -x localhost /bin/bash -c 'LANG=en_GB.UTF-8 /usr/bin/sar -n DEV -n SOCK -rubcw 1 605 -f /home/drkp/sandbox/txcache/src/RUBiS-1.4.3/bench/2009-3-19@17:50:29//db_server0.bin > /home/drkp/sandbox/txcache/src/RUBiS-1.4.3/bench/2009-3-19@17:50:29//db_server0'
Command is: /usr/bin/scp farm12.csail.mit.edu:/tmp/web_server0 /home/drkp/sandbox/txcache/src/RUBiS-1.4.3/bench/2009-3-19@17:50:29//web_server0.bin
Command is: /usr/bin/ssh -x localhost /bin/bash -c 'LANG=en_GB.UTF-8 /usr/bin/sar -n DEV -n SOCK -rubcw 1 605 -f /home/drkp/sandbox/txcache/src/RUBiS-1.4.3/bench/2009-3-19@17:50:29//web_server0.bin > /home/drkp/sandbox/txcache/src/RUBiS-1.4.3/bench/2009-3-19@17:50:29//web_server0'
Command is: /usr/bin/scp farm13.csail.mit.edu:/tmp/web_server1 /home/drkp/sandbox/txcache/src/RUBiS-1.4.3/bench/2009-3-19@17:50:29//web_server1.bin
Command is: /usr/bin/ssh -x localhost /bin/bash -c 'LANG=en_GB.UTF-8 /usr/bin/sar -n DEV -n SOCK -rubcw 1 605 -f /home/drkp/sandbox/txcache/src/RUBiS-1.4.3/bench/2009-3-19@17:50:29//web_server1.bin > /home/drkp/sandbox/txcache/src/RUBiS-1.4.3/bench/2009-3-19@17:50:29//web_server1'
Command is: /usr/bin/scp localhost:/tmp/client0 /home/drkp/sandbox/txcache/src/RUBiS-1.4.3/bench/2009-3-19@17:50:29//client0.bin
Command is: /usr/bin/ssh -x localhost /bin/bash -c 'LANG=en_GB.UTF-8 /usr/bin/sar -n DEV -n SOCK -rubcw 1 605 -f /home/drkp/sandbox/txcache/src/RUBiS-1.4.3/bench/2009-3-19@17:50:29//client0.bin > /home/drkp/sandbox/txcache/src/RUBiS-1.4.3/bench/2009-3-19@17:50:29//client0'
Command is: /usr/bin/scp farm6.csail.mit.edu:/tmp/trace_client1.html /home/drkp/sandbox/txcache/src/RUBiS-1.4.3/bench/2009-3-19@17:50:29//
Command is: /usr/bin/scp farm6.csail.mit.edu:/tmp/stat_client1.html /home/drkp/sandbox/txcache/src/RUBiS-1.4.3/bench/2009-3-19@17:50:29//
|
|
|
|
|
|
 | 
|
 | 
|
 | 
|
 | 
|
 | 
|
 | 
|
 | 
|
 | 
|
 | 
|