Node information
Test timing information
Up ramp statistics
Runtime session statistics
Down ramp statistics
Overall statistics
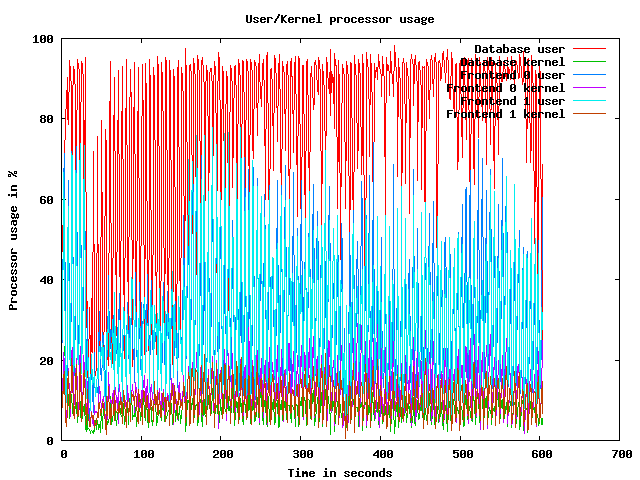
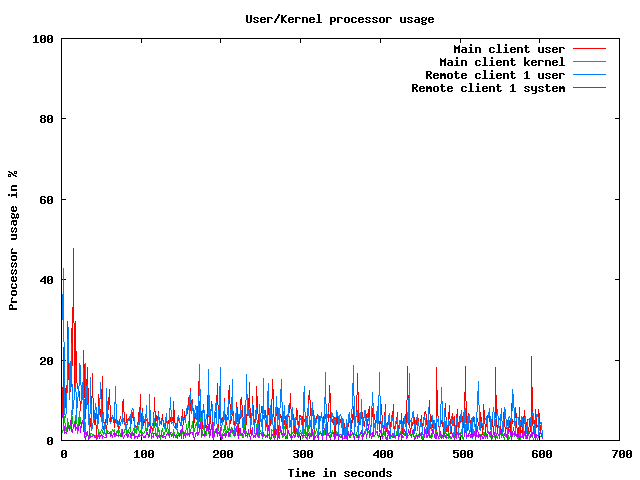
CPU usage graphs
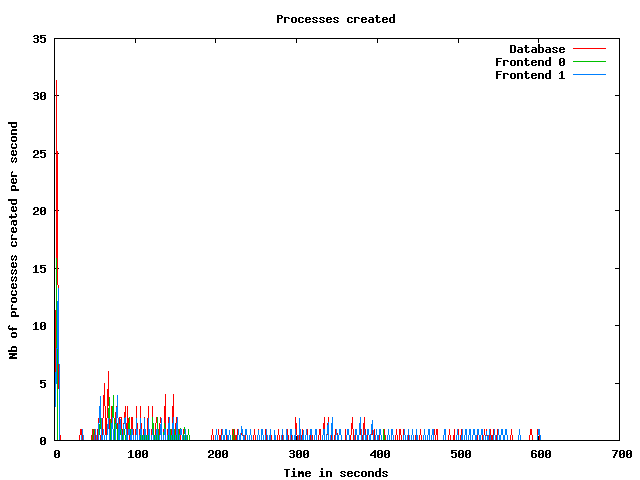
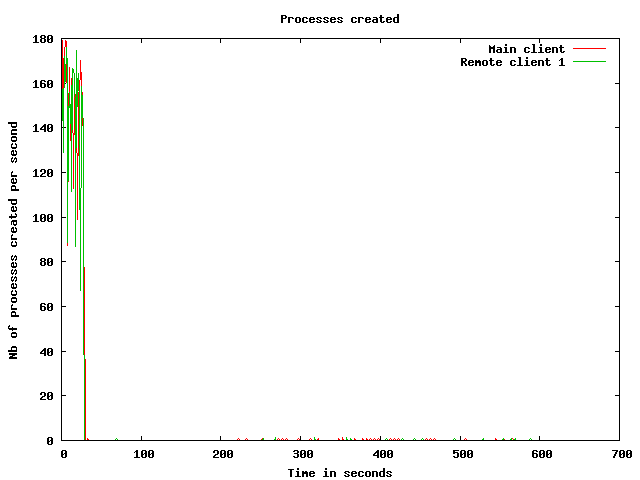
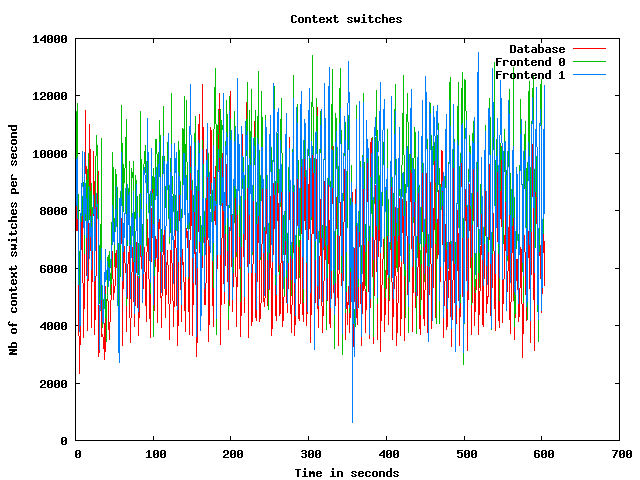
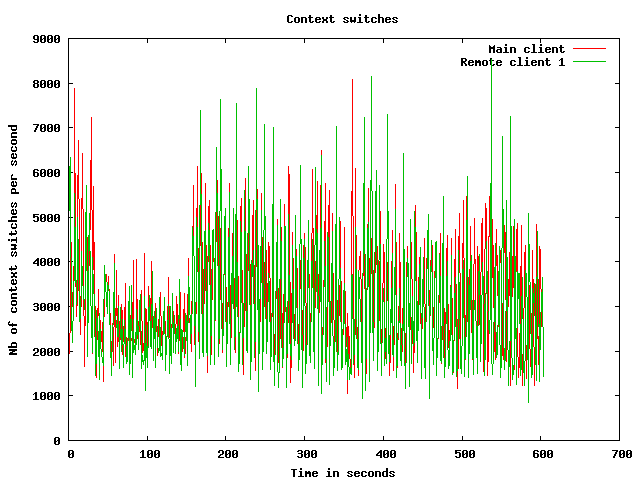
Processes usage graphs
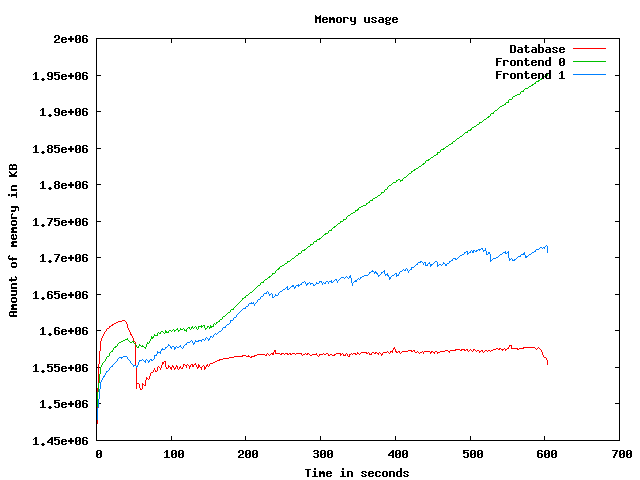
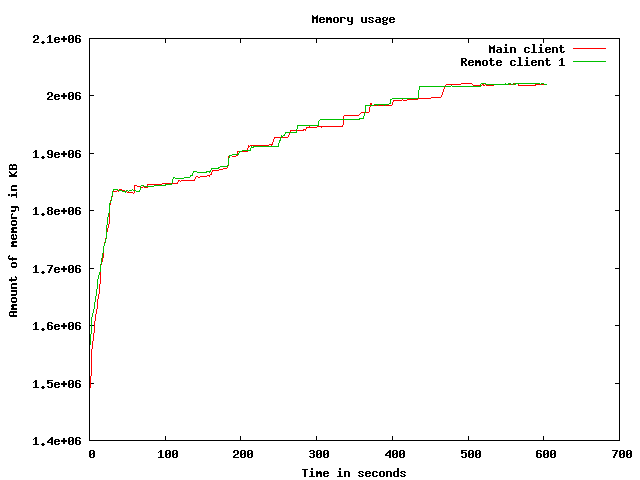
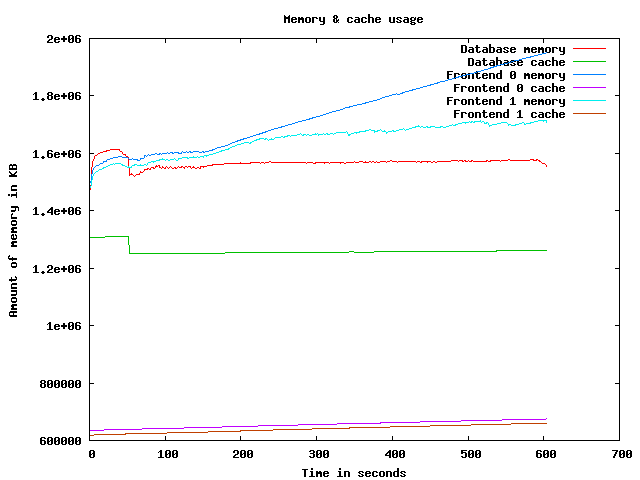
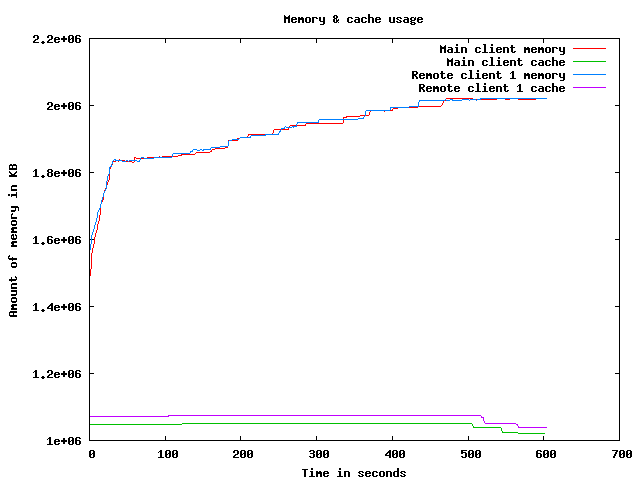
Memory usage graph
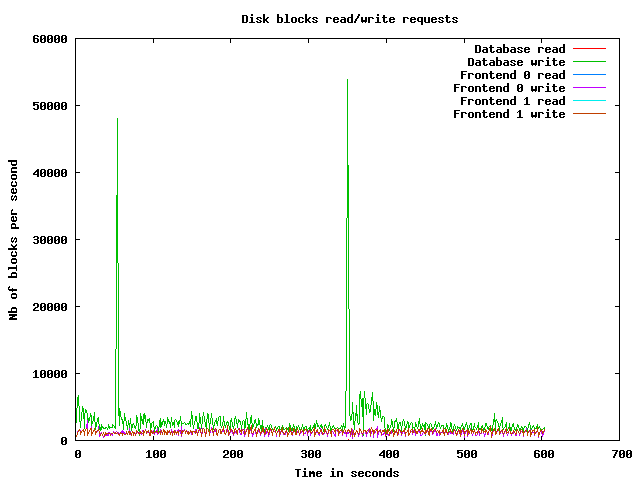
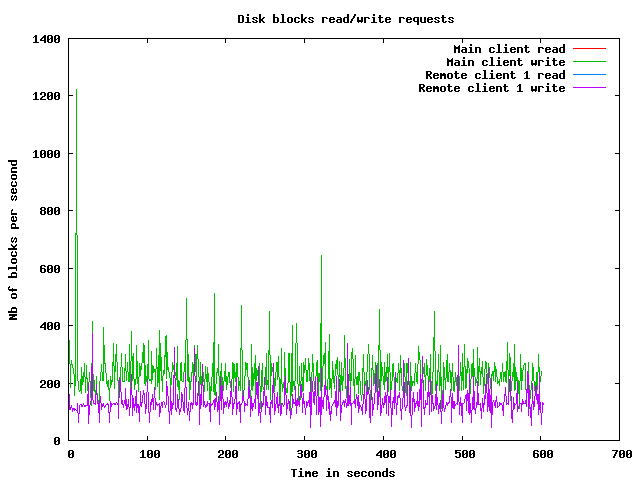
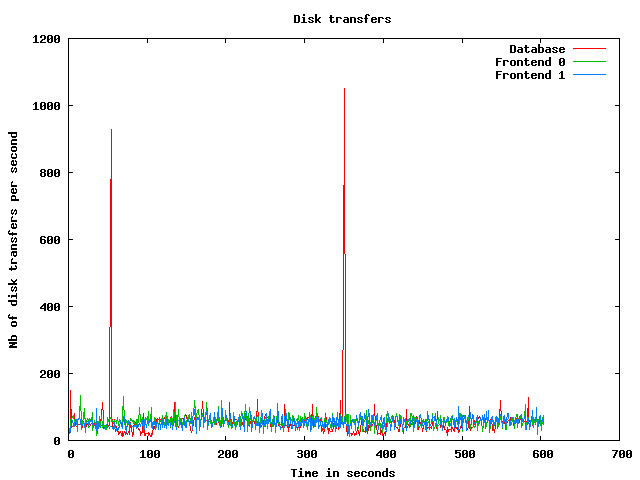
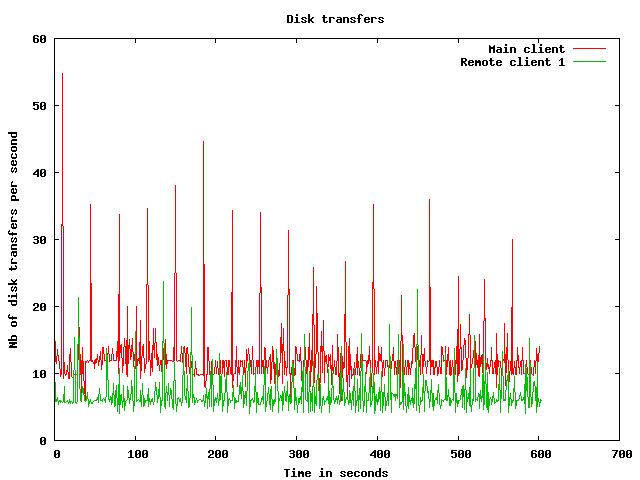
Disk usage graphs
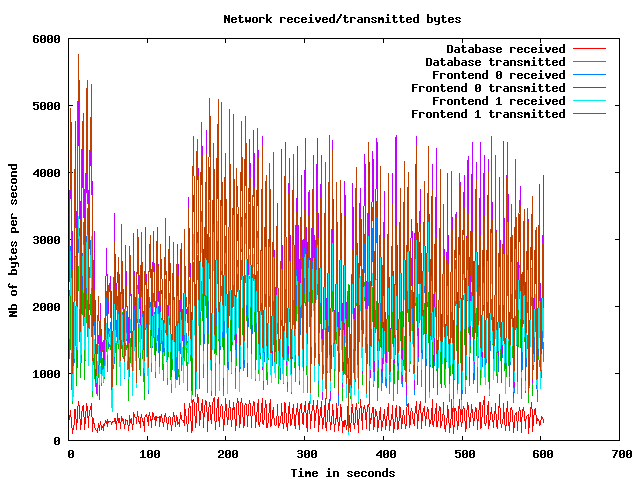
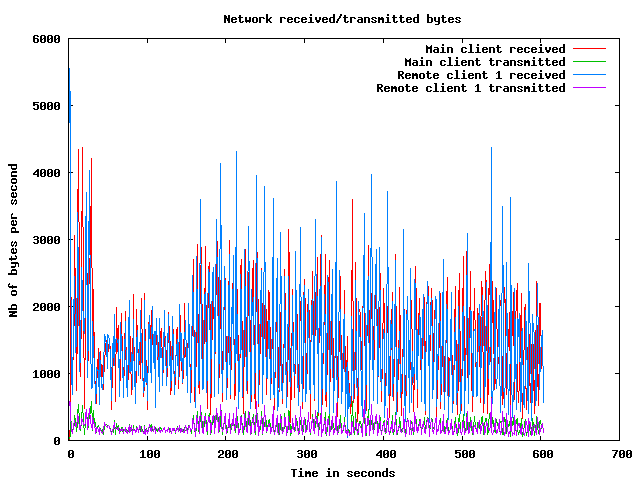
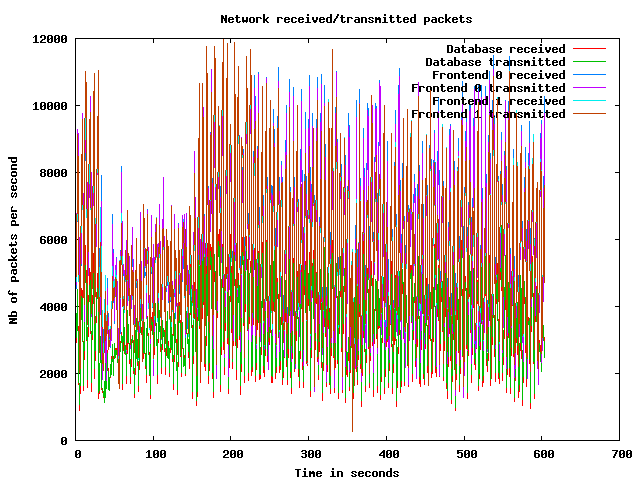
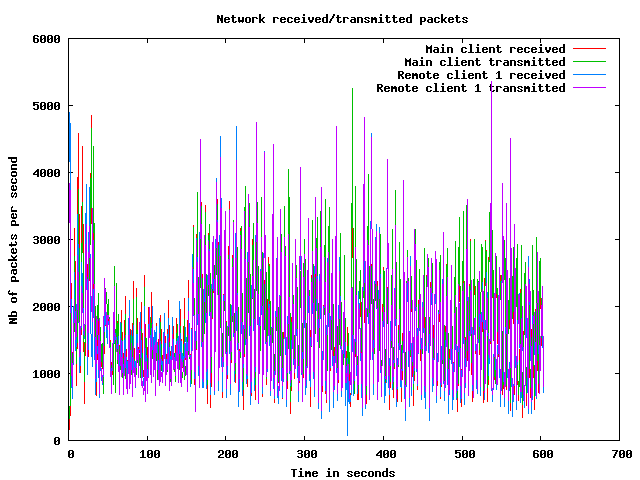
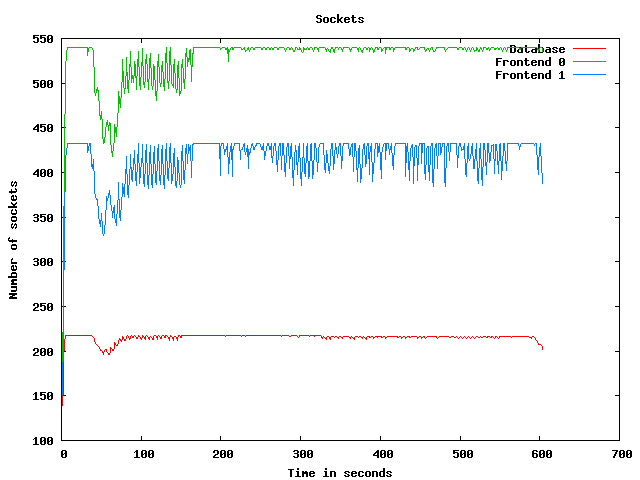
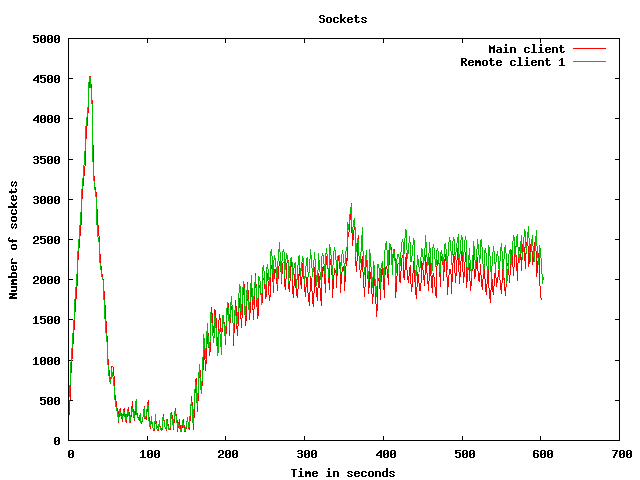
Network usage graphs
| Test start | 2009-3-19 18:3:49 |
| Up ramp start | 2009-3-19 18:4:21 |
| Runtime session start | 2009-3-19 18:6:21 |
| Down ramp start | 2009-3-19 18:13:51 |
| Test end | 2009-3-19 18:16:39 |
| Up ramp length | 2 minutes 1 millisecond (requested 120000 ms) |
| Runtime session length | 7 minutes 30 seconds 0 millisecond (requested 450000 ms) |
| Down ramp length | 30 seconds 1 millisecond (requested 30000 ms) |
| Total test length | 12 minutes 49 seconds 976 milliseconds |
| State name | % of total | Count | Errors | Minimum Time | Maximum Time | Average Time |
|---|---|---|---|---|---|---|
Home | 10 % | 6744 | 0 | 0 ms | 93047 ms | 7989 ms
|
Register | 1 % | 872 | 0 | 0 ms | 92996 ms | 2779 ms
|
RegisterUser | 1 % | 804 | 36 | 5 ms | 46815 ms | 1438 ms
|
Browse | 10 % | 6586 | 0 | 0 ms | 93011 ms | 2732 ms
|
BrowseCategories | 6 % | 4346 | 0 | 3 ms | 93059 ms | 1743 ms
|
SearchItemsInCategory | 14 % | 9766 | 0 | 0 ms | 93066 ms | 1522 ms
|
BrowseRegions | 2 % | 1846 | 0 | 3 ms | 93063 ms | 1720 ms
|
BrowseCategoriesInRegion | 2 % | 1740 | 0 | 3 ms | 93018 ms | 1467 ms
|
SearchItemsInRegion | 5 % | 3323 | 0 | 0 ms | 93011 ms | 1380 ms
|
ViewItem | 12 % | 8082 | 0 | 3 ms | 93057 ms | 1217 ms
|
ViewUserInfo | 2 % | 1406 | 0 | 4 ms | 45118 ms | 968 ms
|
ViewBidHistory | 1 % | 707 | 0 | 4 ms | 45419 ms | 1099 ms
|
BuyNowAuth | 1 % | 696 | 0 | 2 ms | 45311 ms | 1136 ms
|
BuyNow | 0 % | 608 | 79 | 5 ms | 45020 ms | 876 ms
|
StoreBuyBow | 0 % | 443 | 0 | 5 ms | 45045 ms | 1441 ms
|
PutBidAuth | 4 % | 2792 | 0 | 0 ms | 92999 ms | 1185 ms
|
PutBid | 4 % | 2656 | 349 | 4 ms | 93022 ms | 1068 ms
|
StoreBid | 2 % | 1503 | 2 | 5 ms | 56097 ms | 1256 ms
|
PutCommentAuth | 0 % | 0 | 0 | 0 ms | 0 ms | 0 ms
|
PutComment | 0 % | 224 | 26 | 4 ms | 45017 ms | 896 ms
|
StoreComment | 0 % | 167 | 0 | 5 ms | 22015 ms | 918 ms
|
Sell | 0 % | 453 | 0 | 0 ms | 93001 ms | 3034 ms
|
SelectCategoryToSellItem | 0 % | 417 | 0 | 4 ms | 45012 ms | 1501 ms
|
SellItemForm | 0 % | 375 | 0 | 2 ms | 45014 ms | 1091 ms
|
RegisterItem | 0 % | 353 | 0 | 5 ms | 46060 ms | 2276 ms
|
AboutMe (auth form) | 2 % | 1373 | 0 | 0 ms | 93005 ms | 2647 ms
|
AboutMe | 2 % | 1833 | 0 | 4 ms | 93060 ms | 2063 ms
|
Back probability | 7 % | 4918 | 0 | 0 ms | 0 ms | 0 ms
|
End of Session | 0 % | 629 | 0 | 0 ms | 0 ms | 0 ms
|
Total | 100 % | 65662 | 492 | - | - | 2134 ms
|
Average throughput | 551 req/s
| |||||
Completed sessions | 557
| |||||
Total time | 35077 seconds
| |||||
Average session time | 62 seconds
| |||||
| State name | % of total | Count | Errors | Minimum Time | Maximum Time | Average Time |
|---|---|---|---|---|---|---|
Home | 4 % | 8533 | 0 | 0 ms | 283568 ms | 1603 ms
|
Register | 1 % | 1986 | 0 | 0 ms | 199295 ms | 3340 ms
|
RegisterUser | 1 % | 1956 | 62 | 5 ms | 238831 ms | 3102 ms
|
Browse | 7 % | 13719 | 0 | 0 ms | 248860 ms | 3515 ms
|
BrowseCategories | 4 % | 9542 | 0 | 3 ms | 286609 ms | 3923 ms
|
SearchItemsInCategory | 15 % | 30051 | 0 | 0 ms | 380346 ms | 4331 ms
|
BrowseRegions | 2 % | 3996 | 0 | 3 ms | 380321 ms | 4163 ms
|
BrowseCategoriesInRegion | 2 % | 3905 | 0 | 3 ms | 235531 ms | 4293 ms
|
SearchItemsInRegion | 5 % | 9916 | 0 | 0 ms | 286611 ms | 4405 ms
|
ViewItem | 14 % | 27692 | 0 | 3 ms | 380647 ms | 4045 ms
|
ViewUserInfo | 3 % | 6259 | 0 | 3 ms | 380019 ms | 3914 ms
|
ViewBidHistory | 1 % | 3187 | 0 | 3 ms | 382901 ms | 4175 ms
|
BuyNowAuth | 1 % | 2657 | 0 | 2 ms | 286013 ms | 3955 ms
|
BuyNow | 1 % | 2613 | 345 | 6 ms | 380083 ms | 3805 ms
|
StoreBuyBow | 1 % | 2242 | 1 | 5 ms | 199861 ms | 3781 ms
|
PutBidAuth | 4 % | 9539 | 0 | 0 ms | 380001 ms | 4041 ms
|
PutBid | 5 % | 10967 | 1269 | 5 ms | 283595 ms | 4067 ms
|
StoreBid | 3 % | 7275 | 7 | 5 ms | 305911 ms | 4240 ms
|
PutCommentAuth | 0 % | 0 | 0 | 0 ms | 0 ms | 0 ms
|
PutComment | 0 % | 912 | 64 | 5 ms | 283737 ms | 4214 ms
|
StoreComment | 0 % | 839 | 0 | 5 ms | 194031 ms | 4280 ms
|
Sell | 0 % | 1117 | 0 | 0 ms | 193994 ms | 4509 ms
|
SelectCategoryToSellItem | 0 % | 1093 | 0 | 5 ms | 203586 ms | 3555 ms
|
SellItemForm | 0 % | 1073 | 0 | 2 ms | 193455 ms | 2580 ms
|
RegisterItem | 0 % | 1047 | 0 | 5 ms | 221027 ms | 3808 ms
|
AboutMe (auth form) | 1 % | 3278 | 0 | 0 ms | 386011 ms | 4228 ms
|
AboutMe | 2 % | 5526 | 0 | 5 ms | 221054 ms | 3722 ms
|
Back probability | 10 % | 20163 | 0 | 0 ms | 0 ms | 0 ms
|
End of Session | 1 % | 2817 | 0 | 0 ms | 0 ms | 0 ms
|
Total | 100 % | 193900 | 1748 | - | - | 3422 ms
|
Average throughput | 434 req/s
| |||||
Completed sessions | 2855
| |||||
Total time | 789560 seconds
| |||||
Average session time | 276 seconds
| |||||
| State name | % of total | Count | Errors | Minimum Time | Maximum Time | Average Time |
|---|---|---|---|---|---|---|
Home | 4 % | 357 | 0 | 0 ms | 235055 ms | 2701 ms
|
Register | 0 % | 75 | 0 | 0 ms | 190003 ms | 10908 ms
|
RegisterUser | 0 % | 85 | 4 | 4 ms | 211060 ms | 10531 ms
|
Browse | 6 % | 611 | 0 | 0 ms | 235092 ms | 11433 ms
|
BrowseCategories | 5 % | 439 | 0 | 3 ms | 235094 ms | 10088 ms
|
SearchItemsInCategory | 14 % | 1288 | 0 | 3 ms | 425234 ms | 14054 ms
|
BrowseRegions | 2 % | 178 | 0 | 3 ms | 235103 ms | 12840 ms
|
BrowseCategoriesInRegion | 2 % | 185 | 0 | 3 ms | 248914 ms | 7729 ms
|
SearchItemsInRegion | 5 % | 478 | 0 | 0 ms | 401376 ms | 13938 ms
|
ViewItem | 14 % | 1253 | 0 | 3 ms | 425355 ms | 13382 ms
|
ViewUserInfo | 3 % | 294 | 0 | 3 ms | 425000 ms | 15941 ms
|
ViewBidHistory | 1 % | 136 | 0 | 4 ms | 190241 ms | 12772 ms
|
BuyNowAuth | 1 % | 104 | 0 | 2 ms | 235083 ms | 18825 ms
|
BuyNow | 1 % | 103 | 17 | 6 ms | 190022 ms | 10427 ms
|
StoreBuyBow | 0 % | 79 | 0 | 5 ms | 211012 ms | 11692 ms
|
PutBidAuth | 5 % | 485 | 0 | 0 ms | 211035 ms | 10916 ms
|
PutBid | 5 % | 514 | 53 | 5 ms | 401385 ms | 12156 ms
|
StoreBid | 3 % | 337 | 0 | 5 ms | 235095 ms | 10368 ms
|
PutCommentAuth | 0 % | 0 | 0 | 0 ms | 0 ms | 0 ms
|
PutComment | 0 % | 42 | 4 | 5 ms | 45070 ms | 2457 ms
|
StoreComment | 0 % | 34 | 0 | 4 ms | 93019 ms | 9236 ms
|
Sell | 0 % | 59 | 0 | 0 ms | 235053 ms | 18829 ms
|
SelectCategoryToSellItem | 0 % | 47 | 0 | 5 ms | 190058 ms | 12979 ms
|
SellItemForm | 0 % | 56 | 0 | 3 ms | 189999 ms | 8559 ms
|
RegisterItem | 0 % | 45 | 0 | 4 ms | 401300 ms | 21462 ms
|
AboutMe (auth form) | 1 % | 136 | 0 | 0 ms | 211027 ms | 9455 ms
|
AboutMe | 2 % | 242 | 0 | 15 ms | 211123 ms | 8808 ms
|
Back probability | 10 % | 923 | 0 | 0 ms | 0 ms | 0 ms
|
End of Session | 1 % | 144 | 0 | 0 ms | 0 ms | 0 ms
|
Total | 100 % | 8729 | 78 | - | - | 10418 ms
|
Average throughput | 293 req/s
| |||||
Completed sessions | 106
| |||||
Total time | 42012 seconds
| |||||
Average session time | 396 seconds
| |||||
| State name | % of total | Count | Errors | Minimum Time | Maximum Time | Average Time |
|---|---|---|---|---|---|---|
Home | 5 % | 15646 | 0 | 0 ms | 379998 ms | 4566 ms
|
Register | 1 % | 2939 | 0 | 0 ms | 199295 ms | 3617 ms
|
RegisterUser | 1 % | 2850 | 102 | 4 ms | 238831 ms | 3262 ms
|
Browse | 7 % | 20983 | 0 | 0 ms | 410948 ms | 3875 ms
|
BrowseCategories | 5 % | 14363 | 0 | 3 ms | 380013 ms | 3982 ms
|
SearchItemsInCategory | 15 % | 41419 | 0 | 0 ms | 425234 ms | 4438 ms
|
BrowseRegions | 2 % | 6039 | 0 | 3 ms | 380321 ms | 4058 ms
|
BrowseCategoriesInRegion | 2 % | 5845 | 0 | 3 ms | 248914 ms | 3809 ms
|
SearchItemsInRegion | 5 % | 13798 | 0 | 0 ms | 401376 ms | 4397 ms
|
ViewItem | 13 % | 37238 | 0 | 3 ms | 460150 ms | 4218 ms
|
ViewUserInfo | 2 % | 8020 | 0 | 3 ms | 425000 ms | 4233 ms
|
ViewBidHistory | 1 % | 4052 | 0 | 3 ms | 382901 ms | 4368 ms
|
BuyNowAuth | 1 % | 3467 | 0 | 2 ms | 286013 ms | 4505 ms
|
BuyNow | 1 % | 3340 | 443 | 5 ms | 380083 ms | 3883 ms
|
StoreBuyBow | 1 % | 2770 | 1 | 5 ms | 211012 ms | 3999 ms
|
PutBidAuth | 4 % | 12854 | 0 | 0 ms | 380001 ms | 4078 ms
|
PutBid | 5 % | 14213 | 1678 | 4 ms | 401385 ms | 4298 ms
|
StoreBid | 3 % | 9144 | 9 | 5 ms | 305911 ms | 4688 ms
|
PutCommentAuth | 0 % | 0 | 0 | 0 ms | 0 ms | 0 ms
|
PutComment | 0 % | 1182 | 95 | 4 ms | 283737 ms | 3905 ms
|
StoreComment | 0 % | 1043 | 0 | 4 ms | 228065 ms | 5020 ms
|
Sell | 0 % | 1636 | 0 | 0 ms | 235053 ms | 4941 ms
|
SelectCategoryToSellItem | 0 % | 1562 | 0 | 4 ms | 380009 ms | 3825 ms
|
SellItemForm | 0 % | 1508 | 0 | 2 ms | 380005 ms | 2926 ms
|
RegisterItem | 0 % | 1449 | 0 | 4 ms | 401300 ms | 4525 ms
|
AboutMe (auth form) | 1 % | 4803 | 0 | 0 ms | 386011 ms | 4262 ms
|
AboutMe | 2 % | 7671 | 0 | 4 ms | 380031 ms | 4089 ms
|
Back probability | 9 % | 26081 | 0 | 0 ms | 0 ms | 0 ms
|
End of Session | 1 % | 3604 | 0 | 0 ms | 0 ms | 0 ms
|
Total | 100 % | 269519 | 2328 | - | - | 3725 ms
|
Average throughput | 453 req/s
| |||||
Completed sessions | 3604
| |||||
Total time | 905034 seconds
| |||||
Average session time | 251 seconds
| |||||
An error occured while waiting for remote processes termination (Skipping waits)
Command is: /usr/bin/scp farm6.csail.mit.edu:/tmp/client1 /home/drkp/sandbox/txcache/src/RUBiS-1.4.3/bench/2009-3-19@18:3:49//client1.bin
Command is: /usr/bin/ssh -x localhost /bin/bash -c 'LANG=en_GB.UTF-8 /usr/bin/sar -n DEV -n SOCK -rubcw 1 605 -f /home/drkp/sandbox/txcache/src/RUBiS-1.4.3/bench/2009-3-19@18:3:49//client1.bin > /home/drkp/sandbox/txcache/src/RUBiS-1.4.3/bench/2009-3-19@18:3:49//client1'
Command is: /usr/bin/scp farm14:/tmp/db_server0 /home/drkp/sandbox/txcache/src/RUBiS-1.4.3/bench/2009-3-19@18:3:49//db_server0.bin
Command is: /usr/bin/ssh -x localhost /bin/bash -c 'LANG=en_GB.UTF-8 /usr/bin/sar -n DEV -n SOCK -rubcw 1 605 -f /home/drkp/sandbox/txcache/src/RUBiS-1.4.3/bench/2009-3-19@18:3:49//db_server0.bin > /home/drkp/sandbox/txcache/src/RUBiS-1.4.3/bench/2009-3-19@18:3:49//db_server0'
Command is: /usr/bin/scp farm12.csail.mit.edu:/tmp/web_server0 /home/drkp/sandbox/txcache/src/RUBiS-1.4.3/bench/2009-3-19@18:3:49//web_server0.bin
Command is: /usr/bin/ssh -x localhost /bin/bash -c 'LANG=en_GB.UTF-8 /usr/bin/sar -n DEV -n SOCK -rubcw 1 605 -f /home/drkp/sandbox/txcache/src/RUBiS-1.4.3/bench/2009-3-19@18:3:49//web_server0.bin > /home/drkp/sandbox/txcache/src/RUBiS-1.4.3/bench/2009-3-19@18:3:49//web_server0'
Command is: /usr/bin/scp farm13.csail.mit.edu:/tmp/web_server1 /home/drkp/sandbox/txcache/src/RUBiS-1.4.3/bench/2009-3-19@18:3:49//web_server1.bin
Command is: /usr/bin/ssh -x localhost /bin/bash -c 'LANG=en_GB.UTF-8 /usr/bin/sar -n DEV -n SOCK -rubcw 1 605 -f /home/drkp/sandbox/txcache/src/RUBiS-1.4.3/bench/2009-3-19@18:3:49//web_server1.bin > /home/drkp/sandbox/txcache/src/RUBiS-1.4.3/bench/2009-3-19@18:3:49//web_server1'
Command is: /usr/bin/scp localhost:/tmp/client0 /home/drkp/sandbox/txcache/src/RUBiS-1.4.3/bench/2009-3-19@18:3:49//client0.bin
Command is: /usr/bin/ssh -x localhost /bin/bash -c 'LANG=en_GB.UTF-8 /usr/bin/sar -n DEV -n SOCK -rubcw 1 605 -f /home/drkp/sandbox/txcache/src/RUBiS-1.4.3/bench/2009-3-19@18:3:49//client0.bin > /home/drkp/sandbox/txcache/src/RUBiS-1.4.3/bench/2009-3-19@18:3:49//client0'
Command is: /usr/bin/scp farm6.csail.mit.edu:/tmp/trace_client1.html /home/drkp/sandbox/txcache/src/RUBiS-1.4.3/bench/2009-3-19@18:3:49//
Command is: /usr/bin/scp farm6.csail.mit.edu:/tmp/stat_client1.html /home/drkp/sandbox/txcache/src/RUBiS-1.4.3/bench/2009-3-19@18:3:49//
|
|
|
|
|
|
 | 
|
 | 
|
 | 
|
 | 
|
 | 
|
 | 
|
 | 
|
 | 
|
 | 
|