Node information
Test timing information
Up ramp statistics
Runtime session statistics
Down ramp statistics
Overall statistics
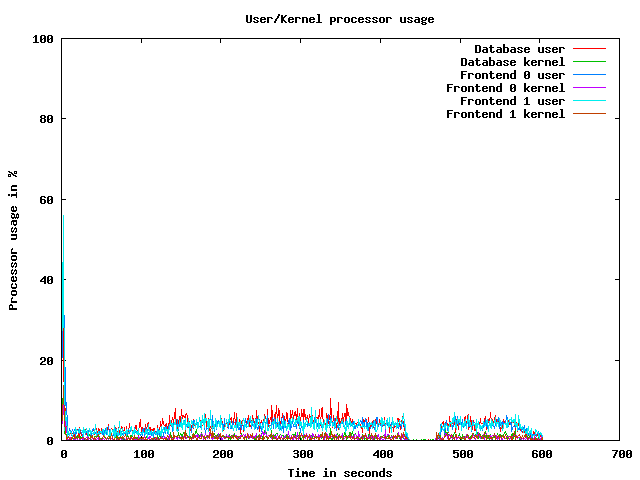
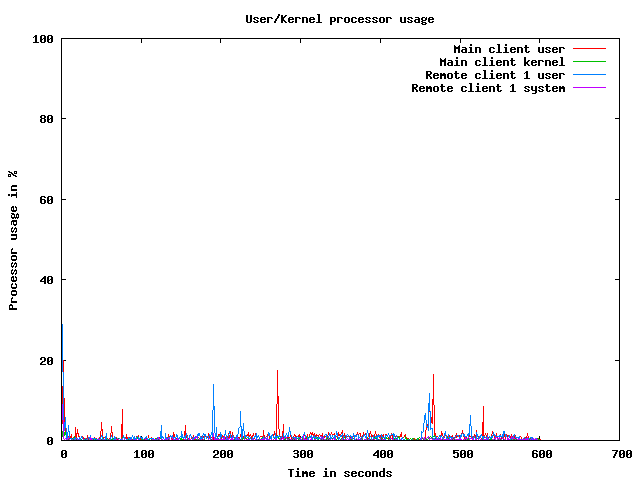
CPU usage graphs
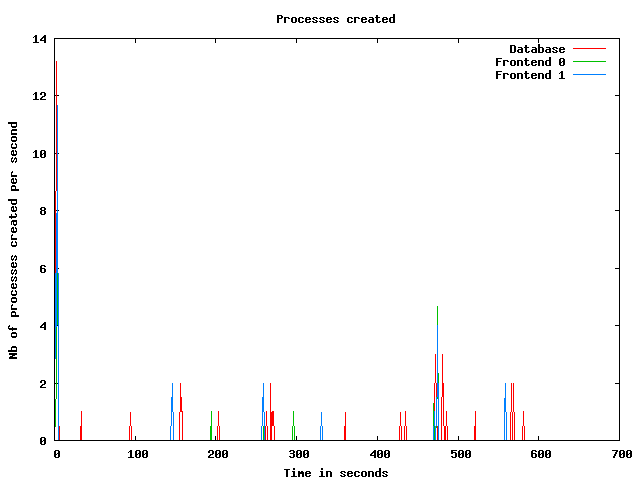
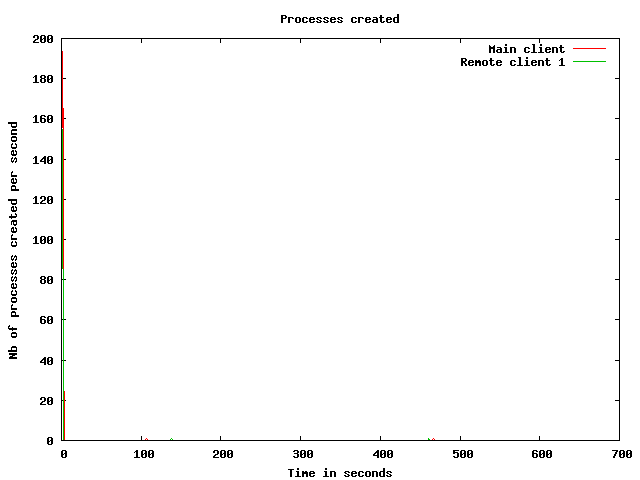
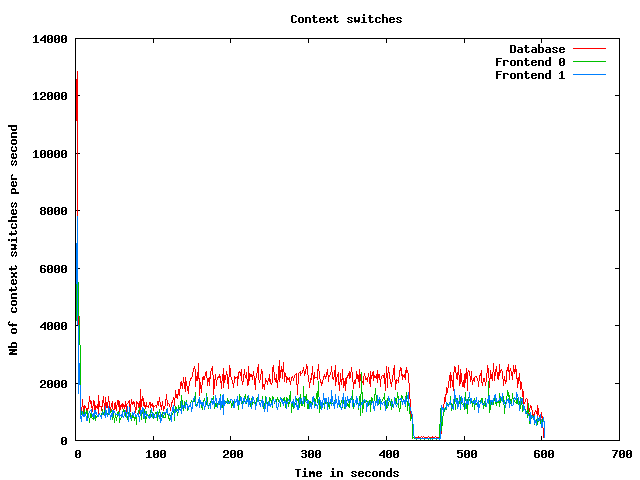
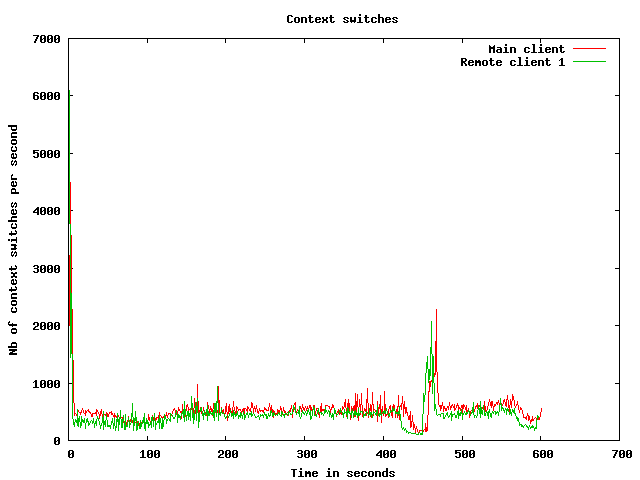
Processes usage graphs
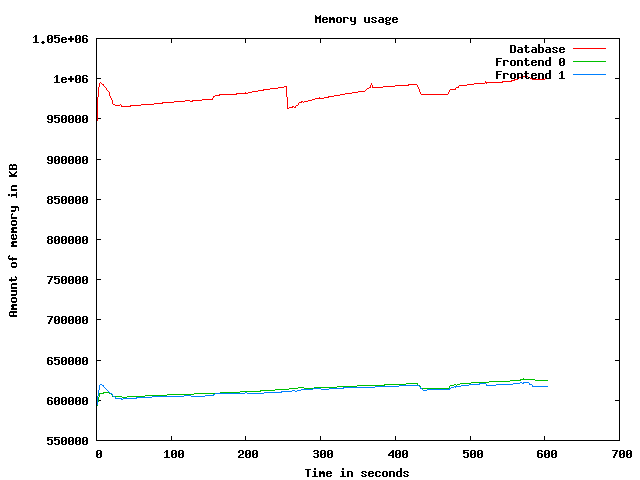
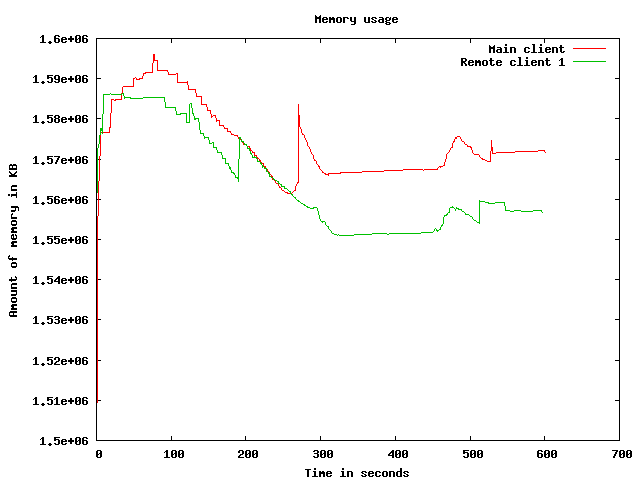
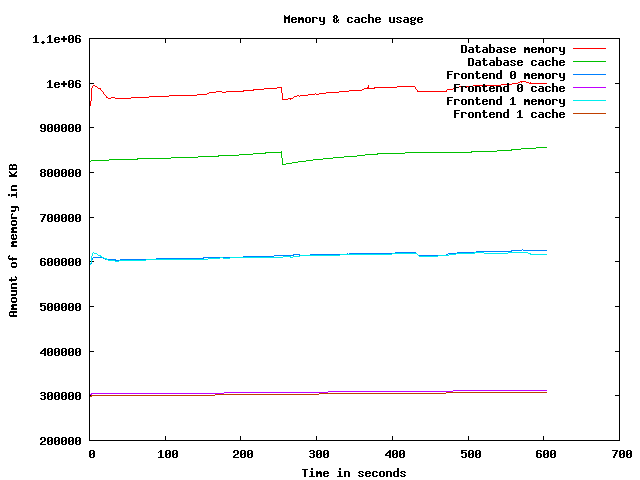
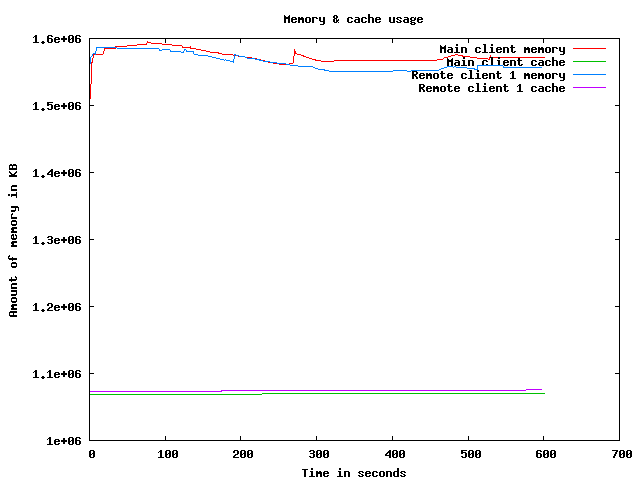
Memory usage graph
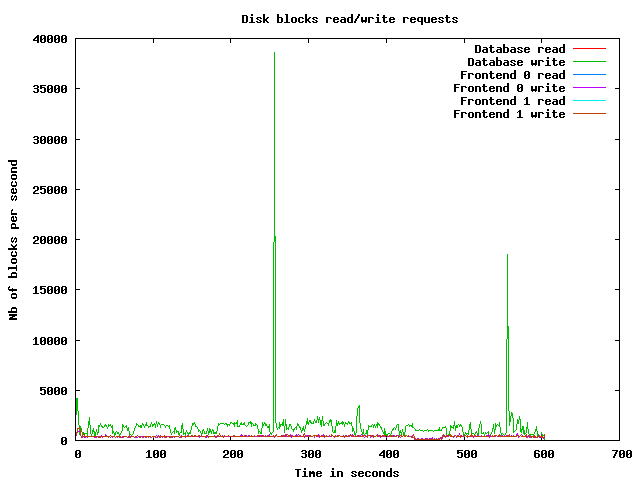
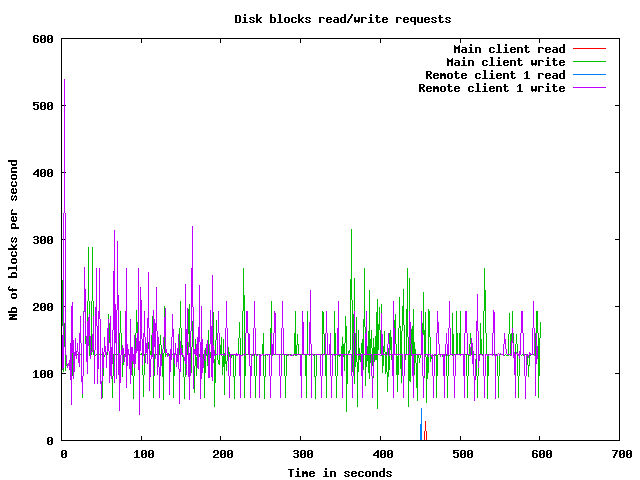
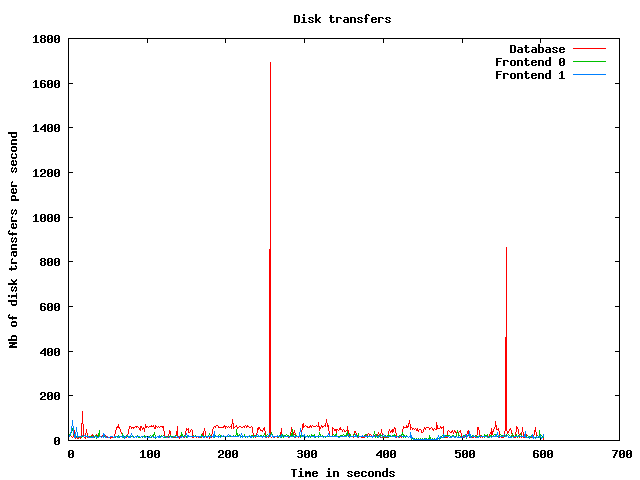
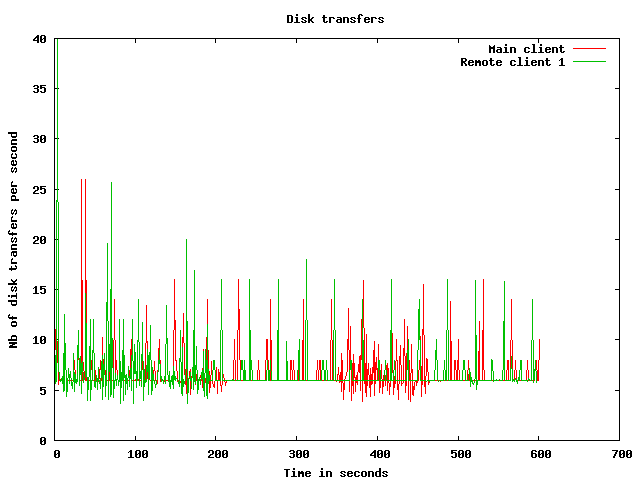
Disk usage graphs
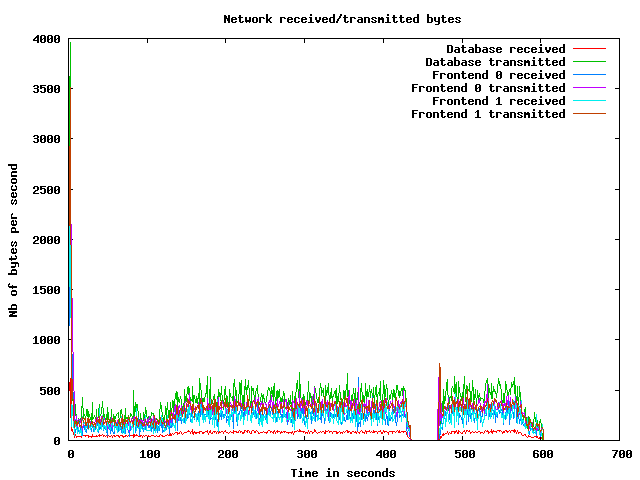
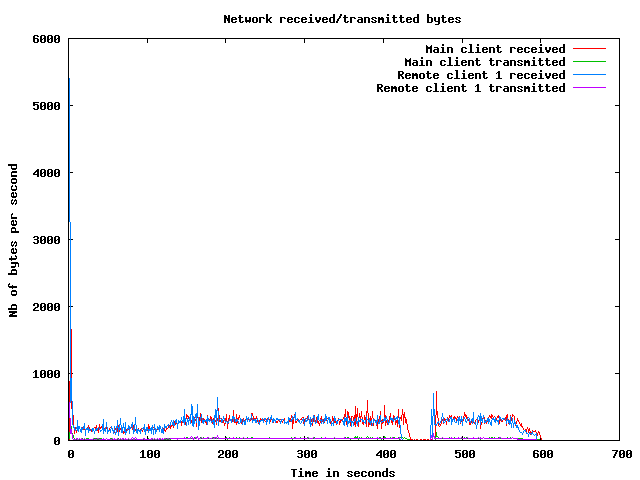
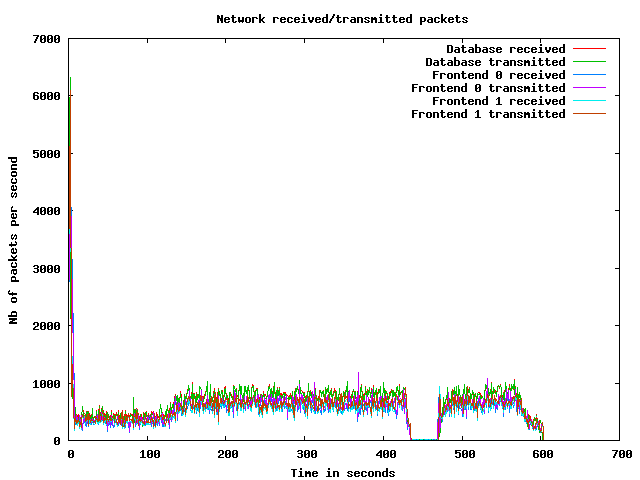
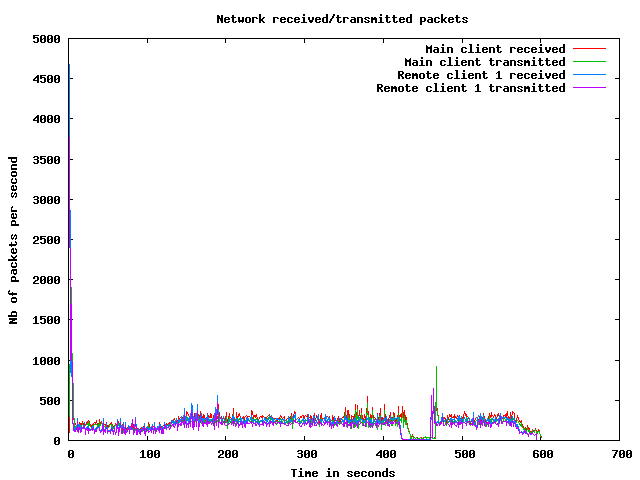
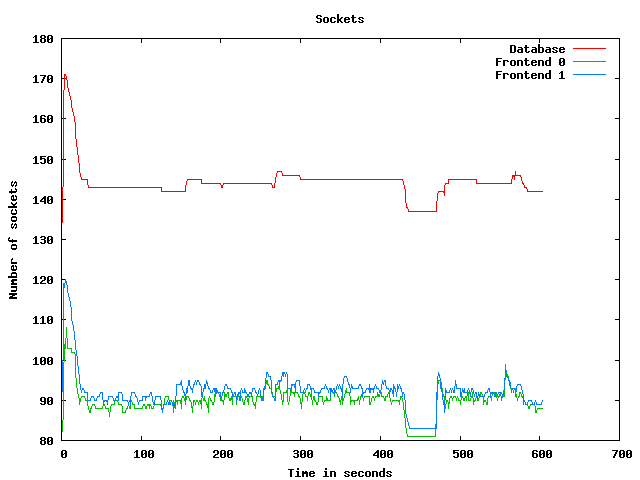
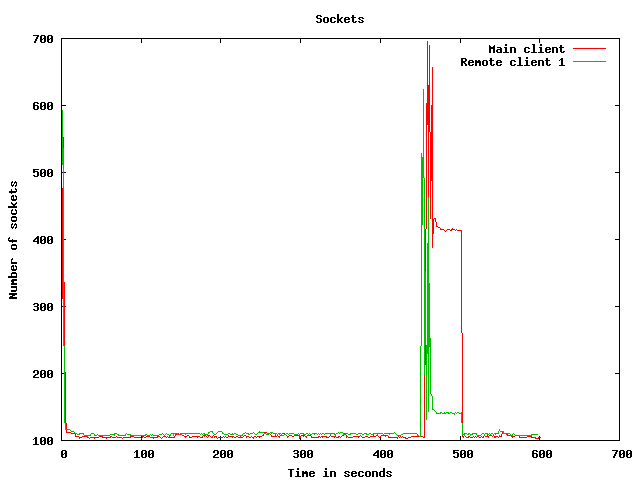
Network usage graphs
| Test start | 2009-3-19 19:2:36 |
| Up ramp start | 2009-3-19 19:2:41 |
| Runtime session start | 2009-3-19 19:4:41 |
| Down ramp start | 2009-3-19 19:12:11 |
| Test end | 2009-3-19 19:13:59 |
| Up ramp length | 2 minutes 1 millisecond (requested 120000 ms) |
| Runtime session length | 7 minutes 30 seconds 0 millisecond (requested 450000 ms) |
| Down ramp length | 30 seconds 0 millisecond (requested 30000 ms) |
| Total test length | 11 minutes 22 seconds 902 milliseconds |
| State name | % of total | Count | Errors | Minimum Time | Maximum Time | Average Time |
|---|---|---|---|---|---|---|
Home | 10 % | 754 | 0 | 0 ms | 3163 ms | 1290 ms
|
Register | 1 % | 106 | 0 | 0 ms | 3003 ms | 107 ms
|
RegisterUser | 1 % | 98 | 1 | 4 ms | 3015 ms | 131 ms
|
Browse | 10 % | 728 | 0 | 0 ms | 3034 ms | 103 ms
|
BrowseCategories | 6 % | 467 | 0 | 3 ms | 3046 ms | 96 ms
|
SearchItemsInCategory | 15 % | 1073 | 0 | 0 ms | 3034 ms | 65 ms
|
BrowseRegions | 2 % | 208 | 0 | 3 ms | 3008 ms | 99 ms
|
BrowseCategoriesInRegion | 2 % | 183 | 0 | 3 ms | 3009 ms | 40 ms
|
SearchItemsInRegion | 4 % | 348 | 0 | 0 ms | 3032 ms | 83 ms
|
ViewItem | 12 % | 858 | 0 | 4 ms | 3047 ms | 49 ms
|
ViewUserInfo | 1 % | 128 | 0 | 4 ms | 3013 ms | 54 ms
|
ViewBidHistory | 1 % | 77 | 0 | 4 ms | 100 ms | 12 ms
|
BuyNowAuth | 1 % | 74 | 0 | 2 ms | 3004 ms | 43 ms
|
BuyNow | 0 % | 67 | 14 | 4 ms | 3006 ms | 50 ms
|
StoreBuyBow | 0 % | 43 | 0 | 4 ms | 146 ms | 8 ms
|
PutBidAuth | 3 % | 283 | 0 | 0 ms | 3031 ms | 47 ms
|
PutBid | 3 % | 270 | 36 | 4 ms | 3001 ms | 28 ms
|
StoreBid | 2 % | 147 | 0 | 4 ms | 290 ms | 9 ms
|
PutCommentAuth | 0 % | 0 | 0 | 0 ms | 0 ms | 0 ms
|
PutComment | 0 % | 23 | 0 | 4 ms | 24 ms | 5 ms
|
StoreComment | 0 % | 18 | 0 | 5 ms | 24 ms | 7 ms
|
Sell | 0 % | 53 | 0 | 0 ms | 3033 ms | 120 ms
|
SelectCategoryToSellItem | 0 % | 52 | 0 | 4 ms | 27 ms | 6 ms
|
SellItemForm | 0 % | 51 | 0 | 2 ms | 6 ms | 3 ms
|
RegisterItem | 0 % | 49 | 0 | 4 ms | 3005 ms | 138 ms
|
AboutMe (auth form) | 2 % | 153 | 0 | 0 ms | 3006 ms | 130 ms
|
AboutMe | 3 % | 222 | 0 | 9 ms | 3053 ms | 61 ms
|
Back probability | 7 % | 515 | 0 | 0 ms | 0 ms | 0 ms
|
End of Session | 0 % | 53 | 0 | 0 ms | 0 ms | 0 ms
|
Total | 100 % | 7101 | 51 | - | - | 191 ms
|
Average throughput | 59 req/s
| |||||
Completed sessions | 45
| |||||
Total time | 2681 seconds
| |||||
Average session time | 59 seconds
| |||||
| State name | % of total | Count | Errors | Minimum Time | Maximum Time | Average Time |
|---|---|---|---|---|---|---|
Home | 6 % | 2395 | 0 | 0 ms | 33930 ms | 1215 ms
|
Register | 1 % | 399 | 0 | 0 ms | 32766 ms | 391 ms
|
RegisterUser | 1 % | 389 | 1 | 5 ms | 30538 ms | 400 ms
|
Browse | 7 % | 2722 | 0 | 0 ms | 34225 ms | 247 ms
|
BrowseCategories | 5 % | 1880 | 0 | 3 ms | 36873 ms | 514 ms
|
SearchItemsInCategory | 15 % | 5260 | 0 | 0 ms | 34089 ms | 424 ms
|
BrowseRegions | 2 % | 782 | 0 | 3 ms | 33221 ms | 295 ms
|
BrowseCategoriesInRegion | 2 % | 770 | 0 | 3 ms | 32420 ms | 322 ms
|
SearchItemsInRegion | 5 % | 1766 | 0 | 0 ms | 33690 ms | 353 ms
|
ViewItem | 13 % | 4741 | 0 | 4 ms | 34585 ms | 459 ms
|
ViewUserInfo | 2 % | 1023 | 0 | 3 ms | 32725 ms | 356 ms
|
ViewBidHistory | 1 % | 509 | 0 | 3 ms | 34350 ms | 624 ms
|
BuyNowAuth | 1 % | 435 | 0 | 2 ms | 33510 ms | 717 ms
|
BuyNow | 1 % | 418 | 65 | 4 ms | 33550 ms | 471 ms
|
StoreBuyBow | 0 % | 344 | 0 | 4 ms | 32911 ms | 451 ms
|
PutBidAuth | 4 % | 1613 | 0 | 0 ms | 38071 ms | 708 ms
|
PutBid | 5 % | 1784 | 217 | 4 ms | 33410 ms | 549 ms
|
StoreBid | 3 % | 1142 | 0 | 4 ms | 33082 ms | 385 ms
|
PutCommentAuth | 0 % | 0 | 0 | 0 ms | 0 ms | 0 ms
|
PutComment | 0 % | 159 | 15 | 4 ms | 33224 ms | 564 ms
|
StoreComment | 0 % | 137 | 0 | 4 ms | 32157 ms | 243 ms
|
Sell | 0 % | 194 | 0 | 0 ms | 32174 ms | 616 ms
|
SelectCategoryToSellItem | 0 % | 185 | 0 | 4 ms | 33860 ms | 465 ms
|
SellItemForm | 0 % | 175 | 0 | 2 ms | 25020 ms | 299 ms
|
RegisterItem | 0 % | 170 | 0 | 4 ms | 33780 ms | 600 ms
|
AboutMe (auth form) | 1 % | 606 | 0 | 0 ms | 32720 ms | 301 ms
|
AboutMe | 2 % | 1002 | 0 | 7 ms | 34195 ms | 470 ms
|
Back probability | 9 % | 3249 | 0 | 0 ms | 0 ms | 0 ms
|
End of Session | 1 % | 466 | 0 | 0 ms | 0 ms | 0 ms
|
Total | 100 % | 34715 | 298 | - | - | 440 ms
|
Average throughput | 77 req/s
| |||||
Completed sessions | 468
| |||||
Total time | 110955 seconds
| |||||
Average session time | 237 seconds
| |||||
| State name | % of total | Count | Errors | Minimum Time | Maximum Time | Average Time |
|---|---|---|---|---|---|---|
Home | 4 % | 52 | 0 | 0 ms | 1 ms | 0 ms
|
Register | 0 % | 8 | 0 | 0 ms | 0 ms | 0 ms
|
RegisterUser | 0 % | 4 | 0 | 5 ms | 7 ms | 9 ms
|
Browse | 6 % | 81 | 0 | 0 ms | 4 ms | 0 ms
|
BrowseCategories | 4 % | 63 | 0 | 3 ms | 20 ms | 4 ms
|
SearchItemsInCategory | 15 % | 202 | 0 | 1 ms | 16 ms | 6 ms
|
BrowseRegions | 1 % | 22 | 0 | 3 ms | 13 ms | 4 ms
|
BrowseCategoriesInRegion | 1 % | 23 | 0 | 3 ms | 7 ms | 4 ms
|
SearchItemsInRegion | 4 % | 55 | 0 | 0 ms | 24 ms | 8 ms
|
ViewItem | 17 % | 220 | 0 | 4 ms | 16 ms | 5 ms
|
ViewUserInfo | 2 % | 35 | 0 | 4 ms | 11 ms | 5 ms
|
ViewBidHistory | 1 % | 15 | 0 | 4 ms | 29 ms | 15 ms
|
BuyNowAuth | 1 % | 19 | 0 | 2 ms | 6 ms | 2 ms
|
BuyNow | 1 % | 17 | 3 | 4 ms | 8 ms | 3 ms
|
StoreBuyBow | 0 % | 9 | 0 | 4 ms | 7 ms | 5 ms
|
PutBidAuth | 5 % | 72 | 0 | 1 ms | 6 ms | 2 ms
|
PutBid | 5 % | 69 | 10 | 4 ms | 17 ms | 6 ms
|
StoreBid | 3 % | 45 | 0 | 4 ms | 10 ms | 4 ms
|
PutCommentAuth | 0 % | 0 | 0 | 0 ms | 0 ms | 0 ms
|
PutComment | 0 % | 6 | 0 | 4 ms | 10 ms | 8 ms
|
StoreComment | 0 % | 9 | 0 | 5 ms | 10 ms | 4 ms
|
Sell | 0 % | 3 | 0 | 0 ms | 1 ms | 1 ms
|
SelectCategoryToSellItem | 0 % | 7 | 0 | 4 ms | 7 ms | 8 ms
|
SellItemForm | 0 % | 10 | 0 | 2 ms | 5 ms | 3 ms
|
RegisterItem | 0 % | 11 | 0 | 5 ms | 7 ms | 2 ms
|
AboutMe (auth form) | 1 % | 16 | 0 | 0 ms | 46 ms | 3 ms
|
AboutMe | 3 % | 45 | 0 | 10 ms | 28 ms | 13 ms
|
Back probability | 11 % | 150 | 0 | 0 ms | 0 ms | 0 ms
|
End of Session | 0 % | 6 | 0 | 0 ms | 0 ms | 0 ms
|
Total | 100 % | 1274 | 13 | - | - | 4 ms
|
Average throughput | 42 req/s
| |||||
Completed sessions | 9
| |||||
Total time | 2945 seconds
| |||||
Average session time | 327 seconds
| |||||
| State name | % of total | Count | Errors | Minimum Time | Maximum Time | Average Time |
|---|---|---|---|---|---|---|
Home | 7 % | 3201 | 0 | 0 ms | 33930 ms | 1213 ms
|
Register | 1 % | 513 | 0 | 0 ms | 32766 ms | 326 ms
|
RegisterUser | 1 % | 491 | 2 | 4 ms | 30538 ms | 343 ms
|
Browse | 8 % | 3531 | 0 | 0 ms | 34225 ms | 212 ms
|
BrowseCategories | 5 % | 2410 | 0 | 3 ms | 36873 ms | 420 ms
|
SearchItemsInCategory | 15 % | 6557 | 0 | 0 ms | 34089 ms | 351 ms
|
BrowseRegions | 2 % | 1012 | 0 | 3 ms | 33221 ms | 248 ms
|
BrowseCategoriesInRegion | 2 % | 976 | 0 | 3 ms | 32420 ms | 262 ms
|
SearchItemsInRegion | 5 % | 2174 | 0 | 0 ms | 33690 ms | 300 ms
|
ViewItem | 13 % | 5834 | 0 | 4 ms | 34585 ms | 380 ms
|
ViewUserInfo | 2 % | 1188 | 0 | 3 ms | 32725 ms | 312 ms
|
ViewBidHistory | 1 % | 602 | 0 | 3 ms | 34350 ms | 530 ms
|
BuyNowAuth | 1 % | 528 | 0 | 2 ms | 33510 ms | 597 ms
|
BuyNow | 1 % | 502 | 82 | 4 ms | 33550 ms | 399 ms
|
StoreBuyBow | 0 % | 396 | 0 | 4 ms | 32911 ms | 393 ms
|
PutBidAuth | 4 % | 1968 | 0 | 0 ms | 38071 ms | 587 ms
|
PutBid | 4 % | 2133 | 263 | 4 ms | 33410 ms | 463 ms
|
StoreBid | 3 % | 1334 | 0 | 4 ms | 33082 ms | 331 ms
|
PutCommentAuth | 0 % | 0 | 0 | 0 ms | 0 ms | 0 ms
|
PutComment | 0 % | 188 | 15 | 4 ms | 33224 ms | 478 ms
|
StoreComment | 0 % | 164 | 0 | 4 ms | 32157 ms | 204 ms
|
Sell | 0 % | 250 | 0 | 0 ms | 32174 ms | 503 ms
|
SelectCategoryToSellItem | 0 % | 244 | 0 | 4 ms | 33860 ms | 354 ms
|
SellItemForm | 0 % | 236 | 0 | 2 ms | 25020 ms | 222 ms
|
RegisterItem | 0 % | 230 | 0 | 4 ms | 33780 ms | 473 ms
|
AboutMe (auth form) | 1 % | 775 | 0 | 0 ms | 32720 ms | 261 ms
|
AboutMe | 2 % | 1279 | 0 | 7 ms | 34195 ms | 379 ms
|
Back probability | 9 % | 3914 | 0 | 0 ms | 0 ms | 0 ms
|
End of Session | 1 % | 525 | 0 | 0 ms | 0 ms | 0 ms
|
Total | 100 % | 43155 | 362 | - | - | 386 ms
|
Average throughput | 72 req/s
| |||||
Completed sessions | 525
| |||||
Total time | 117958 seconds
| |||||
Average session time | 224 seconds
| |||||
An error occured while waiting for remote processes termination (Skipping waits)
Command is: /usr/bin/scp farm6.csail.mit.edu:/tmp/client1 /home/drkp/sandbox/txcache/src/RUBiS-1.4.3/bench/2009-3-19@19:2:36//client1.bin
Command is: /usr/bin/ssh -x localhost /bin/bash -c 'LANG=en_GB.UTF-8 /usr/bin/sar -n DEV -n SOCK -rubcw 1 605 -f /home/drkp/sandbox/txcache/src/RUBiS-1.4.3/bench/2009-3-19@19:2:36//client1.bin > /home/drkp/sandbox/txcache/src/RUBiS-1.4.3/bench/2009-3-19@19:2:36//client1'
Command is: /usr/bin/scp farm14:/tmp/db_server0 /home/drkp/sandbox/txcache/src/RUBiS-1.4.3/bench/2009-3-19@19:2:36//db_server0.bin
Command is: /usr/bin/ssh -x localhost /bin/bash -c 'LANG=en_GB.UTF-8 /usr/bin/sar -n DEV -n SOCK -rubcw 1 605 -f /home/drkp/sandbox/txcache/src/RUBiS-1.4.3/bench/2009-3-19@19:2:36//db_server0.bin > /home/drkp/sandbox/txcache/src/RUBiS-1.4.3/bench/2009-3-19@19:2:36//db_server0'
Command is: /usr/bin/scp farm12.csail.mit.edu:/tmp/web_server0 /home/drkp/sandbox/txcache/src/RUBiS-1.4.3/bench/2009-3-19@19:2:36//web_server0.bin
Command is: /usr/bin/ssh -x localhost /bin/bash -c 'LANG=en_GB.UTF-8 /usr/bin/sar -n DEV -n SOCK -rubcw 1 605 -f /home/drkp/sandbox/txcache/src/RUBiS-1.4.3/bench/2009-3-19@19:2:36//web_server0.bin > /home/drkp/sandbox/txcache/src/RUBiS-1.4.3/bench/2009-3-19@19:2:36//web_server0'
Command is: /usr/bin/scp farm13.csail.mit.edu:/tmp/web_server1 /home/drkp/sandbox/txcache/src/RUBiS-1.4.3/bench/2009-3-19@19:2:36//web_server1.bin
Command is: /usr/bin/ssh -x localhost /bin/bash -c 'LANG=en_GB.UTF-8 /usr/bin/sar -n DEV -n SOCK -rubcw 1 605 -f /home/drkp/sandbox/txcache/src/RUBiS-1.4.3/bench/2009-3-19@19:2:36//web_server1.bin > /home/drkp/sandbox/txcache/src/RUBiS-1.4.3/bench/2009-3-19@19:2:36//web_server1'
Command is: /usr/bin/scp localhost:/tmp/client0 /home/drkp/sandbox/txcache/src/RUBiS-1.4.3/bench/2009-3-19@19:2:36//client0.bin
Command is: /usr/bin/ssh -x localhost /bin/bash -c 'LANG=en_GB.UTF-8 /usr/bin/sar -n DEV -n SOCK -rubcw 1 605 -f /home/drkp/sandbox/txcache/src/RUBiS-1.4.3/bench/2009-3-19@19:2:36//client0.bin > /home/drkp/sandbox/txcache/src/RUBiS-1.4.3/bench/2009-3-19@19:2:36//client0'
Command is: /usr/bin/scp farm6.csail.mit.edu:/tmp/trace_client1.html /home/drkp/sandbox/txcache/src/RUBiS-1.4.3/bench/2009-3-19@19:2:36//
Command is: /usr/bin/scp farm6.csail.mit.edu:/tmp/stat_client1.html /home/drkp/sandbox/txcache/src/RUBiS-1.4.3/bench/2009-3-19@19:2:36//
|
|
|
|
|
|
 | 
|
 | 
|
 | 
|
 | 
|
 | 
|
 | 
|
 | 
|
 | 
|
 | 
|