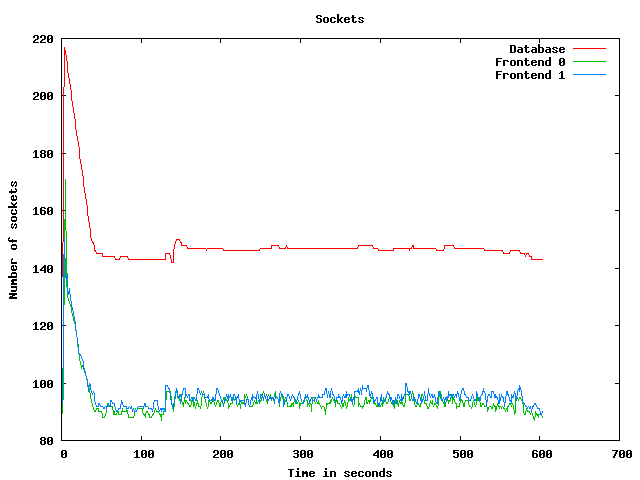
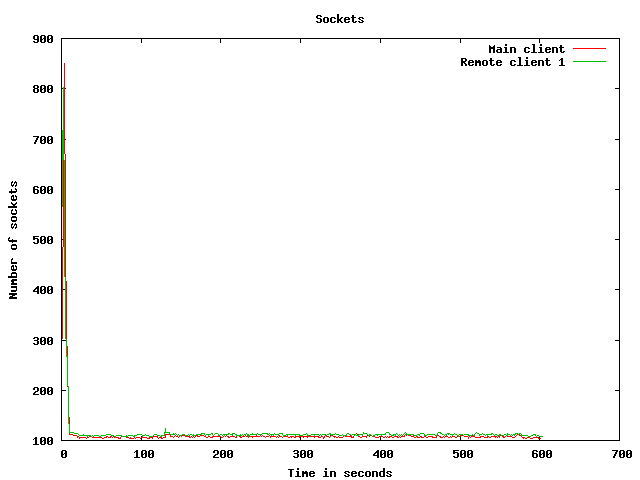
Node information
Test timing information
Up ramp statistics
Runtime session statistics
Down ramp statistics
Overall statistics
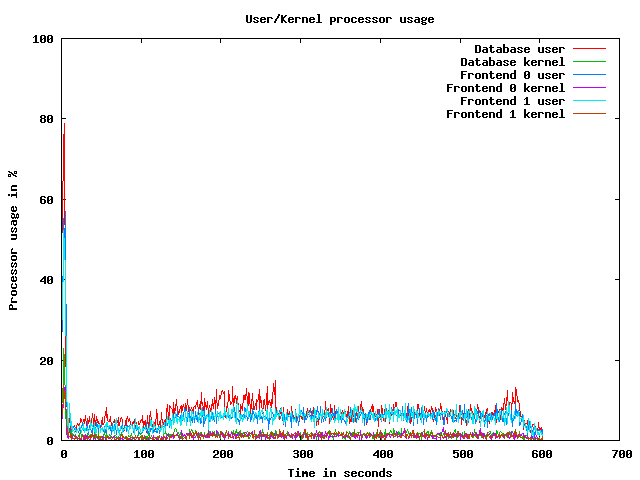
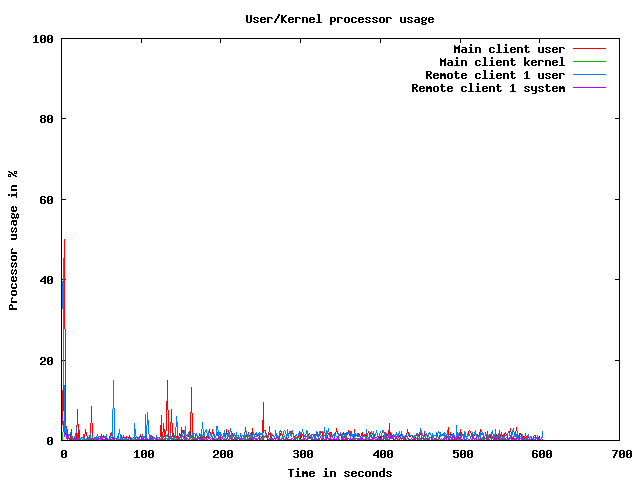
CPU usage graphs
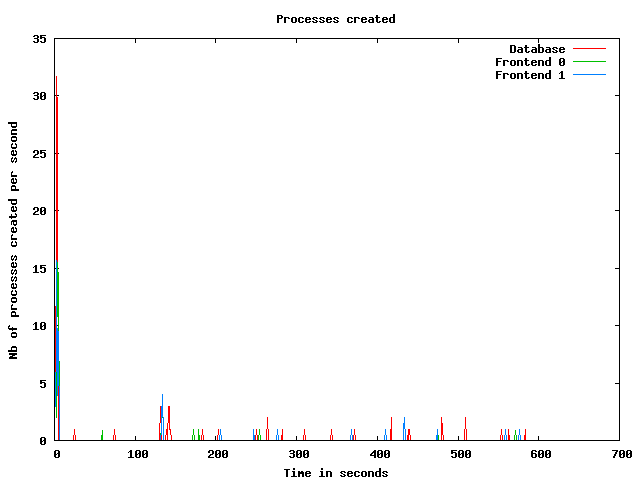
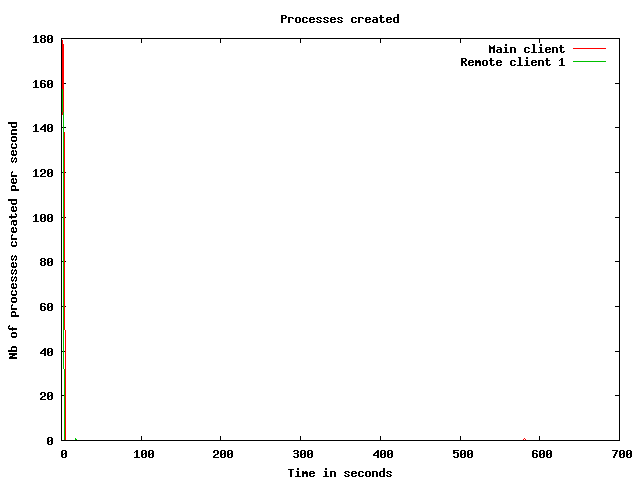
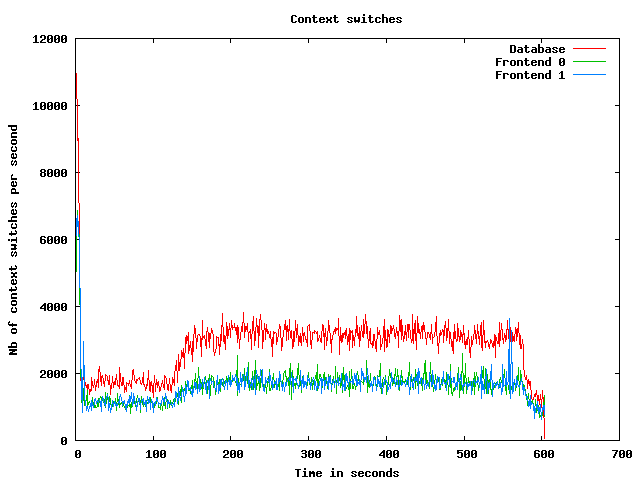
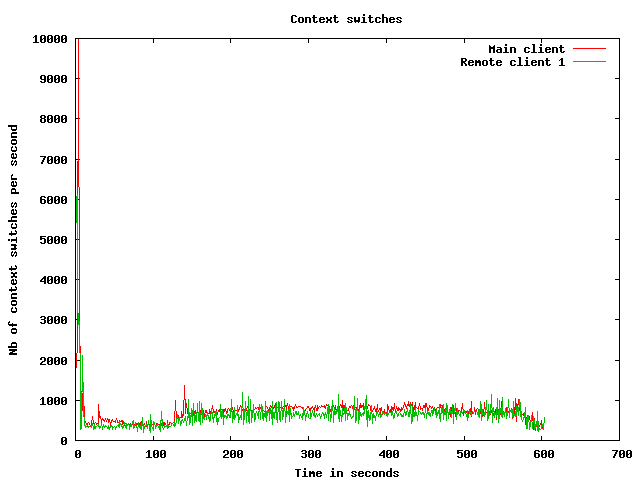
Processes usage graphs
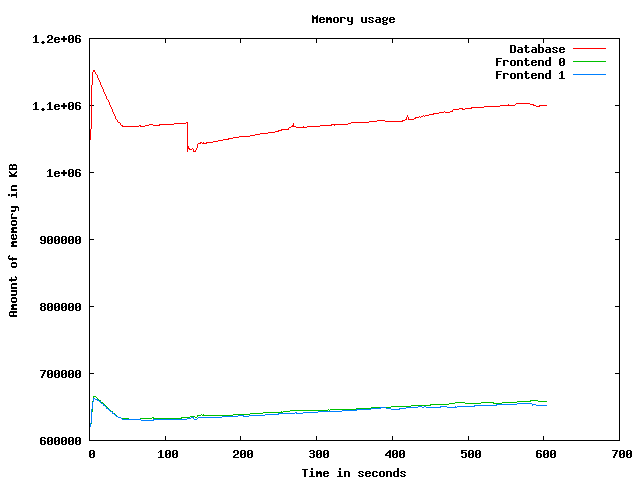
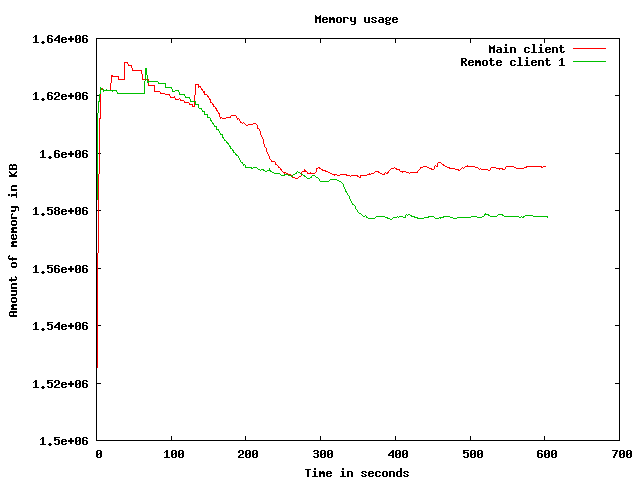
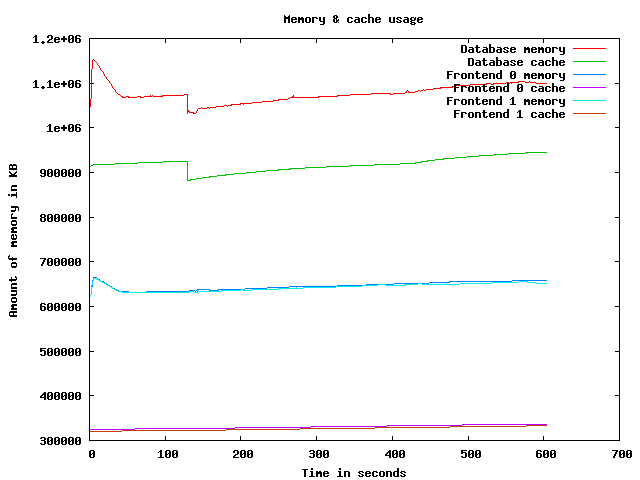
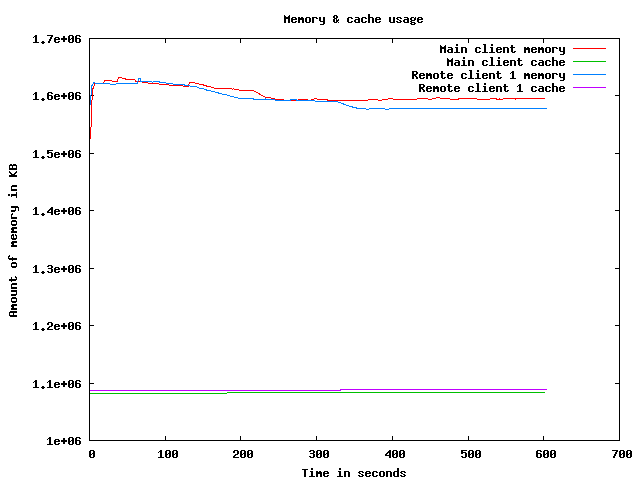
Memory usage graph
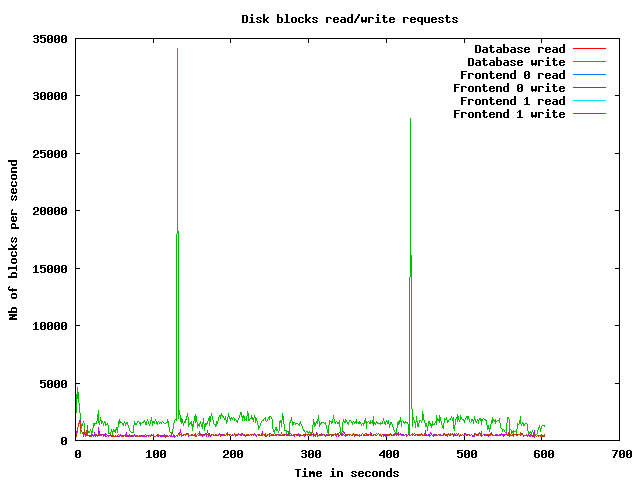
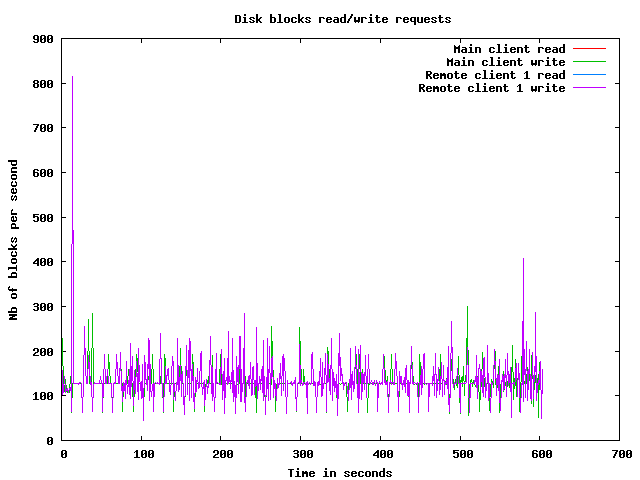
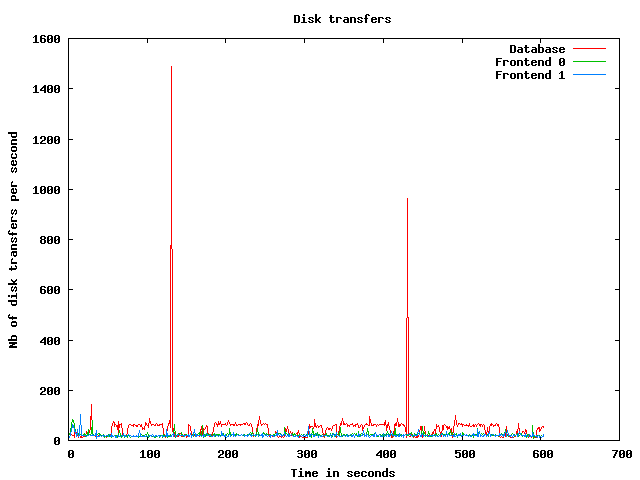
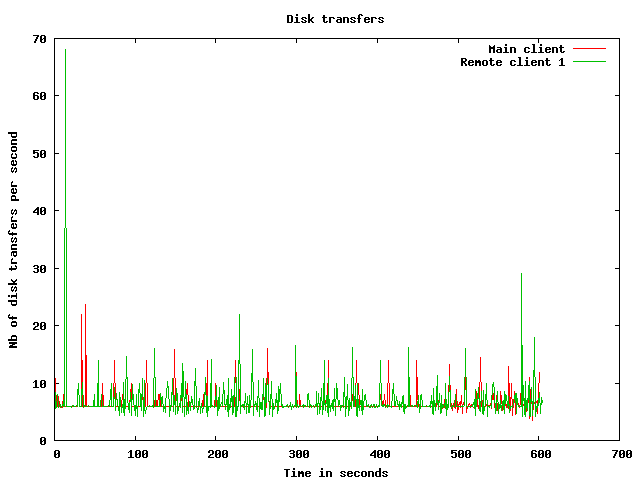
Disk usage graphs
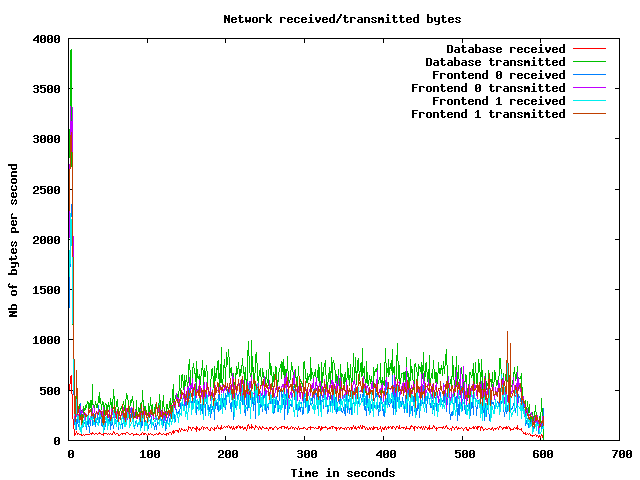
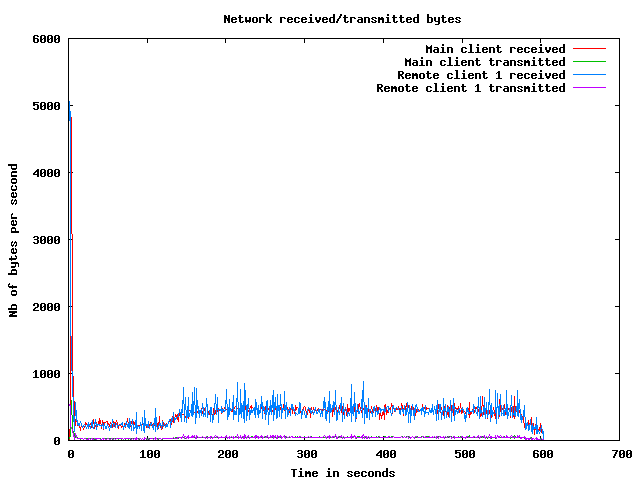
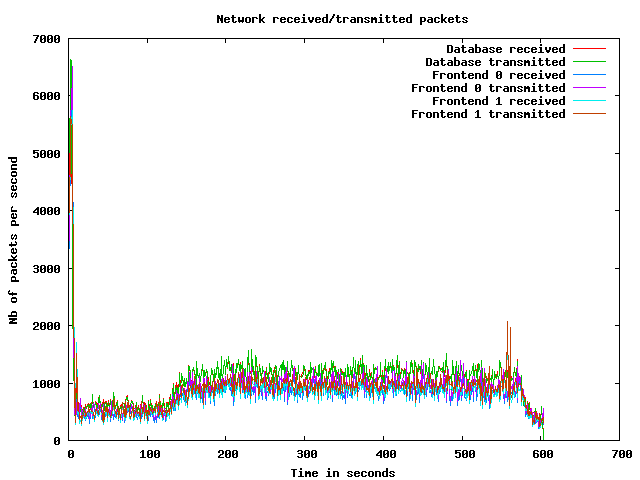
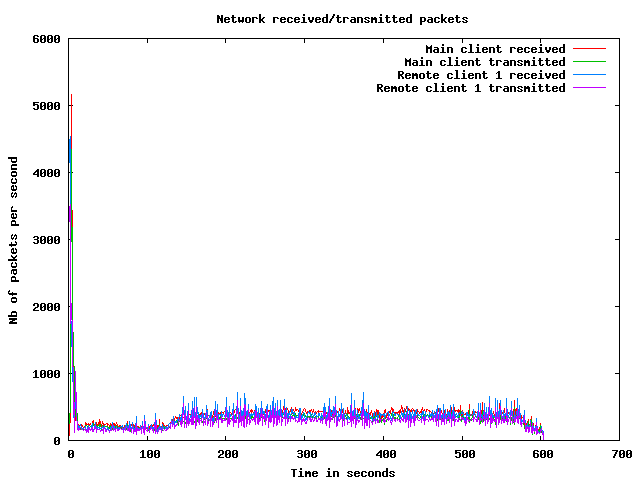
Network usage graphs
| Test start | 2009-3-19 19:14:40 |
| Up ramp start | 2009-3-19 19:14:47 |
| Runtime session start | 2009-3-19 19:16:47 |
| Down ramp start | 2009-3-19 19:24:17 |
| Test end | 2009-3-19 19:26:16 |
| Up ramp length | 2 minutes 0 millisecond (requested 120000 ms) |
| Runtime session length | 7 minutes 30 seconds 0 millisecond (requested 450000 ms) |
| Down ramp length | 30 seconds 1 millisecond (requested 30000 ms) |
| Total test length | 11 minutes 35 seconds 701 milliseconds |
| State name | % of total | Count | Errors | Minimum Time | Maximum Time | Average Time |
|---|---|---|---|---|---|---|
Home | 10 % | 1136 | 0 | 0 ms | 9013 ms | 2009 ms
|
Register | 1 % | 146 | 0 | 0 ms | 3006 ms | 160 ms
|
RegisterUser | 1 % | 128 | 0 | 5 ms | 3055 ms | 99 ms
|
Browse | 10 % | 1090 | 0 | 0 ms | 3089 ms | 174 ms
|
BrowseCategories | 6 % | 704 | 0 | 3 ms | 3295 ms | 118 ms
|
SearchItemsInCategory | 14 % | 1605 | 0 | 0 ms | 3104 ms | 88 ms
|
BrowseRegions | 2 % | 311 | 0 | 3 ms | 3122 ms | 179 ms
|
BrowseCategoriesInRegion | 2 % | 287 | 0 | 3 ms | 3008 ms | 92 ms
|
SearchItemsInRegion | 4 % | 525 | 0 | 0 ms | 3022 ms | 32 ms
|
ViewItem | 12 % | 1370 | 0 | 4 ms | 3095 ms | 80 ms
|
ViewUserInfo | 2 % | 221 | 0 | 4 ms | 3038 ms | 52 ms
|
ViewBidHistory | 1 % | 117 | 0 | 4 ms | 3028 ms | 72 ms
|
BuyNowAuth | 1 % | 129 | 0 | 2 ms | 3000 ms | 33 ms
|
BuyNow | 1 % | 118 | 21 | 4 ms | 583 ms | 19 ms
|
StoreBuyBow | 0 % | 81 | 0 | 4 ms | 3003 ms | 164 ms
|
PutBidAuth | 3 % | 412 | 0 | 0 ms | 3006 ms | 57 ms
|
PutBid | 3 % | 374 | 55 | 4 ms | 3120 ms | 31 ms
|
StoreBid | 1 % | 212 | 0 | 4 ms | 3006 ms | 50 ms
|
PutCommentAuth | 0 % | 0 | 0 | 0 ms | 0 ms | 0 ms
|
PutComment | 0 % | 30 | 3 | 4 ms | 3011 ms | 116 ms
|
StoreComment | 0 % | 22 | 0 | 5 ms | 574 ms | 32 ms
|
Sell | 0 % | 85 | 0 | 0 ms | 3008 ms | 120 ms
|
SelectCategoryToSellItem | 0 % | 79 | 0 | 4 ms | 3012 ms | 122 ms
|
SellItemForm | 0 % | 72 | 0 | 2 ms | 3069 ms | 130 ms
|
RegisterItem | 0 % | 68 | 0 | 4 ms | 3007 ms | 75 ms
|
AboutMe (auth form) | 2 % | 218 | 0 | 0 ms | 3054 ms | 141 ms
|
AboutMe | 2 % | 318 | 0 | 9 ms | 3036 ms | 101 ms
|
Back probability | 7 % | 804 | 0 | 0 ms | 0 ms | 0 ms
|
End of Session | 0 % | 105 | 0 | 0 ms | 0 ms | 0 ms
|
Total | 100 % | 10767 | 79 | - | - | 288 ms
|
Average throughput | 90 req/s
| |||||
Completed sessions | 90
| |||||
Total time | 4842 seconds
| |||||
Average session time | 53 seconds
| |||||
| State name | % of total | Count | Errors | Minimum Time | Maximum Time | Average Time |
|---|---|---|---|---|---|---|
Home | 4 % | 2596 | 0 | 0 ms | 12 ms | 0 ms
|
Register | 1 % | 594 | 0 | 0 ms | 12 ms | 0 ms
|
RegisterUser | 1 % | 590 | 2 | 5 ms | 468 ms | 8 ms
|
Browse | 7 % | 4038 | 0 | 0 ms | 62 ms | 0 ms
|
BrowseCategories | 5 % | 2810 | 0 | 3 ms | 71 ms | 5 ms
|
SearchItemsInCategory | 15 % | 8853 | 0 | 0 ms | 686 ms | 8 ms
|
BrowseRegions | 2 % | 1173 | 0 | 3 ms | 29 ms | 5 ms
|
BrowseCategoriesInRegion | 2 % | 1151 | 0 | 3 ms | 35 ms | 5 ms
|
SearchItemsInRegion | 5 % | 2831 | 0 | 0 ms | 150 ms | 8 ms
|
ViewItem | 14 % | 7880 | 0 | 4 ms | 440 ms | 8 ms
|
ViewUserInfo | 3 % | 1847 | 0 | 3 ms | 31 ms | 6 ms
|
ViewBidHistory | 1 % | 868 | 0 | 3 ms | 332 ms | 12 ms
|
BuyNowAuth | 1 % | 756 | 0 | 2 ms | 16 ms | 3 ms
|
BuyNow | 1 % | 743 | 114 | 4 ms | 27 ms | 6 ms
|
StoreBuyBow | 1 % | 621 | 0 | 4 ms | 68 ms | 6 ms
|
PutBidAuth | 4 % | 2693 | 0 | 0 ms | 412 ms | 3 ms
|
PutBid | 5 % | 3059 | 373 | 4 ms | 74 ms | 8 ms
|
StoreBid | 3 % | 2008 | 0 | 4 ms | 732 ms | 8 ms
|
PutCommentAuth | 0 % | 0 | 0 | 0 ms | 0 ms | 0 ms
|
PutComment | 0 % | 250 | 10 | 4 ms | 24 ms | 6 ms
|
StoreComment | 0 % | 241 | 0 | 4 ms | 29 ms | 7 ms
|
Sell | 0 % | 278 | 0 | 0 ms | 8 ms | 0 ms
|
SelectCategoryToSellItem | 0 % | 277 | 0 | 4 ms | 25 ms | 5 ms
|
SellItemForm | 0 % | 274 | 0 | 2 ms | 11 ms | 3 ms
|
RegisterItem | 0 % | 268 | 0 | 4 ms | 33 ms | 6 ms
|
AboutMe (auth form) | 1 % | 916 | 0 | 0 ms | 15 ms | 0 ms
|
AboutMe | 2 % | 1495 | 0 | 8 ms | 369 ms | 18 ms
|
Back probability | 10 % | 5598 | 0 | 0 ms | 0 ms | 0 ms
|
End of Session | 1 % | 816 | 0 | 0 ms | 0 ms | 0 ms
|
Total | 100 % | 55524 | 499 | - | - | 5 ms
|
Average throughput | 124 req/s
| |||||
Completed sessions | 818
| |||||
Total time | 196838 seconds
| |||||
Average session time | 240 seconds
| |||||
| State name | % of total | Count | Errors | Minimum Time | Maximum Time | Average Time |
|---|---|---|---|---|---|---|
Home | 5 % | 99 | 0 | 0 ms | 6 ms | 0 ms
|
Register | 1 % | 26 | 0 | 0 ms | 2 ms | 0 ms
|
RegisterUser | 1 % | 24 | 0 | 5 ms | 11 ms | 5 ms
|
Browse | 7 % | 139 | 0 | 0 ms | 3 ms | 0 ms
|
BrowseCategories | 5 % | 104 | 0 | 3 ms | 15 ms | 4 ms
|
SearchItemsInCategory | 16 % | 311 | 0 | 0 ms | 31 ms | 9 ms
|
BrowseRegions | 2 % | 42 | 0 | 3 ms | 15 ms | 5 ms
|
BrowseCategoriesInRegion | 2 % | 46 | 0 | 3 ms | 6 ms | 3 ms
|
SearchItemsInRegion | 5 % | 103 | 0 | 0 ms | 20 ms | 7 ms
|
ViewItem | 13 % | 242 | 0 | 4 ms | 22 ms | 6 ms
|
ViewUserInfo | 2 % | 54 | 0 | 3 ms | 11 ms | 5 ms
|
ViewBidHistory | 1 % | 28 | 0 | 4 ms | 17 ms | 11 ms
|
BuyNowAuth | 1 % | 22 | 0 | 2 ms | 10 ms | 2 ms
|
BuyNow | 1 % | 19 | 3 | 4 ms | 9 ms | 5 ms
|
StoreBuyBow | 0 % | 15 | 0 | 4 ms | 12 ms | 5 ms
|
PutBidAuth | 4 % | 89 | 0 | 0 ms | 9 ms | 2 ms
|
PutBid | 5 % | 103 | 17 | 4 ms | 17 ms | 6 ms
|
StoreBid | 3 % | 59 | 0 | 4 ms | 12 ms | 6 ms
|
PutCommentAuth | 0 % | 0 | 0 | 0 ms | 0 ms | 0 ms
|
PutComment | 0 % | 8 | 0 | 4 ms | 7 ms | 3 ms
|
StoreComment | 0 % | 6 | 0 | 5 ms | 9 ms | 7 ms
|
Sell | 0 % | 4 | 0 | 0 ms | 2 ms | 0 ms
|
SelectCategoryToSellItem | 0 % | 3 | 0 | 4 ms | 7 ms | 9 ms
|
SellItemForm | 0 % | 6 | 0 | 2 ms | 6 ms | 3 ms
|
RegisterItem | 0 % | 7 | 0 | 4 ms | 10 ms | 9 ms
|
AboutMe (auth form) | 1 % | 32 | 0 | 0 ms | 1 ms | 0 ms
|
AboutMe | 2 % | 45 | 0 | 9 ms | 33 ms | 15 ms
|
Back probability | 9 % | 184 | 0 | 0 ms | 0 ms | 0 ms
|
End of Session | 1 % | 32 | 0 | 0 ms | 0 ms | 0 ms
|
Total | 100 % | 1852 | 20 | - | - | 5 ms
|
Average throughput | 62 req/s
| |||||
Completed sessions | 28
| |||||
Total time | 10428 seconds
| |||||
Average session time | 372 seconds
| |||||
| State name | % of total | Count | Errors | Minimum Time | Maximum Time | Average Time |
|---|---|---|---|---|---|---|
Home | 5 % | 3831 | 0 | 0 ms | 9013 ms | 596 ms
|
Register | 1 % | 766 | 0 | 0 ms | 3006 ms | 31 ms
|
RegisterUser | 1 % | 742 | 2 | 5 ms | 3055 ms | 24 ms
|
Browse | 7 % | 5267 | 0 | 0 ms | 3089 ms | 36 ms
|
BrowseCategories | 5 % | 3618 | 0 | 3 ms | 3295 ms | 27 ms
|
SearchItemsInCategory | 15 % | 10807 | 0 | 0 ms | 3104 ms | 20 ms
|
BrowseRegions | 2 % | 1526 | 0 | 3 ms | 3122 ms | 40 ms
|
BrowseCategoriesInRegion | 2 % | 1484 | 0 | 3 ms | 3008 ms | 22 ms
|
SearchItemsInRegion | 5 % | 3464 | 0 | 0 ms | 3022 ms | 12 ms
|
ViewItem | 13 % | 9511 | 0 | 4 ms | 3095 ms | 18 ms
|
ViewUserInfo | 3 % | 2127 | 0 | 3 ms | 3038 ms | 11 ms
|
ViewBidHistory | 1 % | 1020 | 0 | 3 ms | 3028 ms | 19 ms
|
BuyNowAuth | 1 % | 907 | 0 | 2 ms | 3000 ms | 7 ms
|
BuyNow | 1 % | 880 | 138 | 4 ms | 583 ms | 8 ms
|
StoreBuyBow | 1 % | 717 | 0 | 4 ms | 3003 ms | 24 ms
|
PutBidAuth | 4 % | 3194 | 0 | 0 ms | 3006 ms | 10 ms
|
PutBid | 5 % | 3543 | 445 | 4 ms | 3120 ms | 10 ms
|
StoreBid | 3 % | 2279 | 0 | 4 ms | 3006 ms | 12 ms
|
PutCommentAuth | 0 % | 0 | 0 | 0 ms | 0 ms | 0 ms
|
PutComment | 0 % | 288 | 13 | 4 ms | 3011 ms | 18 ms
|
StoreComment | 0 % | 269 | 0 | 4 ms | 574 ms | 9 ms
|
Sell | 0 % | 367 | 0 | 0 ms | 3008 ms | 28 ms
|
SelectCategoryToSellItem | 0 % | 359 | 0 | 4 ms | 3012 ms | 31 ms
|
SellItemForm | 0 % | 352 | 0 | 2 ms | 3069 ms | 29 ms
|
RegisterItem | 0 % | 343 | 0 | 4 ms | 3007 ms | 20 ms
|
AboutMe (auth form) | 1 % | 1166 | 0 | 0 ms | 3054 ms | 27 ms
|
AboutMe | 2 % | 1871 | 0 | 8 ms | 3036 ms | 32 ms
|
Back probability | 9 % | 6586 | 0 | 0 ms | 0 ms | 0 ms
|
End of Session | 1 % | 953 | 0 | 0 ms | 0 ms | 0 ms
|
Total | 100 % | 68237 | 598 | - | - | 50 ms
|
Average throughput | 114 req/s
| |||||
Completed sessions | 953
| |||||
Total time | 219381 seconds
| |||||
Average session time | 230 seconds
| |||||
An error occured while waiting for remote processes termination (Skipping waits)
Command is: /usr/bin/scp farm6.csail.mit.edu:/tmp/client1 /home/drkp/sandbox/txcache/src/RUBiS-1.4.3/bench/2009-3-19@19:14:40//client1.bin
Command is: /usr/bin/ssh -x localhost /bin/bash -c 'LANG=en_GB.UTF-8 /usr/bin/sar -n DEV -n SOCK -rubcw 1 605 -f /home/drkp/sandbox/txcache/src/RUBiS-1.4.3/bench/2009-3-19@19:14:40//client1.bin > /home/drkp/sandbox/txcache/src/RUBiS-1.4.3/bench/2009-3-19@19:14:40//client1'
Command is: /usr/bin/scp farm14:/tmp/db_server0 /home/drkp/sandbox/txcache/src/RUBiS-1.4.3/bench/2009-3-19@19:14:40//db_server0.bin
Command is: /usr/bin/ssh -x localhost /bin/bash -c 'LANG=en_GB.UTF-8 /usr/bin/sar -n DEV -n SOCK -rubcw 1 605 -f /home/drkp/sandbox/txcache/src/RUBiS-1.4.3/bench/2009-3-19@19:14:40//db_server0.bin > /home/drkp/sandbox/txcache/src/RUBiS-1.4.3/bench/2009-3-19@19:14:40//db_server0'
Command is: /usr/bin/scp farm12.csail.mit.edu:/tmp/web_server0 /home/drkp/sandbox/txcache/src/RUBiS-1.4.3/bench/2009-3-19@19:14:40//web_server0.bin
Command is: /usr/bin/ssh -x localhost /bin/bash -c 'LANG=en_GB.UTF-8 /usr/bin/sar -n DEV -n SOCK -rubcw 1 605 -f /home/drkp/sandbox/txcache/src/RUBiS-1.4.3/bench/2009-3-19@19:14:40//web_server0.bin > /home/drkp/sandbox/txcache/src/RUBiS-1.4.3/bench/2009-3-19@19:14:40//web_server0'
Command is: /usr/bin/scp farm13.csail.mit.edu:/tmp/web_server1 /home/drkp/sandbox/txcache/src/RUBiS-1.4.3/bench/2009-3-19@19:14:40//web_server1.bin
Command is: /usr/bin/ssh -x localhost /bin/bash -c 'LANG=en_GB.UTF-8 /usr/bin/sar -n DEV -n SOCK -rubcw 1 605 -f /home/drkp/sandbox/txcache/src/RUBiS-1.4.3/bench/2009-3-19@19:14:40//web_server1.bin > /home/drkp/sandbox/txcache/src/RUBiS-1.4.3/bench/2009-3-19@19:14:40//web_server1'
Command is: /usr/bin/scp localhost:/tmp/client0 /home/drkp/sandbox/txcache/src/RUBiS-1.4.3/bench/2009-3-19@19:14:40//client0.bin
Command is: /usr/bin/ssh -x localhost /bin/bash -c 'LANG=en_GB.UTF-8 /usr/bin/sar -n DEV -n SOCK -rubcw 1 605 -f /home/drkp/sandbox/txcache/src/RUBiS-1.4.3/bench/2009-3-19@19:14:40//client0.bin > /home/drkp/sandbox/txcache/src/RUBiS-1.4.3/bench/2009-3-19@19:14:40//client0'
Command is: /usr/bin/scp farm6.csail.mit.edu:/tmp/trace_client1.html /home/drkp/sandbox/txcache/src/RUBiS-1.4.3/bench/2009-3-19@19:14:40//
Command is: /usr/bin/scp farm6.csail.mit.edu:/tmp/stat_client1.html /home/drkp/sandbox/txcache/src/RUBiS-1.4.3/bench/2009-3-19@19:14:40//
|
|
|
|
|
|
 | 
|
 | 
|
 | 
|
 | 
|
 | 
|
 | 
|
 | 
|
 | 
|
 | 
|