Node information
Test timing information
Up ramp statistics
Runtime session statistics
Down ramp statistics
Overall statistics
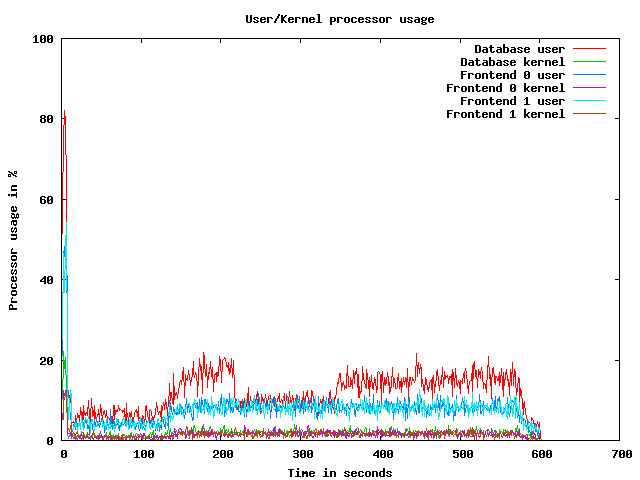
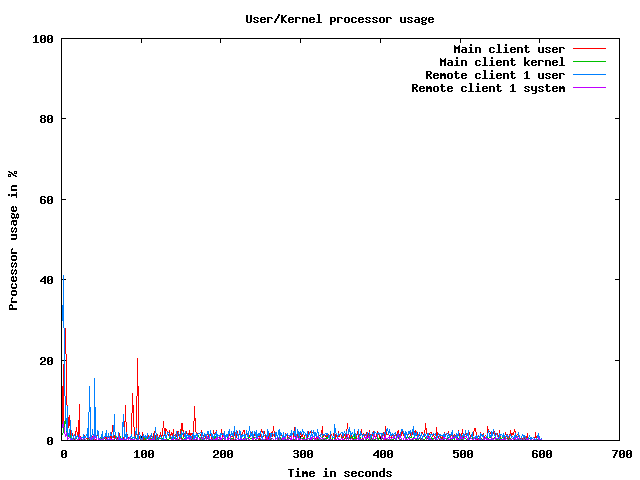
CPU usage graphs
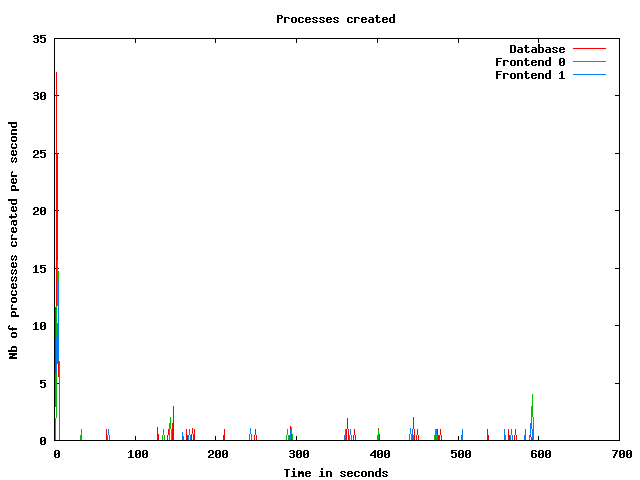
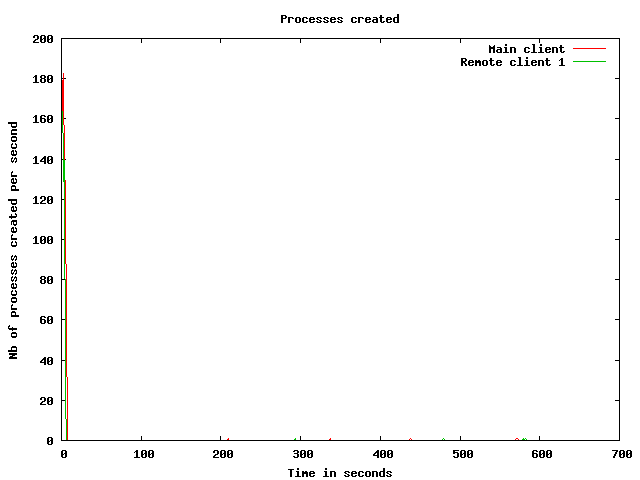
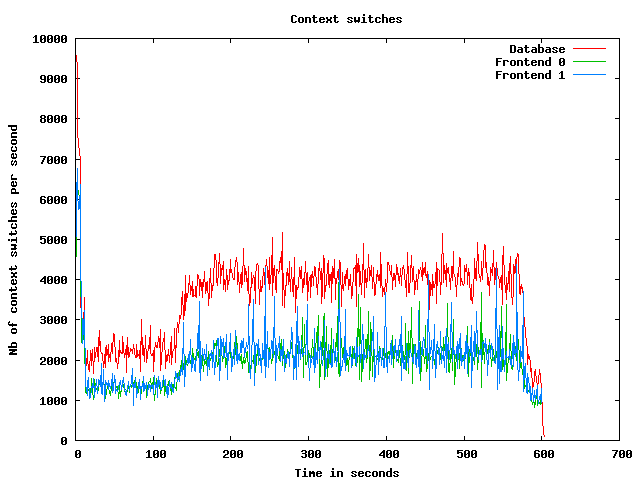
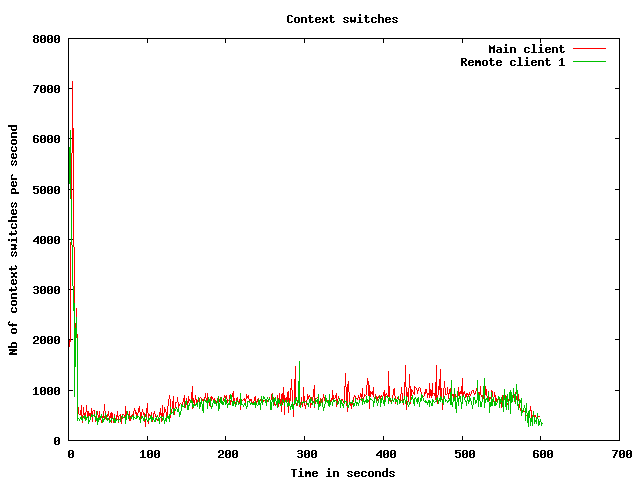
Processes usage graphs
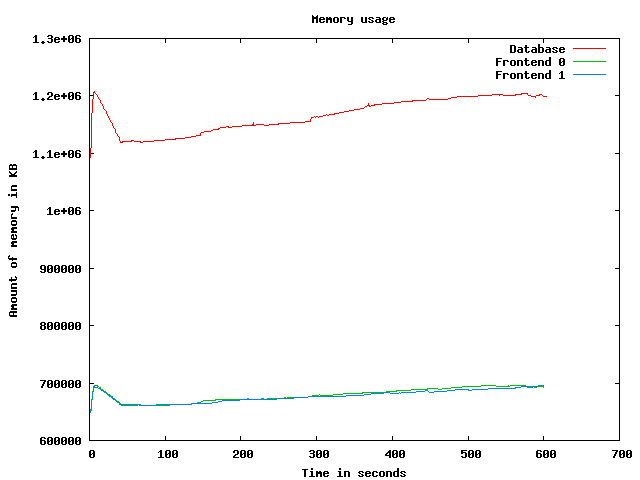
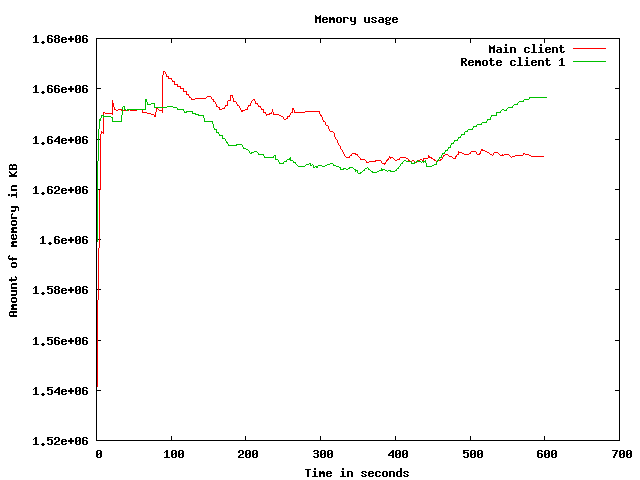
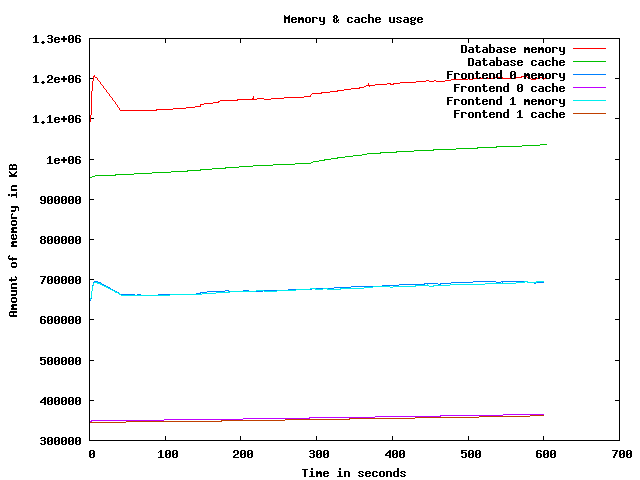
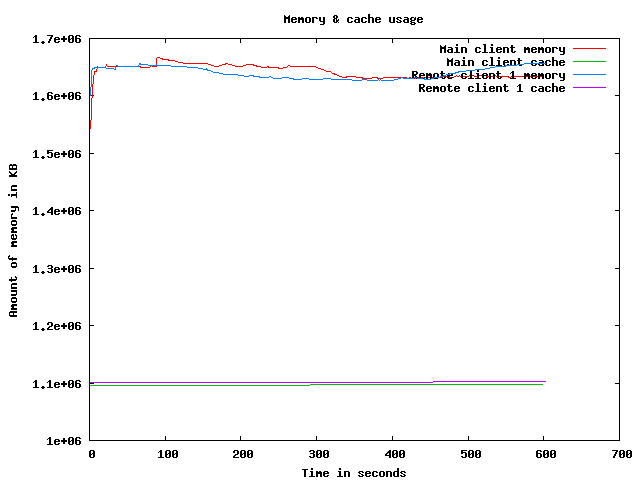
Memory usage graph
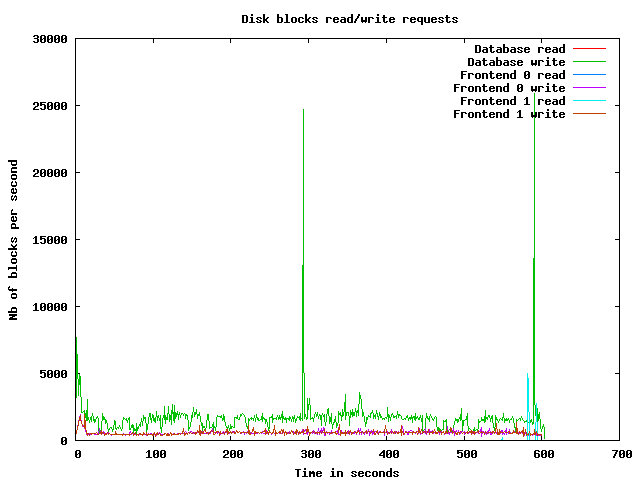
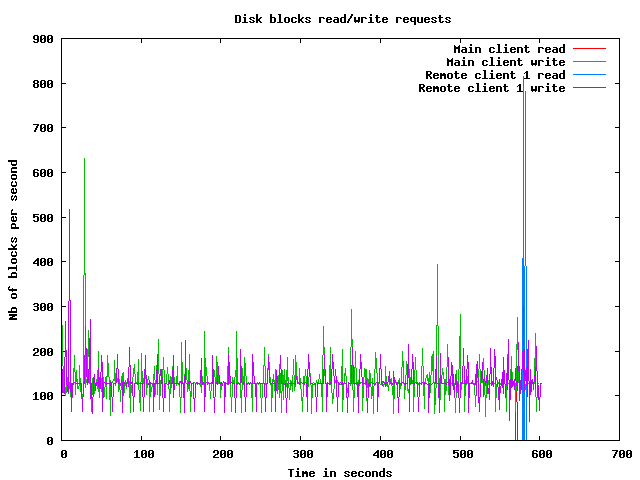
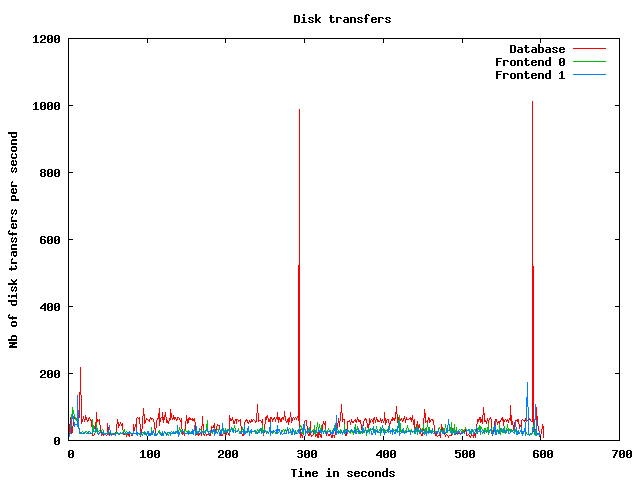
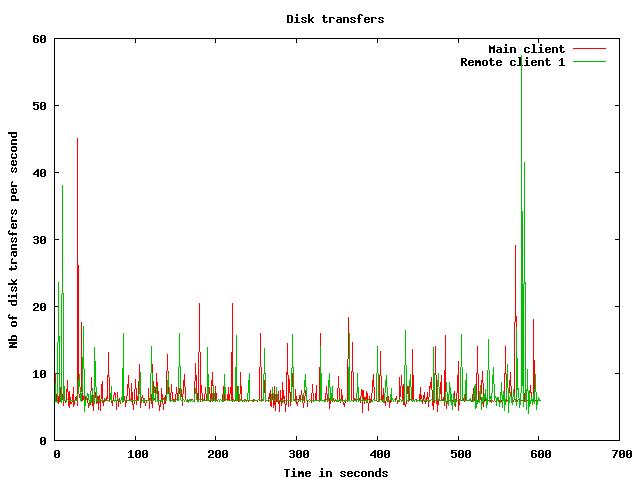
Disk usage graphs
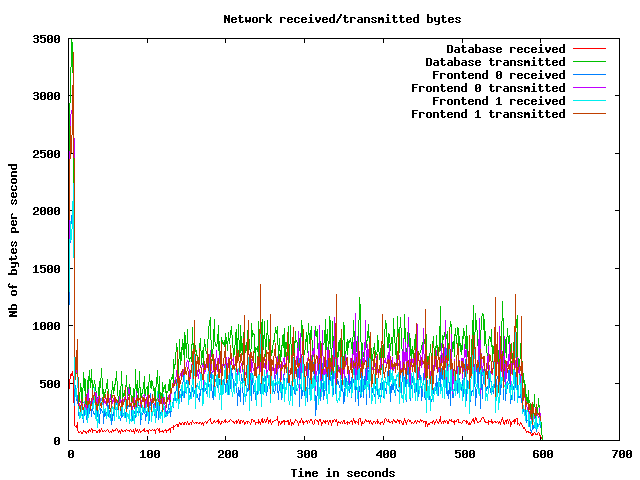
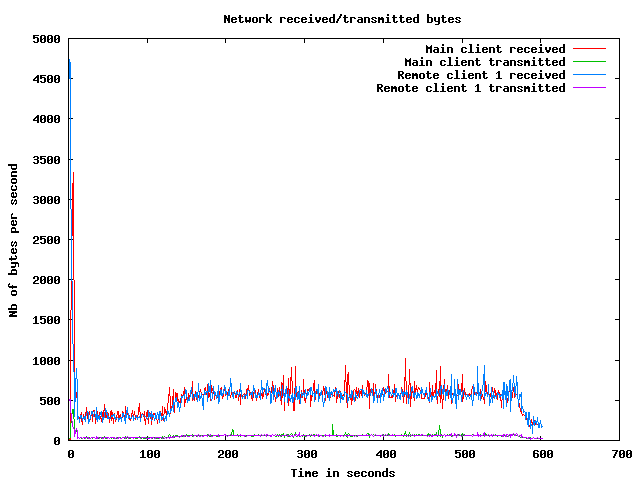
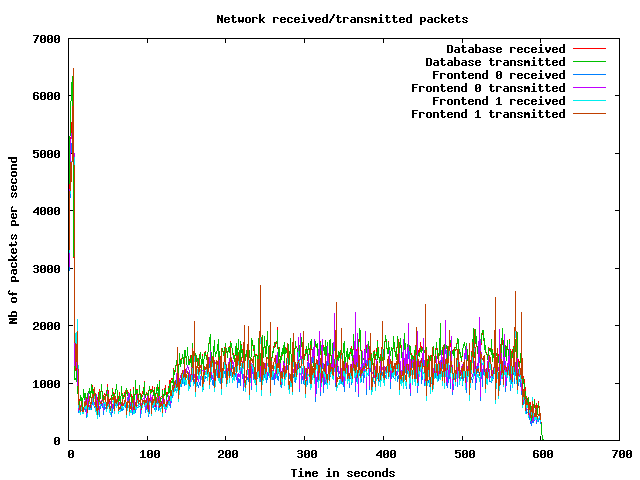
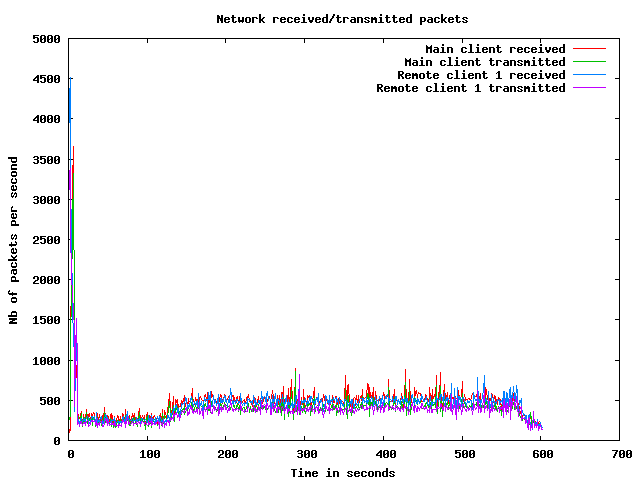
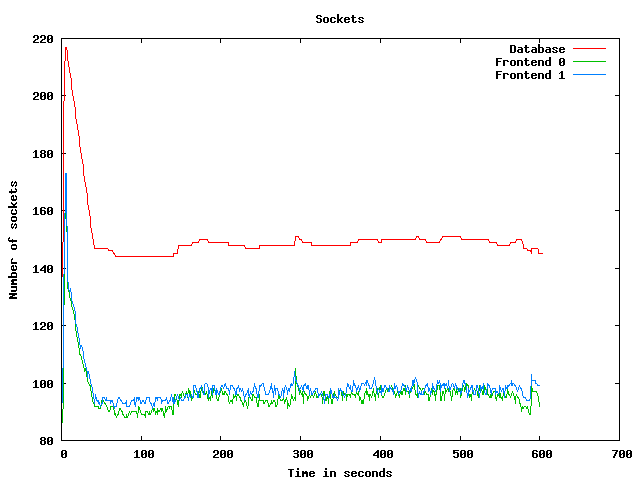
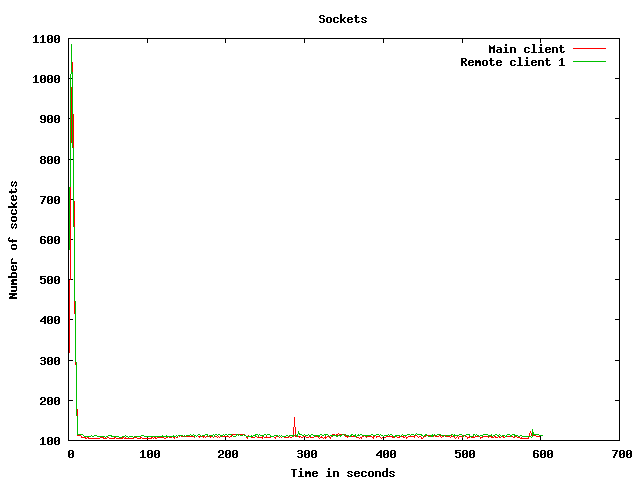
Network usage graphs
| Test start | 2009-3-19 19:26:59 |
| Up ramp start | 2009-3-19 19:27:7 |
| Runtime session start | 2009-3-19 19:29:7 |
| Down ramp start | 2009-3-19 19:36:37 |
| Test end | 2009-3-19 19:38:45 |
| Up ramp length | 2 minutes 1 millisecond (requested 120000 ms) |
| Runtime session length | 7 minutes 30 seconds 0 millisecond (requested 450000 ms) |
| Down ramp length | 30 seconds 0 millisecond (requested 30000 ms) |
| Total test length | 11 minutes 45 seconds 975 milliseconds |
| State name | % of total | Count | Errors | Minimum Time | Maximum Time | Average Time |
|---|---|---|---|---|---|---|
Home | 10 % | 1471 | 0 | 0 ms | 9133 ms | 2702 ms
|
Register | 1 % | 188 | 0 | 0 ms | 3004 ms | 107 ms
|
RegisterUser | 1 % | 175 | 1 | 5 ms | 9012 ms | 274 ms
|
Browse | 10 % | 1441 | 0 | 0 ms | 8996 ms | 174 ms
|
BrowseCategories | 6 % | 949 | 0 | 3 ms | 9003 ms | 142 ms
|
SearchItemsInCategory | 14 % | 2121 | 0 | 0 ms | 3077 ms | 105 ms
|
BrowseRegions | 2 % | 395 | 0 | 3 ms | 9011 ms | 195 ms
|
BrowseCategoriesInRegion | 2 % | 368 | 0 | 3 ms | 3009 ms | 109 ms
|
SearchItemsInRegion | 4 % | 695 | 0 | 0 ms | 3025 ms | 105 ms
|
ViewItem | 12 % | 1767 | 0 | 4 ms | 3093 ms | 88 ms
|
ViewUserInfo | 2 % | 310 | 0 | 3 ms | 3013 ms | 41 ms
|
ViewBidHistory | 1 % | 151 | 0 | 4 ms | 3022 ms | 84 ms
|
BuyNowAuth | 1 % | 147 | 0 | 2 ms | 2999 ms | 35 ms
|
BuyNow | 0 % | 127 | 18 | 4 ms | 3018 ms | 56 ms
|
StoreBuyBow | 0 % | 95 | 0 | 4 ms | 158 ms | 12 ms
|
PutBidAuth | 3 % | 555 | 0 | 0 ms | 3007 ms | 76 ms
|
PutBid | 3 % | 537 | 67 | 4 ms | 3017 ms | 54 ms
|
StoreBid | 2 % | 293 | 0 | 4 ms | 3019 ms | 60 ms
|
PutCommentAuth | 0 % | 0 | 0 | 0 ms | 0 ms | 0 ms
|
PutComment | 0 % | 39 | 0 | 4 ms | 3005 ms | 90 ms
|
StoreComment | 0 % | 35 | 0 | 4 ms | 3007 ms | 99 ms
|
Sell | 0 % | 101 | 0 | 0 ms | 3004 ms | 129 ms
|
SelectCategoryToSellItem | 0 % | 91 | 0 | 4 ms | 3004 ms | 91 ms
|
SellItemForm | 0 % | 88 | 0 | 2 ms | 3002 ms | 148 ms
|
RegisterItem | 0 % | 82 | 0 | 4 ms | 3002 ms | 55 ms
|
AboutMe (auth form) | 2 % | 295 | 0 | 0 ms | 8991 ms | 244 ms
|
AboutMe | 2 % | 425 | 0 | 9 ms | 3088 ms | 110 ms
|
Back probability | 7 % | 1131 | 0 | 0 ms | 0 ms | 0 ms
|
End of Session | 1 % | 152 | 0 | 0 ms | 0 ms | 0 ms
|
Total | 100 % | 14224 | 86 | - | - | 369 ms
|
Average throughput | 119 req/s
| |||||
Completed sessions | 130
| |||||
Total time | 7154 seconds
| |||||
Average session time | 55 seconds
| |||||
| State name | % of total | Count | Errors | Minimum Time | Maximum Time | Average Time |
|---|---|---|---|---|---|---|
Home | 4 % | 3692 | 0 | 0 ms | 299 ms | 0 ms
|
Register | 1 % | 816 | 0 | 0 ms | 358 ms | 1 ms
|
RegisterUser | 1 % | 785 | 7 | 4 ms | 285 ms | 9 ms
|
Browse | 7 % | 5365 | 0 | 0 ms | 580 ms | 1 ms
|
BrowseCategories | 4 % | 3681 | 0 | 3 ms | 334 ms | 6 ms
|
SearchItemsInCategory | 15 % | 11686 | 0 | 0 ms | 621 ms | 13 ms
|
BrowseRegions | 2 % | 1604 | 0 | 3 ms | 630 ms | 6 ms
|
BrowseCategoriesInRegion | 2 % | 1581 | 0 | 3 ms | 600 ms | 7 ms
|
SearchItemsInRegion | 5 % | 3745 | 0 | 0 ms | 357 ms | 10 ms
|
ViewItem | 14 % | 10425 | 0 | 4 ms | 653 ms | 9 ms
|
ViewUserInfo | 3 % | 2322 | 0 | 4 ms | 396 ms | 8 ms
|
ViewBidHistory | 1 % | 1189 | 0 | 3 ms | 89 ms | 14 ms
|
BuyNowAuth | 1 % | 877 | 0 | 2 ms | 77 ms | 3 ms
|
BuyNow | 1 % | 858 | 137 | 4 ms | 401 ms | 8 ms
|
StoreBuyBow | 0 % | 710 | 0 | 4 ms | 321 ms | 8 ms
|
PutBidAuth | 4 % | 3676 | 0 | 0 ms | 592 ms | 3 ms
|
PutBid | 5 % | 4155 | 560 | 4 ms | 712 ms | 10 ms
|
StoreBid | 3 % | 2662 | 0 | 4 ms | 661 ms | 9 ms
|
PutCommentAuth | 0 % | 0 | 0 | 0 ms | 0 ms | 0 ms
|
PutComment | 0 % | 356 | 27 | 4 ms | 597 ms | 9 ms
|
StoreComment | 0 % | 323 | 0 | 4 ms | 32 ms | 7 ms
|
Sell | 0 % | 434 | 0 | 0 ms | 629 ms | 3 ms
|
SelectCategoryToSellItem | 0 % | 430 | 0 | 4 ms | 28 ms | 6 ms
|
SellItemForm | 0 % | 421 | 0 | 2 ms | 26 ms | 3 ms
|
RegisterItem | 0 % | 412 | 0 | 4 ms | 635 ms | 11 ms
|
AboutMe (auth form) | 1 % | 1293 | 0 | 0 ms | 195 ms | 1 ms
|
AboutMe | 2 % | 2164 | 0 | 8 ms | 542 ms | 21 ms
|
Back probability | 10 % | 7471 | 0 | 0 ms | 0 ms | 0 ms
|
End of Session | 1 % | 1081 | 0 | 0 ms | 0 ms | 0 ms
|
Total | 100 % | 74214 | 731 | - | - | 7 ms
|
Average throughput | 166 req/s
| |||||
Completed sessions | 1087
| |||||
Total time | 261521 seconds
| |||||
Average session time | 240 seconds
| |||||
| State name | % of total | Count | Errors | Minimum Time | Maximum Time | Average Time |
|---|---|---|---|---|---|---|
Home | 5 % | 126 | 0 | 0 ms | 6 ms | 0 ms
|
Register | 0 % | 24 | 0 | 0 ms | 228 ms | 10 ms
|
RegisterUser | 1 % | 28 | 0 | 5 ms | 644 ms | 30 ms
|
Browse | 7 % | 189 | 0 | 0 ms | 597 ms | 9 ms
|
BrowseCategories | 5 % | 127 | 0 | 3 ms | 319 ms | 7 ms
|
SearchItemsInCategory | 15 % | 383 | 0 | 1 ms | 1667 ms | 47 ms
|
BrowseRegions | 2 % | 58 | 0 | 3 ms | 149 ms | 7 ms
|
BrowseCategoriesInRegion | 2 % | 52 | 0 | 3 ms | 77 ms | 6 ms
|
SearchItemsInRegion | 5 % | 126 | 0 | 0 ms | 20 ms | 7 ms
|
ViewItem | 13 % | 316 | 0 | 4 ms | 594 ms | 18 ms
|
ViewUserInfo | 2 % | 68 | 0 | 3 ms | 548 ms | 19 ms
|
ViewBidHistory | 1 % | 39 | 0 | 4 ms | 1137 ms | 52 ms
|
BuyNowAuth | 0 % | 24 | 0 | 2 ms | 9 ms | 3 ms
|
BuyNow | 1 % | 28 | 4 | 4 ms | 18 ms | 5 ms
|
StoreBuyBow | 0 % | 21 | 0 | 4 ms | 20 ms | 7 ms
|
PutBidAuth | 5 % | 125 | 0 | 0 ms | 9 ms | 3 ms
|
PutBid | 6 % | 152 | 22 | 4 ms | 517 ms | 10 ms
|
StoreBid | 3 % | 94 | 0 | 4 ms | 1557 ms | 53 ms
|
PutCommentAuth | 0 % | 0 | 0 | 0 ms | 0 ms | 0 ms
|
PutComment | 0 % | 10 | 0 | 4 ms | 14 ms | 8 ms
|
StoreComment | 0 % | 11 | 0 | 4 ms | 24 ms | 5 ms
|
Sell | 0 % | 10 | 0 | 0 ms | 3 ms | 1 ms
|
SelectCategoryToSellItem | 0 % | 15 | 0 | 4 ms | 511 ms | 39 ms
|
SellItemForm | 0 % | 16 | 0 | 2 ms | 219 ms | 16 ms
|
RegisterItem | 0 % | 16 | 0 | 4 ms | 707 ms | 83 ms
|
AboutMe (auth form) | 1 % | 45 | 0 | 0 ms | 278 ms | 6 ms
|
AboutMe | 2 % | 62 | 0 | 11 ms | 553 ms | 30 ms
|
Back probability | 8 % | 215 | 0 | 0 ms | 0 ms | 0 ms
|
End of Session | 1 % | 38 | 0 | 0 ms | 0 ms | 0 ms
|
Total | 100 % | 2418 | 26 | - | - | 18 ms
|
Average throughput | 81 req/s
| |||||
Completed sessions | 34
| |||||
Total time | 13110 seconds
| |||||
Average session time | 385 seconds
| |||||
| State name | % of total | Count | Errors | Minimum Time | Maximum Time | Average Time |
|---|---|---|---|---|---|---|
Home | 5 % | 5289 | 0 | 0 ms | 9133 ms | 751 ms
|
Register | 1 % | 1028 | 0 | 0 ms | 3004 ms | 20 ms
|
RegisterUser | 1 % | 988 | 8 | 4 ms | 9012 ms | 57 ms
|
Browse | 7 % | 6995 | 0 | 0 ms | 8996 ms | 37 ms
|
BrowseCategories | 5 % | 4757 | 0 | 3 ms | 9003 ms | 33 ms
|
SearchItemsInCategory | 15 % | 14229 | 0 | 0 ms | 3077 ms | 27 ms
|
BrowseRegions | 2 % | 2057 | 0 | 3 ms | 9011 ms | 42 ms
|
BrowseCategoriesInRegion | 2 % | 2001 | 0 | 3 ms | 3009 ms | 26 ms
|
SearchItemsInRegion | 5 % | 4575 | 0 | 0 ms | 3025 ms | 24 ms
|
ViewItem | 13 % | 12530 | 0 | 4 ms | 3093 ms | 21 ms
|
ViewUserInfo | 2 % | 2706 | 0 | 3 ms | 3013 ms | 12 ms
|
ViewBidHistory | 1 % | 1381 | 0 | 3 ms | 3022 ms | 22 ms
|
BuyNowAuth | 1 % | 1048 | 0 | 2 ms | 2999 ms | 7 ms
|
BuyNow | 1 % | 1013 | 159 | 4 ms | 3018 ms | 14 ms
|
StoreBuyBow | 0 % | 826 | 0 | 4 ms | 321 ms | 8 ms
|
PutBidAuth | 4 % | 4356 | 0 | 0 ms | 3007 ms | 12 ms
|
PutBid | 5 % | 4853 | 649 | 4 ms | 3017 ms | 15 ms
|
StoreBid | 3 % | 3049 | 0 | 4 ms | 3019 ms | 15 ms
|
PutCommentAuth | 0 % | 0 | 0 | 0 ms | 0 ms | 0 ms
|
PutComment | 0 % | 405 | 27 | 4 ms | 3005 ms | 17 ms
|
StoreComment | 0 % | 369 | 0 | 4 ms | 3007 ms | 16 ms
|
Sell | 0 % | 545 | 0 | 0 ms | 3004 ms | 26 ms
|
SelectCategoryToSellItem | 0 % | 536 | 0 | 4 ms | 3004 ms | 22 ms
|
SellItemForm | 0 % | 525 | 0 | 2 ms | 3002 ms | 28 ms
|
RegisterItem | 0 % | 510 | 0 | 4 ms | 3002 ms | 20 ms
|
AboutMe (auth form) | 1 % | 1633 | 0 | 0 ms | 8991 ms | 45 ms
|
AboutMe | 2 % | 2664 | 0 | 8 ms | 3088 ms | 35 ms
|
Back probability | 9 % | 8817 | 0 | 0 ms | 0 ms | 0 ms
|
End of Session | 1 % | 1271 | 0 | 0 ms | 0 ms | 0 ms
|
Total | 100 % | 90956 | 843 | - | - | 64 ms
|
Average throughput | 152 req/s
| |||||
Completed sessions | 1271
| |||||
Total time | 288597 seconds
| |||||
Average session time | 227 seconds
| |||||
An error occured while waiting for remote processes termination (Skipping waits)
Command is: /usr/bin/scp farm6.csail.mit.edu:/tmp/client1 /home/drkp/sandbox/txcache/src/RUBiS-1.4.3/bench/2009-3-19@19:26:59//client1.bin
Command is: /usr/bin/ssh -x localhost /bin/bash -c 'LANG=en_GB.UTF-8 /usr/bin/sar -n DEV -n SOCK -rubcw 1 605 -f /home/drkp/sandbox/txcache/src/RUBiS-1.4.3/bench/2009-3-19@19:26:59//client1.bin > /home/drkp/sandbox/txcache/src/RUBiS-1.4.3/bench/2009-3-19@19:26:59//client1'
Command is: /usr/bin/scp farm14:/tmp/db_server0 /home/drkp/sandbox/txcache/src/RUBiS-1.4.3/bench/2009-3-19@19:26:59//db_server0.bin
Command is: /usr/bin/ssh -x localhost /bin/bash -c 'LANG=en_GB.UTF-8 /usr/bin/sar -n DEV -n SOCK -rubcw 1 605 -f /home/drkp/sandbox/txcache/src/RUBiS-1.4.3/bench/2009-3-19@19:26:59//db_server0.bin > /home/drkp/sandbox/txcache/src/RUBiS-1.4.3/bench/2009-3-19@19:26:59//db_server0'
Command is: /usr/bin/scp farm12.csail.mit.edu:/tmp/web_server0 /home/drkp/sandbox/txcache/src/RUBiS-1.4.3/bench/2009-3-19@19:26:59//web_server0.bin
Command is: /usr/bin/ssh -x localhost /bin/bash -c 'LANG=en_GB.UTF-8 /usr/bin/sar -n DEV -n SOCK -rubcw 1 605 -f /home/drkp/sandbox/txcache/src/RUBiS-1.4.3/bench/2009-3-19@19:26:59//web_server0.bin > /home/drkp/sandbox/txcache/src/RUBiS-1.4.3/bench/2009-3-19@19:26:59//web_server0'
Command is: /usr/bin/scp farm13.csail.mit.edu:/tmp/web_server1 /home/drkp/sandbox/txcache/src/RUBiS-1.4.3/bench/2009-3-19@19:26:59//web_server1.bin
Command is: /usr/bin/ssh -x localhost /bin/bash -c 'LANG=en_GB.UTF-8 /usr/bin/sar -n DEV -n SOCK -rubcw 1 605 -f /home/drkp/sandbox/txcache/src/RUBiS-1.4.3/bench/2009-3-19@19:26:59//web_server1.bin > /home/drkp/sandbox/txcache/src/RUBiS-1.4.3/bench/2009-3-19@19:26:59//web_server1'
Command is: /usr/bin/scp localhost:/tmp/client0 /home/drkp/sandbox/txcache/src/RUBiS-1.4.3/bench/2009-3-19@19:26:59//client0.bin
Command is: /usr/bin/ssh -x localhost /bin/bash -c 'LANG=en_GB.UTF-8 /usr/bin/sar -n DEV -n SOCK -rubcw 1 605 -f /home/drkp/sandbox/txcache/src/RUBiS-1.4.3/bench/2009-3-19@19:26:59//client0.bin > /home/drkp/sandbox/txcache/src/RUBiS-1.4.3/bench/2009-3-19@19:26:59//client0'
Command is: /usr/bin/scp farm6.csail.mit.edu:/tmp/trace_client1.html /home/drkp/sandbox/txcache/src/RUBiS-1.4.3/bench/2009-3-19@19:26:59//
Command is: /usr/bin/scp farm6.csail.mit.edu:/tmp/stat_client1.html /home/drkp/sandbox/txcache/src/RUBiS-1.4.3/bench/2009-3-19@19:26:59//
|
|
|
|
|
|
 | 
|
 | 
|
 | 
|
 | 
|
 | 
|
 | 
|
 | 
|
 | 
|
 | 
|