Node information
Test timing information
Up ramp statistics
Runtime session statistics
Down ramp statistics
Overall statistics
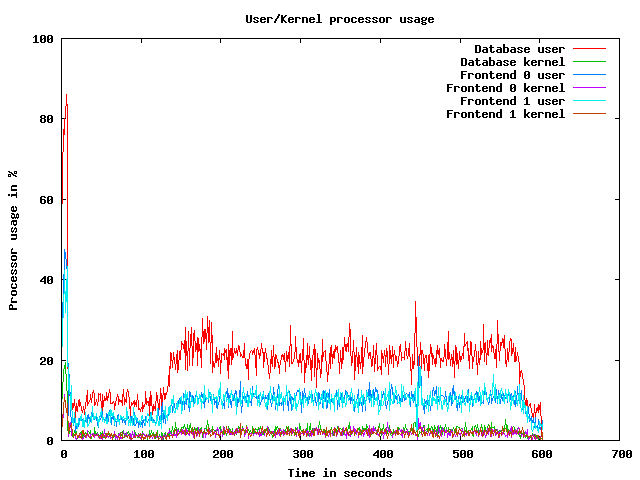
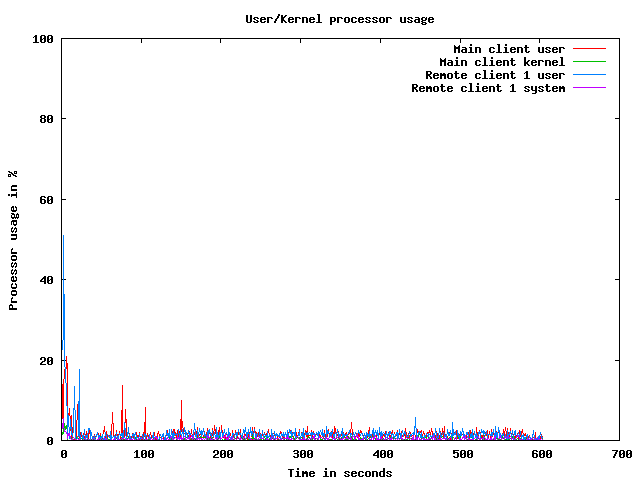
CPU usage graphs
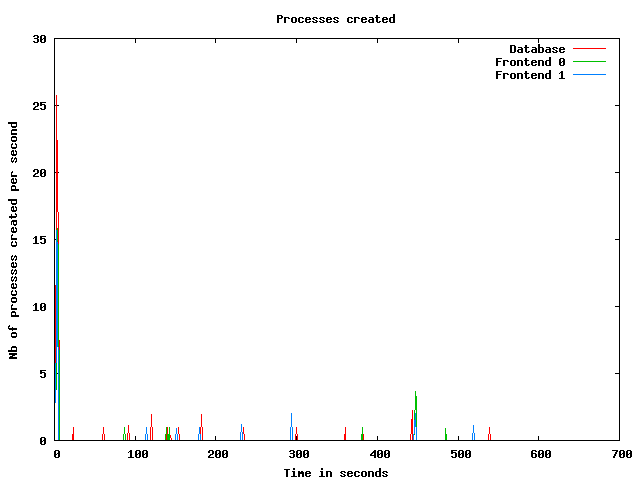
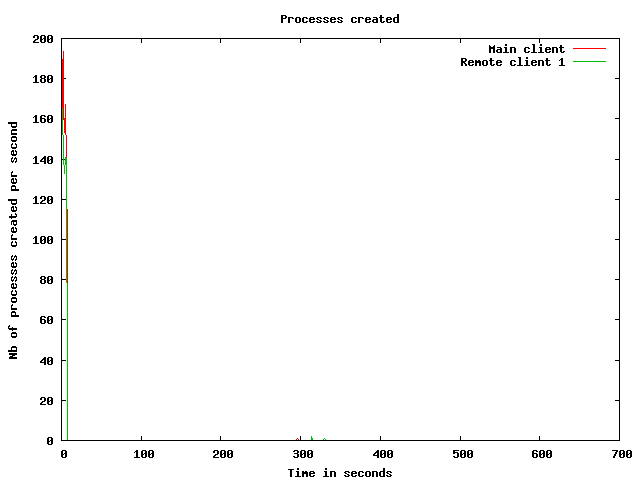
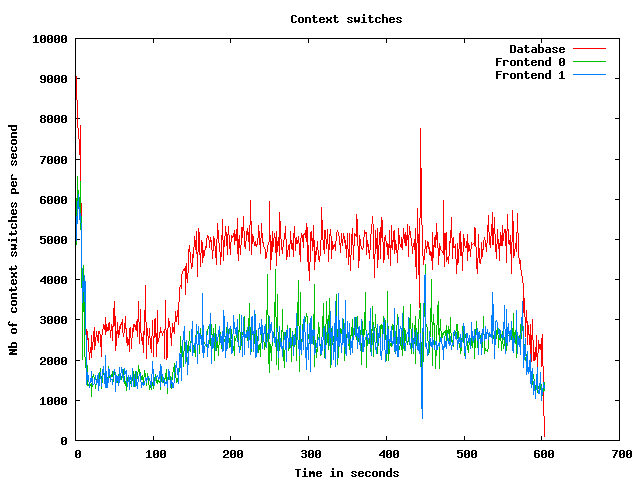
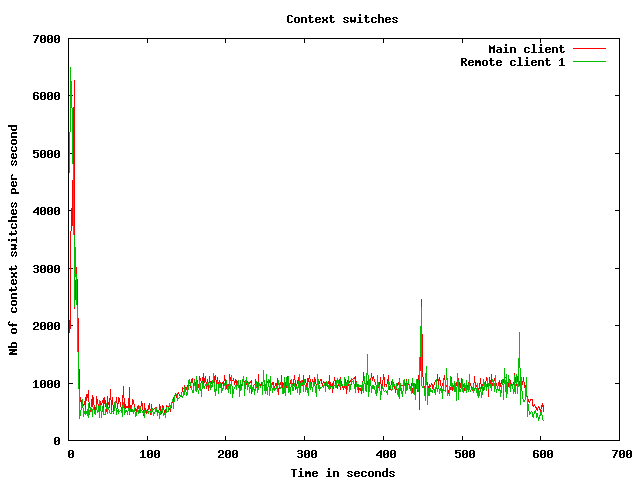
Processes usage graphs
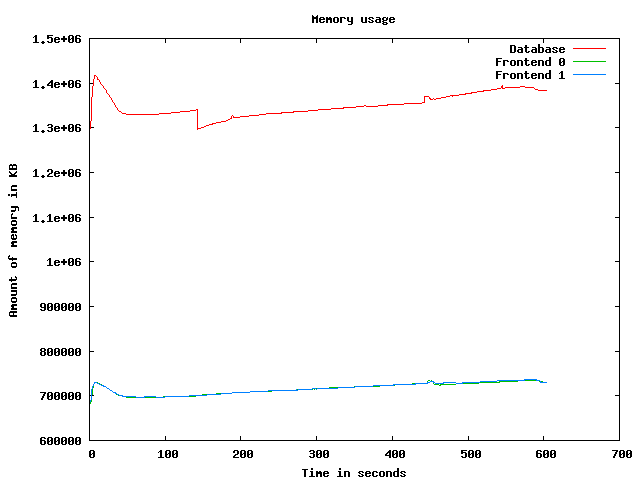
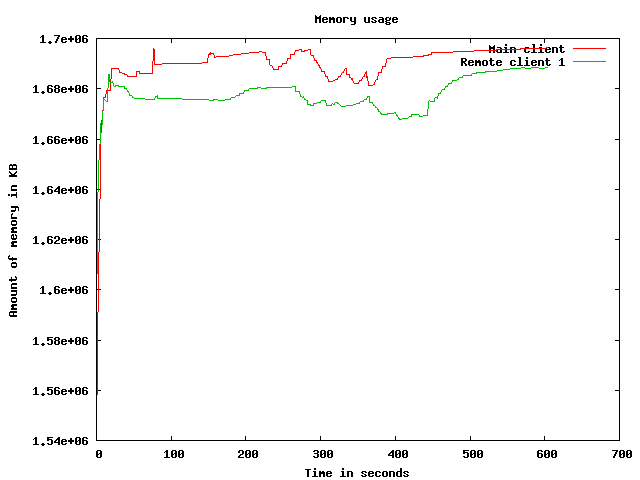
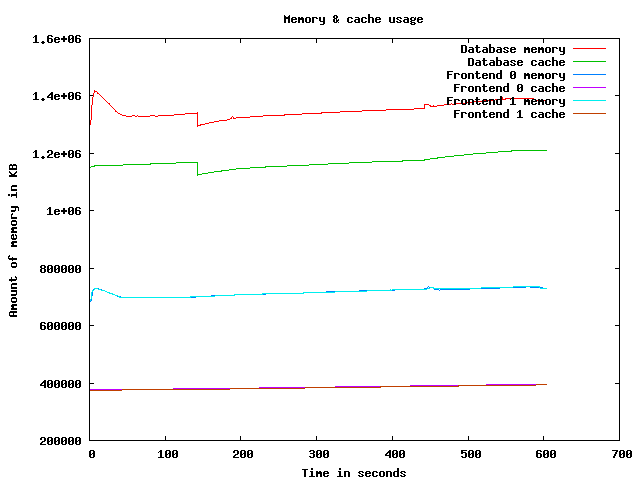
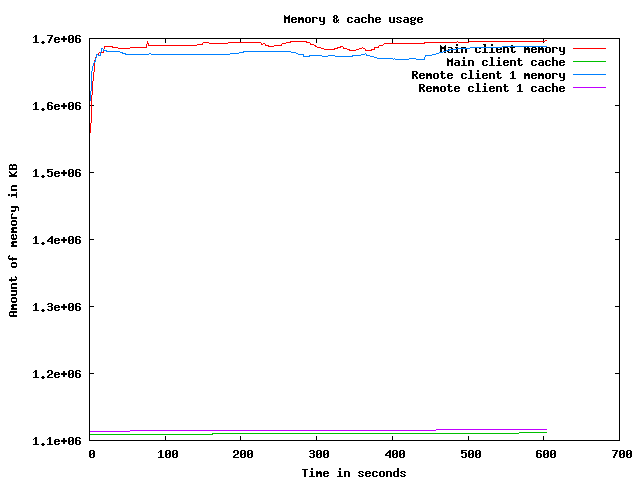
Memory usage graph
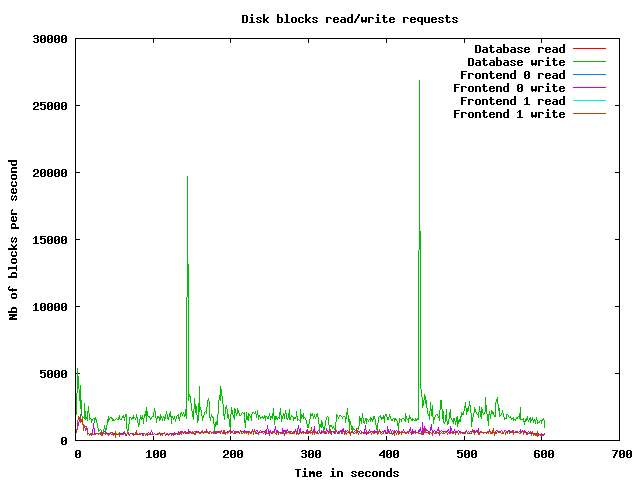
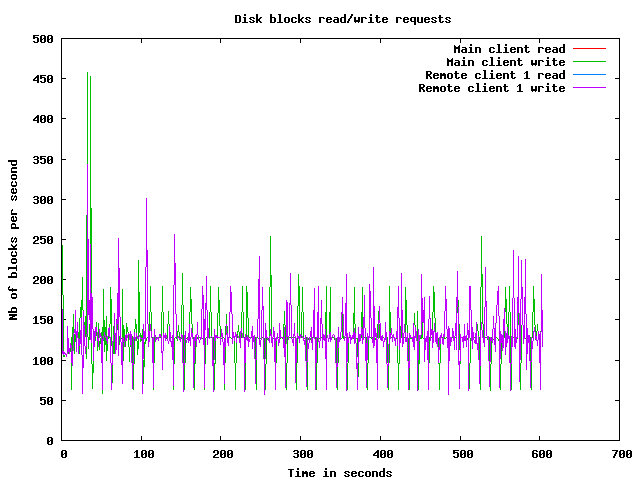
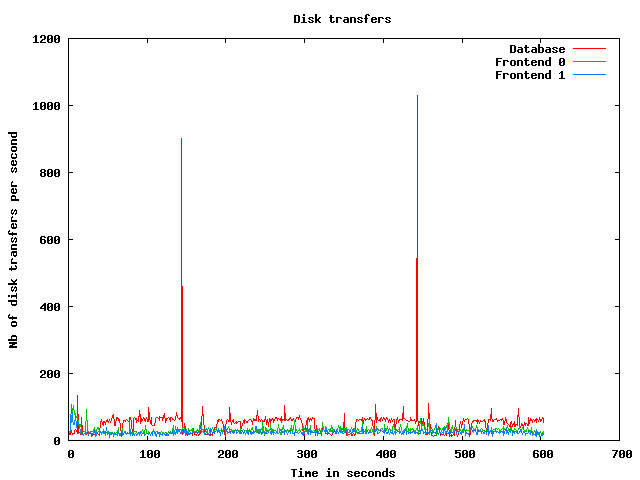
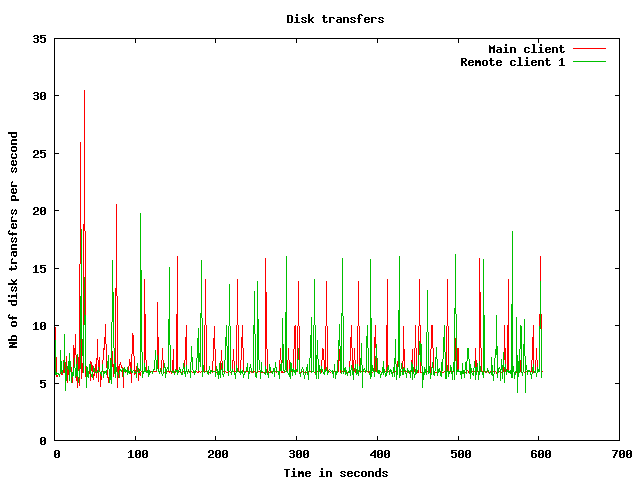
Disk usage graphs
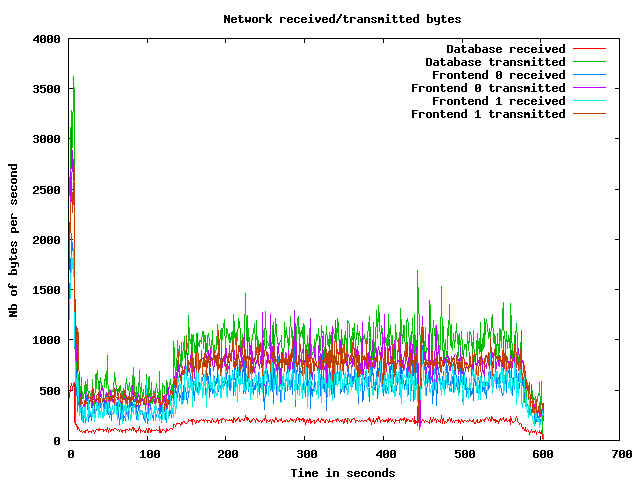
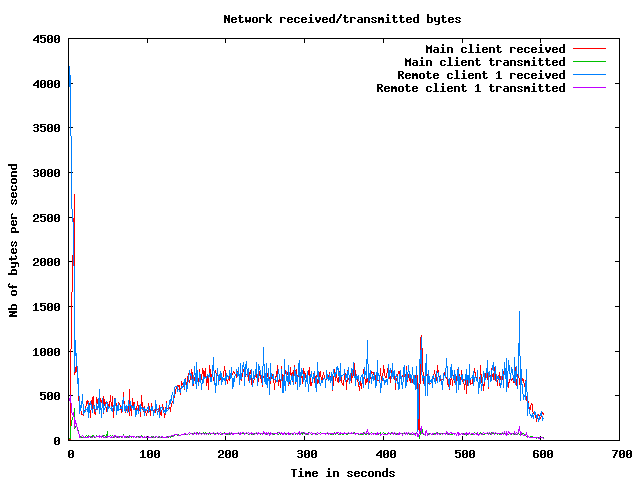
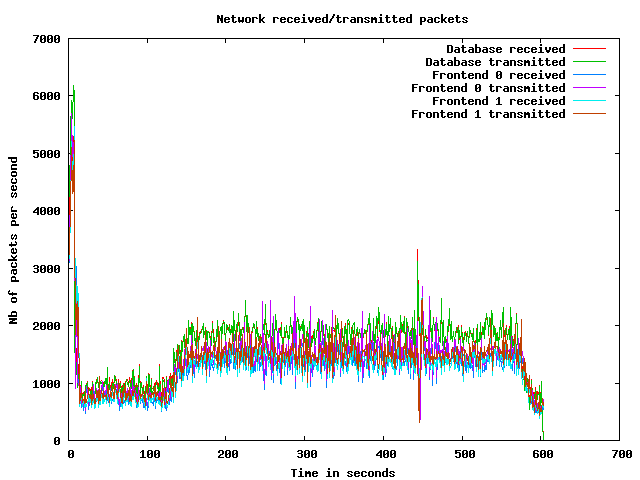
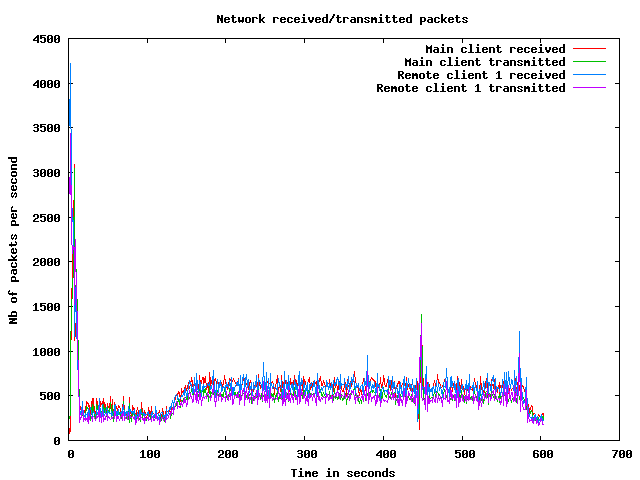
Network usage graphs
| Test start | 2009-3-19 19:39:27 |
| Up ramp start | 2009-3-19 19:39:36 |
| Runtime session start | 2009-3-19 19:41:36 |
| Down ramp start | 2009-3-19 19:49:6 |
| Test end | 2009-3-19 19:51:11 |
| Up ramp length | 2 minutes 0 millisecond (requested 120000 ms) |
| Runtime session length | 7 minutes 30 seconds 0 millisecond (requested 450000 ms) |
| Down ramp length | 30 seconds 1 millisecond (requested 30000 ms) |
| Total test length | 11 minutes 43 seconds 812 milliseconds |
| State name | % of total | Count | Errors | Minimum Time | Maximum Time | Average Time |
|---|---|---|---|---|---|---|
Home | 11 % | 1875 | 0 | 0 ms | 9824 ms | 2877 ms
|
Register | 1 % | 238 | 0 | 0 ms | 9007 ms | 423 ms
|
RegisterUser | 1 % | 206 | 3 | 5 ms | 9014 ms | 216 ms
|
Browse | 10 % | 1775 | 0 | 0 ms | 9014 ms | 381 ms
|
BrowseCategories | 6 % | 1156 | 0 | 3 ms | 9016 ms | 225 ms
|
SearchItemsInCategory | 14 % | 2421 | 0 | 0 ms | 9032 ms | 166 ms
|
BrowseRegions | 2 % | 494 | 0 | 3 ms | 9008 ms | 307 ms
|
BrowseCategoriesInRegion | 2 % | 457 | 0 | 3 ms | 9021 ms | 177 ms
|
SearchItemsInRegion | 5 % | 881 | 0 | 0 ms | 9006 ms | 95 ms
|
ViewItem | 12 % | 2076 | 0 | 4 ms | 9011 ms | 94 ms
|
ViewUserInfo | 1 % | 334 | 0 | 3 ms | 3014 ms | 36 ms
|
ViewBidHistory | 1 % | 178 | 0 | 4 ms | 3324 ms | 48 ms
|
BuyNowAuth | 1 % | 186 | 0 | 2 ms | 3023 ms | 99 ms
|
BuyNow | 0 % | 168 | 25 | 4 ms | 9005 ms | 81 ms
|
StoreBuyBow | 0 % | 112 | 0 | 4 ms | 3003 ms | 34 ms
|
PutBidAuth | 4 % | 720 | 0 | 0 ms | 9000 ms | 51 ms
|
PutBid | 3 % | 659 | 99 | 0 ms | 3173 ms | 61 ms
|
StoreBid | 2 % | 375 | 0 | 4 ms | 3024 ms | 39 ms
|
PutCommentAuth | 0 % | 0 | 0 | 0 ms | 0 ms | 0 ms
|
PutComment | 0 % | 56 | 6 | 4 ms | 3026 ms | 113 ms
|
StoreComment | 0 % | 44 | 0 | 5 ms | 26 ms | 7 ms
|
Sell | 0 % | 125 | 0 | 0 ms | 9002 ms | 305 ms
|
SelectCategoryToSellItem | 0 % | 113 | 0 | 4 ms | 9004 ms | 375 ms
|
SellItemForm | 0 % | 97 | 0 | 2 ms | 3005 ms | 34 ms
|
RegisterItem | 0 % | 81 | 0 | 4 ms | 8995 ms | 236 ms
|
AboutMe (auth form) | 2 % | 382 | 0 | 0 ms | 9004 ms | 305 ms
|
AboutMe | 2 % | 483 | 0 | 9 ms | 9015 ms | 198 ms
|
Back probability | 6 % | 1182 | 0 | 0 ms | 0 ms | 0 ms
|
End of Session | 0 % | 157 | 0 | 0 ms | 0 ms | 0 ms
|
Total | 100 % | 17031 | 133 | - | - | 458 ms
|
Average throughput | 143 req/s
| |||||
Completed sessions | 140
| |||||
Total time | 8750 seconds
| |||||
Average session time | 62 seconds
| |||||
| State name | % of total | Count | Errors | Minimum Time | Maximum Time | Average Time |
|---|---|---|---|---|---|---|
Home | 4 % | 4399 | 0 | 0 ms | 3003 ms | 2 ms
|
Register | 1 % | 949 | 0 | 0 ms | 3000 ms | 17 ms
|
RegisterUser | 1 % | 929 | 7 | 4 ms | 3022 ms | 28 ms
|
Browse | 7 % | 6678 | 0 | 0 ms | 3002 ms | 9 ms
|
BrowseCategories | 5 % | 4670 | 0 | 3 ms | 3022 ms | 15 ms
|
SearchItemsInCategory | 15 % | 14392 | 0 | 0 ms | 3038 ms | 28 ms
|
BrowseRegions | 2 % | 1933 | 0 | 3 ms | 3005 ms | 16 ms
|
BrowseCategoriesInRegion | 2 % | 1894 | 0 | 3 ms | 3014 ms | 18 ms
|
SearchItemsInRegion | 4 % | 4578 | 0 | 0 ms | 3020 ms | 19 ms
|
ViewItem | 14 % | 12946 | 0 | 4 ms | 3050 ms | 21 ms
|
ViewUserInfo | 3 % | 2999 | 0 | 3 ms | 3014 ms | 19 ms
|
ViewBidHistory | 1 % | 1502 | 0 | 3 ms | 3027 ms | 26 ms
|
BuyNowAuth | 1 % | 1198 | 0 | 2 ms | 3007 ms | 12 ms
|
BuyNow | 1 % | 1176 | 198 | 4 ms | 3014 ms | 13 ms
|
StoreBuyBow | 1 % | 970 | 0 | 4 ms | 3006 ms | 21 ms
|
PutBidAuth | 4 % | 4479 | 0 | 0 ms | 3014 ms | 13 ms
|
PutBid | 5 % | 5115 | 645 | 4 ms | 3024 ms | 18 ms
|
StoreBid | 3 % | 3307 | 1 | 4 ms | 3008 ms | 16 ms
|
PutCommentAuth | 0 % | 0 | 0 | 0 ms | 0 ms | 0 ms
|
PutComment | 0 % | 442 | 41 | 4 ms | 3009 ms | 24 ms
|
StoreComment | 0 % | 396 | 0 | 4 ms | 31 ms | 9 ms
|
Sell | 0 % | 526 | 0 | 0 ms | 11 ms | 0 ms
|
SelectCategoryToSellItem | 0 % | 518 | 0 | 4 ms | 3006 ms | 13 ms
|
SellItemForm | 0 % | 517 | 0 | 2 ms | 3001 ms | 23 ms
|
RegisterItem | 0 % | 517 | 0 | 4 ms | 3008 ms | 14 ms
|
AboutMe (auth form) | 1 % | 1609 | 0 | 0 ms | 2235 ms | 4 ms
|
AboutMe | 2 % | 2720 | 0 | 8 ms | 3050 ms | 34 ms
|
Back probability | 10 % | 9357 | 0 | 0 ms | 0 ms | 0 ms
|
End of Session | 1 % | 1284 | 0 | 0 ms | 0 ms | 0 ms
|
Total | 100 % | 92000 | 892 | - | - | 16 ms
|
Average throughput | 206 req/s
| |||||
Completed sessions | 1281
| |||||
Total time | 316044 seconds
| |||||
Average session time | 246 seconds
| |||||
| State name | % of total | Count | Errors | Minimum Time | Maximum Time | Average Time |
|---|---|---|---|---|---|---|
Home | 4 % | 133 | 0 | 0 ms | 3 ms | 0 ms
|
Register | 1 % | 41 | 0 | 0 ms | 5 ms | 0 ms
|
RegisterUser | 1 % | 40 | 1 | 4 ms | 17 ms | 6 ms
|
Browse | 7 % | 224 | 0 | 0 ms | 17 ms | 0 ms
|
BrowseCategories | 4 % | 147 | 0 | 3 ms | 34 ms | 6 ms
|
SearchItemsInCategory | 15 % | 479 | 0 | 0 ms | 51 ms | 15 ms
|
BrowseRegions | 2 % | 72 | 0 | 3 ms | 21 ms | 5 ms
|
BrowseCategoriesInRegion | 2 % | 67 | 0 | 3 ms | 17 ms | 5 ms
|
SearchItemsInRegion | 4 % | 150 | 0 | 0 ms | 52 ms | 9 ms
|
ViewItem | 14 % | 455 | 0 | 4 ms | 33 ms | 7 ms
|
ViewUserInfo | 3 % | 96 | 0 | 3 ms | 19 ms | 6 ms
|
ViewBidHistory | 1 % | 52 | 0 | 4 ms | 25 ms | 9 ms
|
BuyNowAuth | 1 % | 43 | 0 | 2 ms | 6 ms | 2 ms
|
BuyNow | 1 % | 39 | 4 | 4 ms | 16 ms | 6 ms
|
StoreBuyBow | 1 % | 35 | 0 | 4 ms | 10 ms | 5 ms
|
PutBidAuth | 4 % | 146 | 0 | 0 ms | 10 ms | 2 ms
|
PutBid | 5 % | 168 | 22 | 4 ms | 33 ms | 8 ms
|
StoreBid | 3 % | 114 | 0 | 4 ms | 29 ms | 6 ms
|
PutCommentAuth | 0 % | 0 | 0 | 0 ms | 0 ms | 0 ms
|
PutComment | 0 % | 12 | 0 | 4 ms | 27 ms | 8 ms
|
StoreComment | 0 % | 11 | 0 | 4 ms | 14 ms | 7 ms
|
Sell | 0 % | 20 | 0 | 0 ms | 1 ms | 0 ms
|
SelectCategoryToSellItem | 0 % | 18 | 0 | 4 ms | 14 ms | 4 ms
|
SellItemForm | 0 % | 15 | 0 | 2 ms | 3 ms | 3 ms
|
RegisterItem | 0 % | 18 | 0 | 4 ms | 17 ms | 11 ms
|
AboutMe (auth form) | 1 % | 54 | 0 | 0 ms | 1 ms | 0 ms
|
AboutMe | 2 % | 92 | 0 | 8 ms | 43 ms | 18 ms
|
Back probability | 10 % | 319 | 0 | 0 ms | 0 ms | 0 ms
|
End of Session | 1 % | 45 | 0 | 0 ms | 0 ms | 0 ms
|
Total | 100 % | 3105 | 27 | - | - | 6 ms
|
Average throughput | 104 req/s
| |||||
Completed sessions | 43
| |||||
Total time | 14479 seconds
| |||||
Average session time | 336 seconds
| |||||
| State name | % of total | Count | Errors | Minimum Time | Maximum Time | Average Time |
|---|---|---|---|---|---|---|
Home | 5 % | 6407 | 0 | 0 ms | 9824 ms | 844 ms
|
Register | 1 % | 1228 | 0 | 0 ms | 9007 ms | 95 ms
|
RegisterUser | 1 % | 1175 | 11 | 4 ms | 9014 ms | 60 ms
|
Browse | 7 % | 8677 | 0 | 0 ms | 9014 ms | 85 ms
|
BrowseCategories | 5 % | 5973 | 0 | 3 ms | 9016 ms | 55 ms
|
SearchItemsInCategory | 15 % | 17362 | 0 | 0 ms | 9032 ms | 47 ms
|
BrowseRegions | 2 % | 2499 | 0 | 3 ms | 9008 ms | 73 ms
|
BrowseCategoriesInRegion | 2 % | 2418 | 0 | 3 ms | 9021 ms | 48 ms
|
SearchItemsInRegion | 5 % | 5615 | 0 | 0 ms | 9006 ms | 31 ms
|
ViewItem | 13 % | 15499 | 0 | 4 ms | 9011 ms | 30 ms
|
ViewUserInfo | 3 % | 3436 | 0 | 3 ms | 3014 ms | 21 ms
|
ViewBidHistory | 1 % | 1737 | 0 | 3 ms | 3324 ms | 28 ms
|
BuyNowAuth | 1 % | 1427 | 0 | 2 ms | 3023 ms | 23 ms
|
BuyNow | 1 % | 1383 | 227 | 4 ms | 9005 ms | 21 ms
|
StoreBuyBow | 0 % | 1117 | 0 | 4 ms | 3006 ms | 22 ms
|
PutBidAuth | 4 % | 5345 | 0 | 0 ms | 9000 ms | 18 ms
|
PutBid | 5 % | 5962 | 766 | 0 ms | 3173 ms | 22 ms
|
StoreBid | 3 % | 3796 | 1 | 4 ms | 3024 ms | 18 ms
|
PutCommentAuth | 0 % | 0 | 0 | 0 ms | 0 ms | 0 ms
|
PutComment | 0 % | 510 | 47 | 4 ms | 3026 ms | 33 ms
|
StoreComment | 0 % | 451 | 0 | 4 ms | 31 ms | 9 ms
|
Sell | 0 % | 671 | 0 | 0 ms | 9002 ms | 57 ms
|
SelectCategoryToSellItem | 0 % | 649 | 0 | 4 ms | 9004 ms | 76 ms
|
SellItemForm | 0 % | 629 | 0 | 2 ms | 3005 ms | 24 ms
|
RegisterItem | 0 % | 616 | 0 | 4 ms | 8995 ms | 43 ms
|
AboutMe (auth form) | 1 % | 2045 | 0 | 0 ms | 9004 ms | 60 ms
|
AboutMe | 2 % | 3317 | 0 | 8 ms | 9015 ms | 57 ms
|
Back probability | 9 % | 10858 | 0 | 0 ms | 0 ms | 0 ms
|
End of Session | 1 % | 1486 | 0 | 0 ms | 0 ms | 0 ms
|
Total | 100 % | 112288 | 1052 | - | - | 83 ms
|
Average throughput | 188 req/s
| |||||
Completed sessions | 1485
| |||||
Total time | 347022 seconds
| |||||
Average session time | 233 seconds
| |||||
An error occured while waiting for remote processes termination (Skipping waits)
Command is: /usr/bin/scp farm6.csail.mit.edu:/tmp/client1 /home/drkp/sandbox/txcache/src/RUBiS-1.4.3/bench/2009-3-19@19:39:27//client1.bin
Command is: /usr/bin/ssh -x localhost /bin/bash -c 'LANG=en_GB.UTF-8 /usr/bin/sar -n DEV -n SOCK -rubcw 1 605 -f /home/drkp/sandbox/txcache/src/RUBiS-1.4.3/bench/2009-3-19@19:39:27//client1.bin > /home/drkp/sandbox/txcache/src/RUBiS-1.4.3/bench/2009-3-19@19:39:27//client1'
Command is: /usr/bin/scp farm14:/tmp/db_server0 /home/drkp/sandbox/txcache/src/RUBiS-1.4.3/bench/2009-3-19@19:39:27//db_server0.bin
Command is: /usr/bin/ssh -x localhost /bin/bash -c 'LANG=en_GB.UTF-8 /usr/bin/sar -n DEV -n SOCK -rubcw 1 605 -f /home/drkp/sandbox/txcache/src/RUBiS-1.4.3/bench/2009-3-19@19:39:27//db_server0.bin > /home/drkp/sandbox/txcache/src/RUBiS-1.4.3/bench/2009-3-19@19:39:27//db_server0'
Command is: /usr/bin/scp farm12.csail.mit.edu:/tmp/web_server0 /home/drkp/sandbox/txcache/src/RUBiS-1.4.3/bench/2009-3-19@19:39:27//web_server0.bin
Command is: /usr/bin/ssh -x localhost /bin/bash -c 'LANG=en_GB.UTF-8 /usr/bin/sar -n DEV -n SOCK -rubcw 1 605 -f /home/drkp/sandbox/txcache/src/RUBiS-1.4.3/bench/2009-3-19@19:39:27//web_server0.bin > /home/drkp/sandbox/txcache/src/RUBiS-1.4.3/bench/2009-3-19@19:39:27//web_server0'
Command is: /usr/bin/scp farm13.csail.mit.edu:/tmp/web_server1 /home/drkp/sandbox/txcache/src/RUBiS-1.4.3/bench/2009-3-19@19:39:27//web_server1.bin
Command is: /usr/bin/ssh -x localhost /bin/bash -c 'LANG=en_GB.UTF-8 /usr/bin/sar -n DEV -n SOCK -rubcw 1 605 -f /home/drkp/sandbox/txcache/src/RUBiS-1.4.3/bench/2009-3-19@19:39:27//web_server1.bin > /home/drkp/sandbox/txcache/src/RUBiS-1.4.3/bench/2009-3-19@19:39:27//web_server1'
Command is: /usr/bin/scp localhost:/tmp/client0 /home/drkp/sandbox/txcache/src/RUBiS-1.4.3/bench/2009-3-19@19:39:27//client0.bin
Command is: /usr/bin/ssh -x localhost /bin/bash -c 'LANG=en_GB.UTF-8 /usr/bin/sar -n DEV -n SOCK -rubcw 1 605 -f /home/drkp/sandbox/txcache/src/RUBiS-1.4.3/bench/2009-3-19@19:39:27//client0.bin > /home/drkp/sandbox/txcache/src/RUBiS-1.4.3/bench/2009-3-19@19:39:27//client0'
Command is: /usr/bin/scp farm6.csail.mit.edu:/tmp/trace_client1.html /home/drkp/sandbox/txcache/src/RUBiS-1.4.3/bench/2009-3-19@19:39:27//
Command is: /usr/bin/scp farm6.csail.mit.edu:/tmp/stat_client1.html /home/drkp/sandbox/txcache/src/RUBiS-1.4.3/bench/2009-3-19@19:39:27//
|
|
|
|
|
|
 | 
|
 | 
|
 | 
|
 | 
|
 | 
|
 | 
|
 | 
|
 | 
|
 | 
|