Node information
Test timing information
Up ramp statistics
Runtime session statistics
Down ramp statistics
Overall statistics
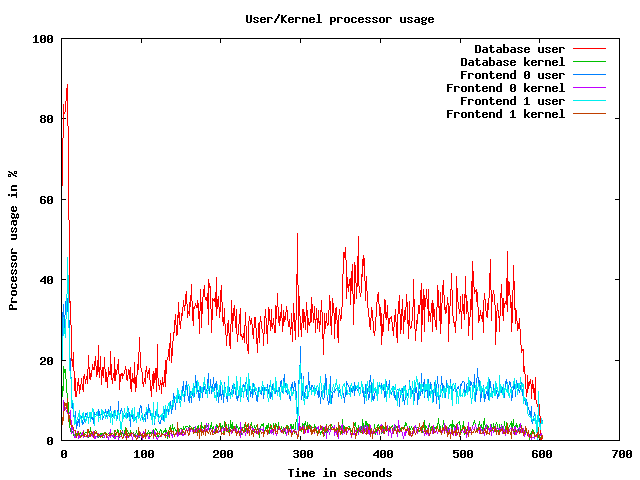
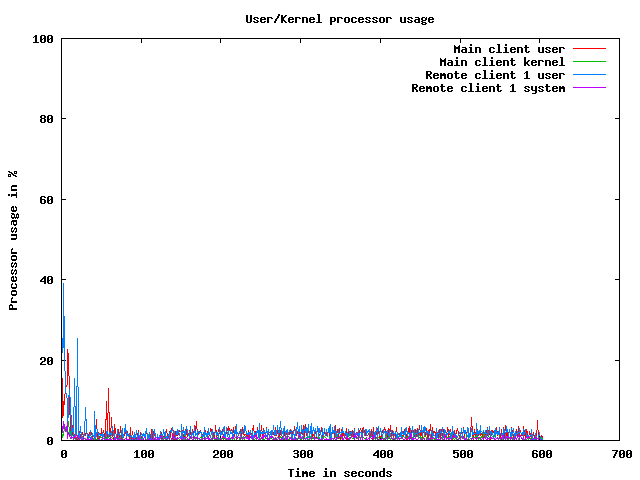
CPU usage graphs
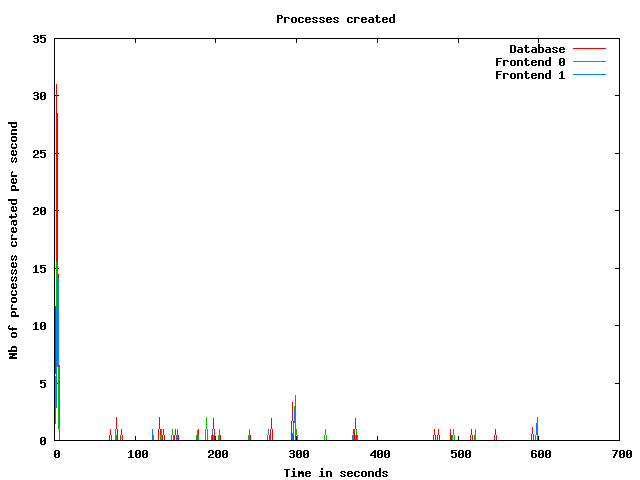
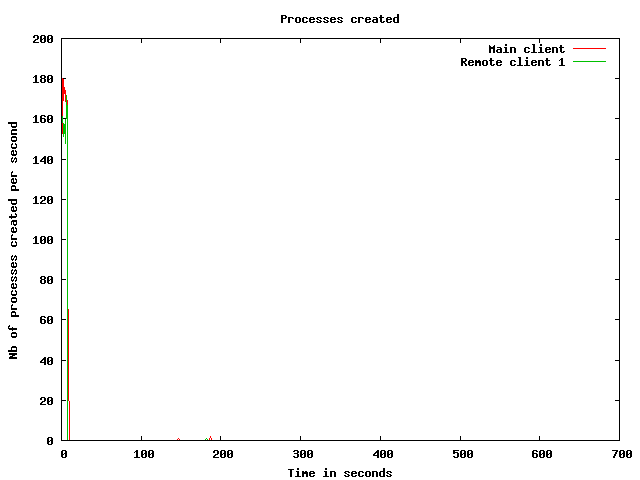
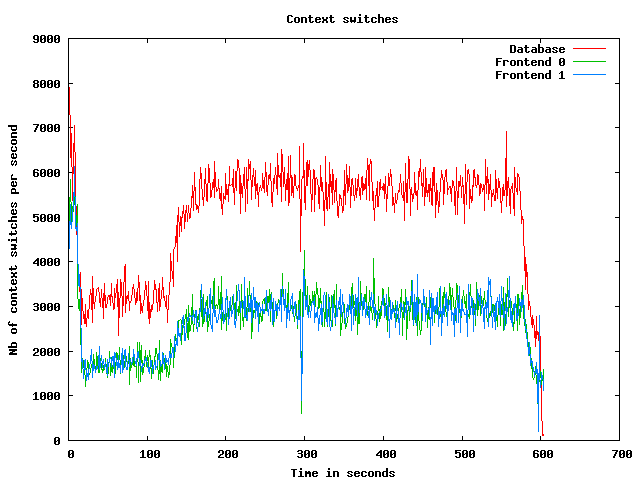
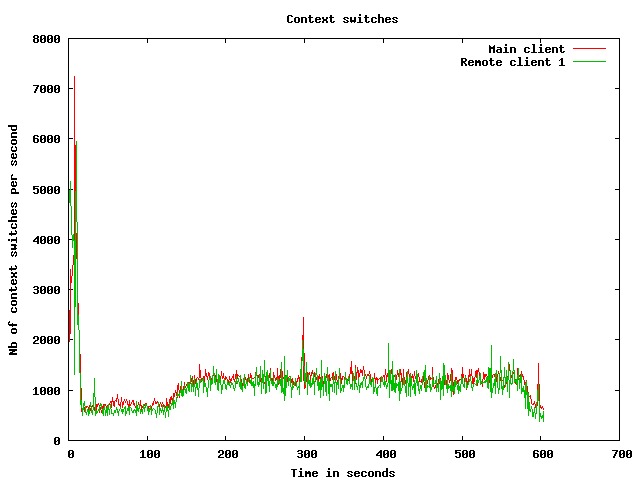
Processes usage graphs
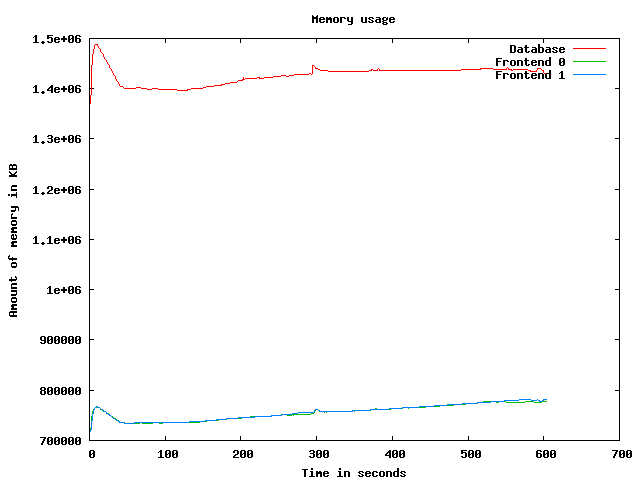
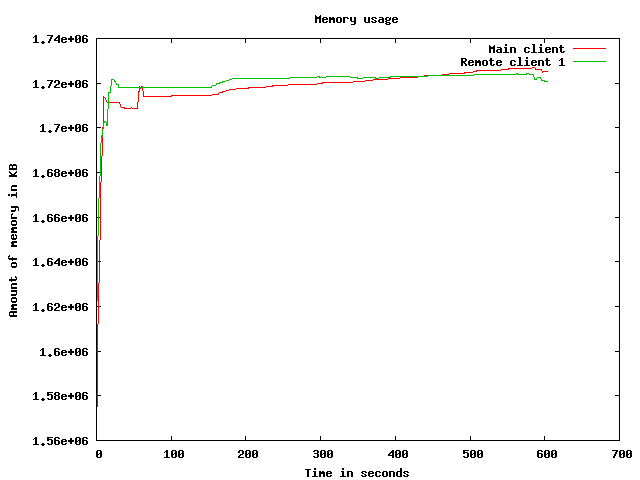
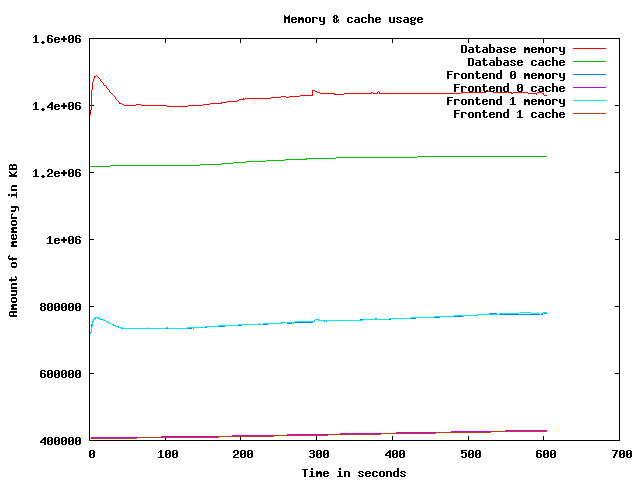
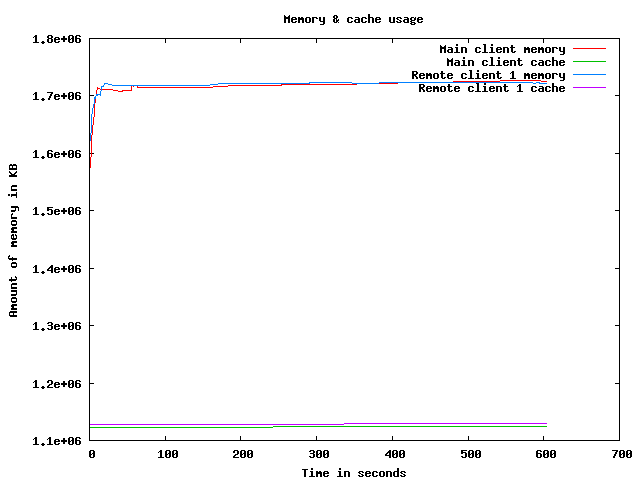
Memory usage graph
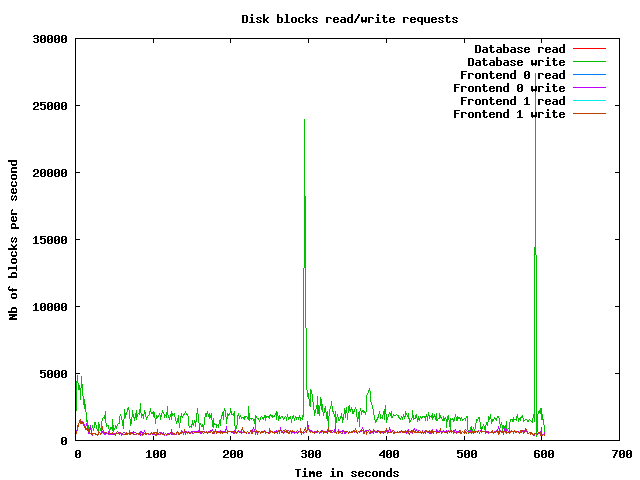
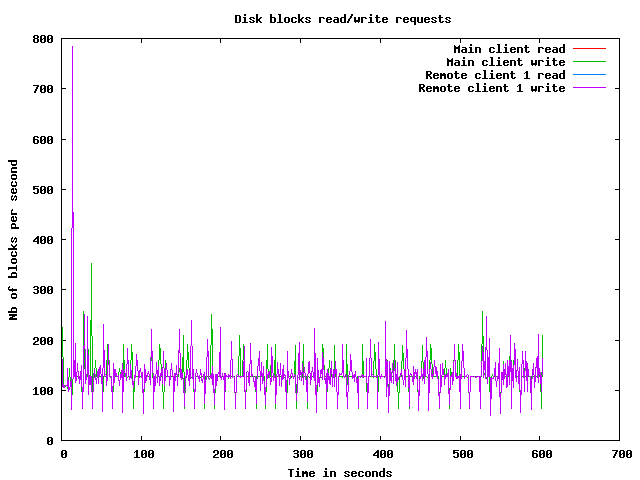
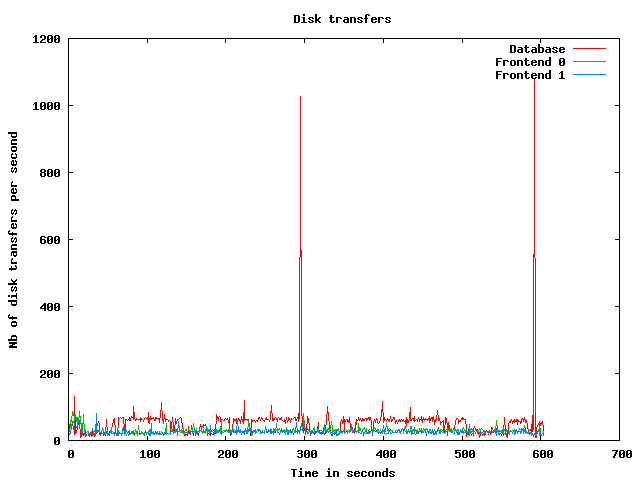
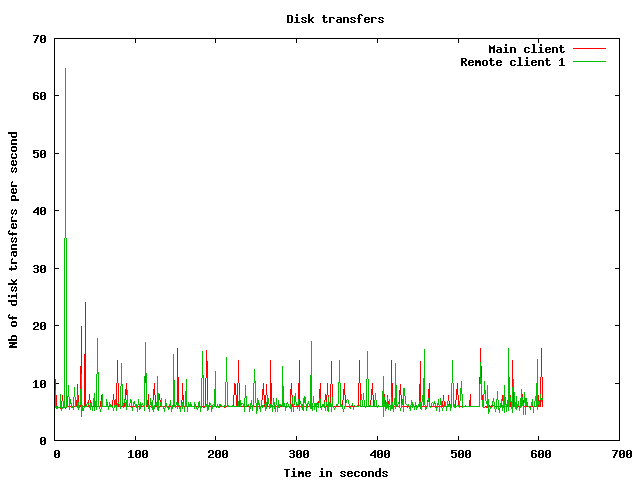
Disk usage graphs
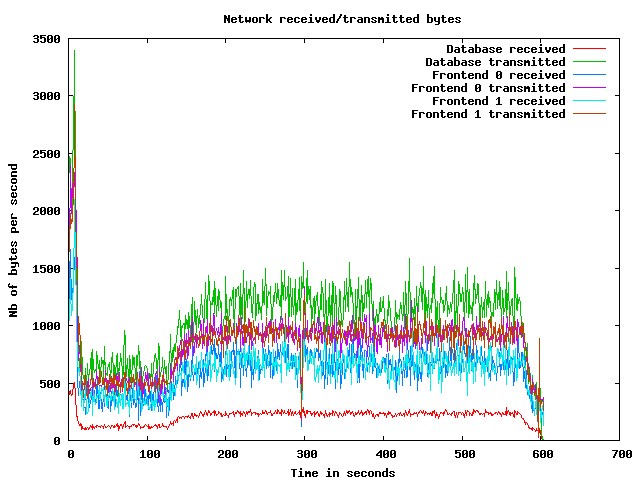
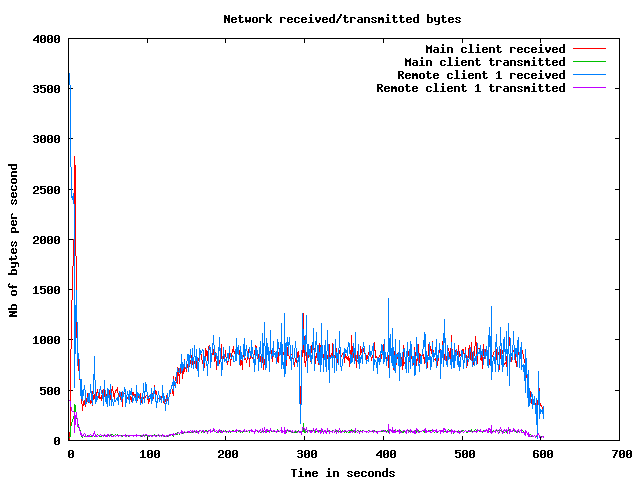
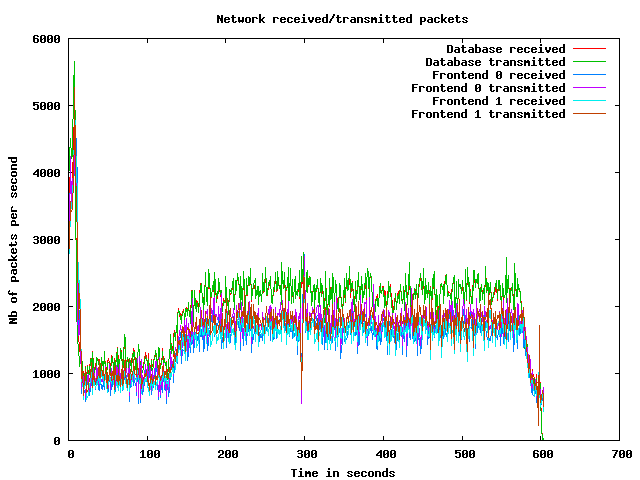
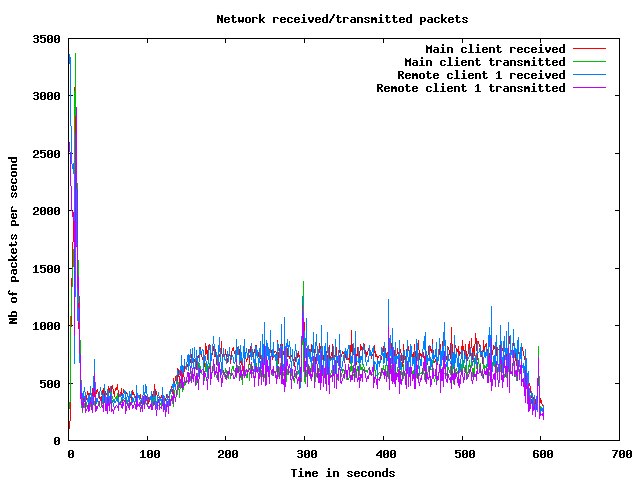
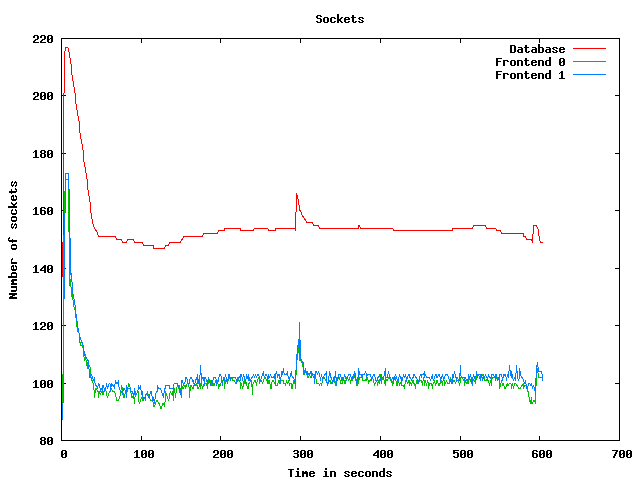
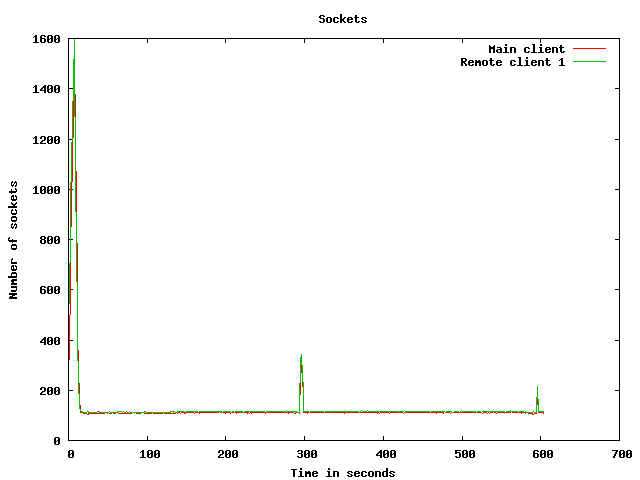
Network usage graphs
| Test start | 2009-3-19 19:51:56 |
| Up ramp start | 2009-3-19 19:52:7 |
| Runtime session start | 2009-3-19 19:54:7 |
| Down ramp start | 2009-3-19 20:1:37 |
| Test end | 2009-3-19 20:3:55 |
| Up ramp length | 2 minutes 1 millisecond (requested 120000 ms) |
| Runtime session length | 7 minutes 30 seconds 0 millisecond (requested 450000 ms) |
| Down ramp length | 30 seconds 1 millisecond (requested 30000 ms) |
| Total test length | 11 minutes 58 seconds 322 milliseconds |
| State name | % of total | Count | Errors | Minimum Time | Maximum Time | Average Time |
|---|---|---|---|---|---|---|
Home | 10 % | 2250 | 0 | 0 ms | 9853 ms | 2812 ms
|
Register | 1 % | 280 | 0 | 0 ms | 9011 ms | 577 ms
|
RegisterUser | 1 % | 264 | 5 | 5 ms | 9034 ms | 243 ms
|
Browse | 10 % | 2126 | 0 | 0 ms | 9142 ms | 507 ms
|
BrowseCategories | 6 % | 1402 | 0 | 3 ms | 9160 ms | 256 ms
|
SearchItemsInCategory | 14 % | 3099 | 0 | 0 ms | 9143 ms | 236 ms
|
BrowseRegions | 2 % | 581 | 0 | 3 ms | 9064 ms | 262 ms
|
BrowseCategoriesInRegion | 2 % | 532 | 0 | 3 ms | 9120 ms | 252 ms
|
SearchItemsInRegion | 4 % | 967 | 0 | 0 ms | 9067 ms | 176 ms
|
ViewItem | 12 % | 2562 | 0 | 4 ms | 9053 ms | 145 ms
|
ViewUserInfo | 2 % | 467 | 0 | 3 ms | 9006 ms | 120 ms
|
ViewBidHistory | 1 % | 217 | 0 | 4 ms | 3393 ms | 85 ms
|
BuyNowAuth | 1 % | 221 | 0 | 2 ms | 9011 ms | 46 ms
|
BuyNow | 0 % | 193 | 38 | 4 ms | 685 ms | 16 ms
|
StoreBuyBow | 0 % | 132 | 0 | 4 ms | 3011 ms | 63 ms
|
PutBidAuth | 3 % | 827 | 0 | 0 ms | 9003 ms | 126 ms
|
PutBid | 3 % | 794 | 99 | 4 ms | 3093 ms | 40 ms
|
StoreBid | 2 % | 455 | 1 | 4 ms | 9016 ms | 62 ms
|
PutCommentAuth | 0 % | 0 | 0 | 0 ms | 0 ms | 0 ms
|
PutComment | 0 % | 67 | 7 | 4 ms | 345 ms | 17 ms
|
StoreComment | 0 % | 50 | 0 | 4 ms | 9010 ms | 200 ms
|
Sell | 0 % | 167 | 0 | 0 ms | 9001 ms | 466 ms
|
SelectCategoryToSellItem | 0 % | 150 | 0 | 4 ms | 9026 ms | 333 ms
|
SellItemForm | 0 % | 143 | 0 | 2 ms | 9018 ms | 243 ms
|
RegisterItem | 0 % | 130 | 0 | 4 ms | 9022 ms | 317 ms
|
AboutMe (auth form) | 2 % | 475 | 0 | 0 ms | 9004 ms | 590 ms
|
AboutMe | 3 % | 644 | 0 | 10 ms | 9102 ms | 308 ms
|
Back probability | 7 % | 1558 | 0 | 0 ms | 0 ms | 0 ms
|
End of Session | 0 % | 204 | 0 | 0 ms | 0 ms | 0 ms
|
Total | 100 % | 20957 | 150 | - | - | 498 ms
|
Average throughput | 175 req/s
| |||||
Completed sessions | 180
| |||||
Total time | 12431 seconds
| |||||
Average session time | 69 seconds
| |||||
| State name | % of total | Count | Errors | Minimum Time | Maximum Time | Average Time |
|---|---|---|---|---|---|---|
Home | 4 % | 5371 | 0 | 0 ms | 3033 ms | 2 ms
|
Register | 1 % | 1225 | 0 | 0 ms | 3012 ms | 7 ms
|
RegisterUser | 1 % | 1192 | 12 | 4 ms | 3070 ms | 20 ms
|
Browse | 7 % | 8075 | 0 | 0 ms | 3068 ms | 7 ms
|
BrowseCategories | 5 % | 5739 | 0 | 3 ms | 3075 ms | 15 ms
|
SearchItemsInCategory | 16 % | 18100 | 0 | 0 ms | 3182 ms | 29 ms
|
BrowseRegions | 2 % | 2252 | 0 | 3 ms | 1756 ms | 9 ms
|
BrowseCategoriesInRegion | 1 % | 2209 | 0 | 3 ms | 1539 ms | 9 ms
|
SearchItemsInRegion | 4 % | 5287 | 0 | 0 ms | 3290 ms | 20 ms
|
ViewItem | 14 % | 15996 | 0 | 4 ms | 3096 ms | 17 ms
|
ViewUserInfo | 3 % | 3433 | 0 | 3 ms | 3039 ms | 12 ms
|
ViewBidHistory | 1 % | 1851 | 0 | 4 ms | 1855 ms | 21 ms
|
BuyNowAuth | 1 % | 1424 | 0 | 2 ms | 3014 ms | 6 ms
|
BuyNow | 1 % | 1401 | 232 | 4 ms | 3117 ms | 20 ms
|
StoreBuyBow | 1 % | 1149 | 0 | 4 ms | 3016 ms | 15 ms
|
PutBidAuth | 4 % | 5413 | 0 | 0 ms | 3025 ms | 9 ms
|
PutBid | 5 % | 6070 | 780 | 4 ms | 3093 ms | 18 ms
|
StoreBid | 3 % | 3906 | 1 | 4 ms | 3035 ms | 16 ms
|
PutCommentAuth | 0 % | 0 | 0 | 0 ms | 0 ms | 0 ms
|
PutComment | 0 % | 501 | 46 | 4 ms | 1606 ms | 16 ms
|
StoreComment | 0 % | 450 | 0 | 4 ms | 1942 ms | 14 ms
|
Sell | 0 % | 626 | 0 | 0 ms | 1782 ms | 5 ms
|
SelectCategoryToSellItem | 0 % | 614 | 0 | 4 ms | 3000 ms | 15 ms
|
SellItemForm | 0 % | 604 | 0 | 2 ms | 3059 ms | 13 ms
|
RegisterItem | 0 % | 603 | 0 | 4 ms | 882 ms | 12 ms
|
AboutMe (auth form) | 1 % | 1853 | 0 | 0 ms | 3002 ms | 4 ms
|
AboutMe | 2 % | 3162 | 0 | 8 ms | 3030 ms | 31 ms
|
Back probability | 10 % | 11353 | 0 | 0 ms | 0 ms | 0 ms
|
End of Session | 1 % | 1523 | 0 | 0 ms | 0 ms | 0 ms
|
Total | 100 % | 111382 | 1071 | - | - | 15 ms
|
Average throughput | 249 req/s
| |||||
Completed sessions | 1522
| |||||
Total time | 390001 seconds
| |||||
Average session time | 256 seconds
| |||||
| State name | % of total | Count | Errors | Minimum Time | Maximum Time | Average Time |
|---|---|---|---|---|---|---|
Home | 3 % | 145 | 0 | 0 ms | 626 ms | 4 ms
|
Register | 1 % | 39 | 0 | 0 ms | 1057 ms | 28 ms
|
RegisterUser | 1 % | 42 | 0 | 5 ms | 1523 ms | 77 ms
|
Browse | 6 % | 237 | 0 | 0 ms | 1047 ms | 22 ms
|
BrowseCategories | 5 % | 187 | 0 | 3 ms | 1677 ms | 33 ms
|
SearchItemsInCategory | 16 % | 616 | 0 | 0 ms | 1889 ms | 58 ms
|
BrowseRegions | 1 % | 67 | 0 | 3 ms | 41 ms | 6 ms
|
BrowseCategoriesInRegion | 2 % | 79 | 0 | 3 ms | 747 ms | 20 ms
|
SearchItemsInRegion | 5 % | 199 | 0 | 0 ms | 1898 ms | 49 ms
|
ViewItem | 15 % | 554 | 0 | 4 ms | 966 ms | 28 ms
|
ViewUserInfo | 2 % | 106 | 0 | 3 ms | 1692 ms | 61 ms
|
ViewBidHistory | 1 % | 66 | 0 | 4 ms | 817 ms | 26 ms
|
BuyNowAuth | 1 % | 45 | 0 | 2 ms | 9 ms | 2 ms
|
BuyNow | 1 % | 43 | 7 | 4 ms | 878 ms | 62 ms
|
StoreBuyBow | 1 % | 39 | 0 | 4 ms | 1931 ms | 167 ms
|
PutBidAuth | 4 % | 180 | 0 | 0 ms | 999 ms | 23 ms
|
PutBid | 5 % | 197 | 20 | 4 ms | 1659 ms | 43 ms
|
StoreBid | 3 % | 133 | 0 | 4 ms | 1888 ms | 32 ms
|
PutCommentAuth | 0 % | 0 | 0 | 0 ms | 0 ms | 0 ms
|
PutComment | 0 % | 16 | 1 | 4 ms | 1097 ms | 202 ms
|
StoreComment | 0 % | 15 | 0 | 4 ms | 14 ms | 7 ms
|
Sell | 0 % | 11 | 0 | 0 ms | 398 ms | 37 ms
|
SelectCategoryToSellItem | 0 % | 16 | 0 | 4 ms | 996 ms | 68 ms
|
SellItemForm | 0 % | 18 | 0 | 2 ms | 6 ms | 2 ms
|
RegisterItem | 0 % | 13 | 0 | 4 ms | 1483 ms | 124 ms
|
AboutMe (auth form) | 2 % | 74 | 0 | 0 ms | 585 ms | 29 ms
|
AboutMe | 2 % | 103 | 0 | 8 ms | 872 ms | 47 ms
|
Back probability | 10 % | 375 | 0 | 0 ms | 0 ms | 0 ms
|
End of Session | 1 % | 48 | 0 | 0 ms | 0 ms | 0 ms
|
Total | 100 % | 3663 | 28 | - | - | 34 ms
|
Average throughput | 123 req/s
| |||||
Completed sessions | 52
| |||||
Total time | 17054 seconds
| |||||
Average session time | 327 seconds
| |||||
| State name | % of total | Count | Errors | Minimum Time | Maximum Time | Average Time |
|---|---|---|---|---|---|---|
Home | 5 % | 7766 | 0 | 0 ms | 9853 ms | 816 ms
|
Register | 1 % | 1544 | 0 | 0 ms | 9011 ms | 111 ms
|
RegisterUser | 1 % | 1498 | 17 | 4 ms | 9034 ms | 61 ms
|
Browse | 7 % | 10438 | 0 | 0 ms | 9142 ms | 109 ms
|
BrowseCategories | 5 % | 7328 | 0 | 3 ms | 9160 ms | 62 ms
|
SearchItemsInCategory | 16 % | 21901 | 0 | 0 ms | 9143 ms | 59 ms
|
BrowseRegions | 2 % | 2900 | 0 | 3 ms | 9064 ms | 59 ms
|
BrowseCategoriesInRegion | 2 % | 2820 | 0 | 3 ms | 9120 ms | 55 ms
|
SearchItemsInRegion | 4 % | 6465 | 0 | 0 ms | 9067 ms | 44 ms
|
ViewItem | 14 % | 19154 | 0 | 4 ms | 9053 ms | 35 ms
|
ViewUserInfo | 2 % | 4016 | 0 | 3 ms | 9006 ms | 26 ms
|
ViewBidHistory | 1 % | 2139 | 0 | 4 ms | 3393 ms | 27 ms
|
BuyNowAuth | 1 % | 1690 | 0 | 2 ms | 9011 ms | 11 ms
|
BuyNow | 1 % | 1637 | 277 | 4 ms | 3117 ms | 20 ms
|
StoreBuyBow | 0 % | 1320 | 0 | 4 ms | 3016 ms | 25 ms
|
PutBidAuth | 4 % | 6420 | 0 | 0 ms | 9003 ms | 24 ms
|
PutBid | 5 % | 7072 | 899 | 4 ms | 3093 ms | 22 ms
|
StoreBid | 3 % | 4494 | 2 | 4 ms | 9016 ms | 21 ms
|
PutCommentAuth | 0 % | 0 | 0 | 0 ms | 0 ms | 0 ms
|
PutComment | 0 % | 584 | 54 | 4 ms | 1606 ms | 22 ms
|
StoreComment | 0 % | 515 | 0 | 4 ms | 9010 ms | 32 ms
|
Sell | 0 % | 804 | 0 | 0 ms | 9001 ms | 101 ms
|
SelectCategoryToSellItem | 0 % | 780 | 0 | 4 ms | 9026 ms | 77 ms
|
SellItemForm | 0 % | 765 | 0 | 2 ms | 9018 ms | 56 ms
|
RegisterItem | 0 % | 746 | 0 | 4 ms | 9022 ms | 67 ms
|
AboutMe (auth form) | 1 % | 2403 | 0 | 0 ms | 9004 ms | 120 ms
|
AboutMe | 2 % | 3923 | 0 | 8 ms | 9102 ms | 77 ms
|
Back probability | 9 % | 13286 | 0 | 0 ms | 0 ms | 0 ms
|
End of Session | 1 % | 1775 | 0 | 0 ms | 0 ms | 0 ms
|
Total | 100 % | 136183 | 1249 | - | - | 89 ms
|
Average throughput | 229 req/s
| |||||
Completed sessions | 1775
| |||||
Total time | 427348 seconds
| |||||
Average session time | 240 seconds
| |||||
An error occured while waiting for remote processes termination (Skipping waits)
Command is: /usr/bin/scp farm6.csail.mit.edu:/tmp/client1 /home/drkp/sandbox/txcache/src/RUBiS-1.4.3/bench/2009-3-19@19:51:56//client1.bin
Command is: /usr/bin/ssh -x localhost /bin/bash -c 'LANG=en_GB.UTF-8 /usr/bin/sar -n DEV -n SOCK -rubcw 1 605 -f /home/drkp/sandbox/txcache/src/RUBiS-1.4.3/bench/2009-3-19@19:51:56//client1.bin > /home/drkp/sandbox/txcache/src/RUBiS-1.4.3/bench/2009-3-19@19:51:56//client1'
Command is: /usr/bin/scp farm14:/tmp/db_server0 /home/drkp/sandbox/txcache/src/RUBiS-1.4.3/bench/2009-3-19@19:51:56//db_server0.bin
Command is: /usr/bin/ssh -x localhost /bin/bash -c 'LANG=en_GB.UTF-8 /usr/bin/sar -n DEV -n SOCK -rubcw 1 605 -f /home/drkp/sandbox/txcache/src/RUBiS-1.4.3/bench/2009-3-19@19:51:56//db_server0.bin > /home/drkp/sandbox/txcache/src/RUBiS-1.4.3/bench/2009-3-19@19:51:56//db_server0'
Command is: /usr/bin/scp farm12.csail.mit.edu:/tmp/web_server0 /home/drkp/sandbox/txcache/src/RUBiS-1.4.3/bench/2009-3-19@19:51:56//web_server0.bin
Command is: /usr/bin/ssh -x localhost /bin/bash -c 'LANG=en_GB.UTF-8 /usr/bin/sar -n DEV -n SOCK -rubcw 1 605 -f /home/drkp/sandbox/txcache/src/RUBiS-1.4.3/bench/2009-3-19@19:51:56//web_server0.bin > /home/drkp/sandbox/txcache/src/RUBiS-1.4.3/bench/2009-3-19@19:51:56//web_server0'
Command is: /usr/bin/scp farm13.csail.mit.edu:/tmp/web_server1 /home/drkp/sandbox/txcache/src/RUBiS-1.4.3/bench/2009-3-19@19:51:56//web_server1.bin
Command is: /usr/bin/ssh -x localhost /bin/bash -c 'LANG=en_GB.UTF-8 /usr/bin/sar -n DEV -n SOCK -rubcw 1 605 -f /home/drkp/sandbox/txcache/src/RUBiS-1.4.3/bench/2009-3-19@19:51:56//web_server1.bin > /home/drkp/sandbox/txcache/src/RUBiS-1.4.3/bench/2009-3-19@19:51:56//web_server1'
Command is: /usr/bin/scp localhost:/tmp/client0 /home/drkp/sandbox/txcache/src/RUBiS-1.4.3/bench/2009-3-19@19:51:56//client0.bin
Command is: /usr/bin/ssh -x localhost /bin/bash -c 'LANG=en_GB.UTF-8 /usr/bin/sar -n DEV -n SOCK -rubcw 1 605 -f /home/drkp/sandbox/txcache/src/RUBiS-1.4.3/bench/2009-3-19@19:51:56//client0.bin > /home/drkp/sandbox/txcache/src/RUBiS-1.4.3/bench/2009-3-19@19:51:56//client0'
Command is: /usr/bin/scp farm6.csail.mit.edu:/tmp/trace_client1.html /home/drkp/sandbox/txcache/src/RUBiS-1.4.3/bench/2009-3-19@19:51:56//
Command is: /usr/bin/scp farm6.csail.mit.edu:/tmp/stat_client1.html /home/drkp/sandbox/txcache/src/RUBiS-1.4.3/bench/2009-3-19@19:51:56//
|
|
|
|
|
|
 | 
|
 | 
|
 | 
|
 | 
|
 | 
|
 | 
|
 | 
|
 | 
|
 | 
|