Node information
Test timing information
Up ramp statistics
Runtime session statistics
Down ramp statistics
Overall statistics
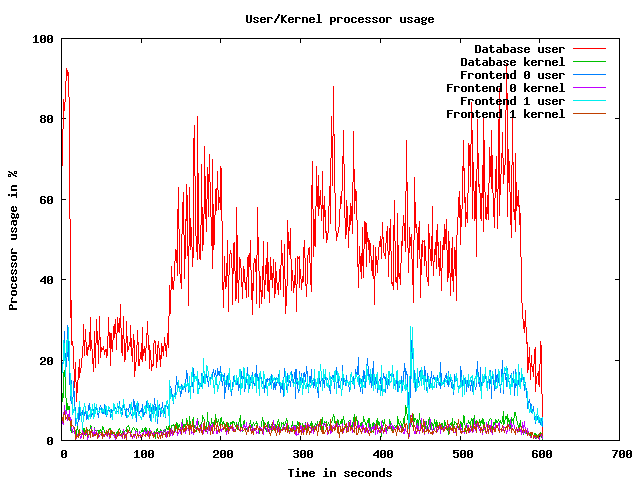
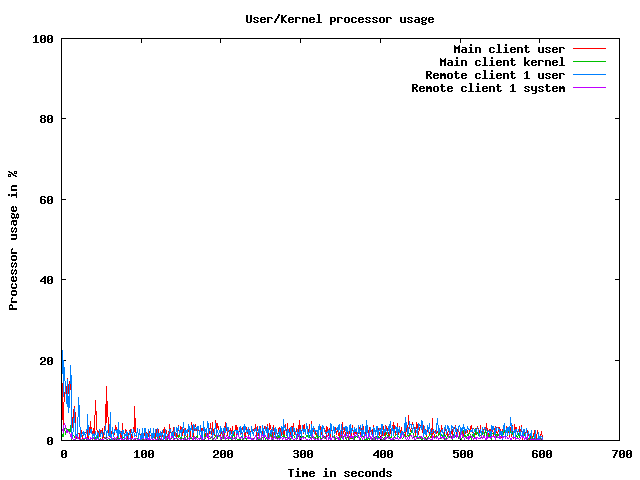
CPU usage graphs
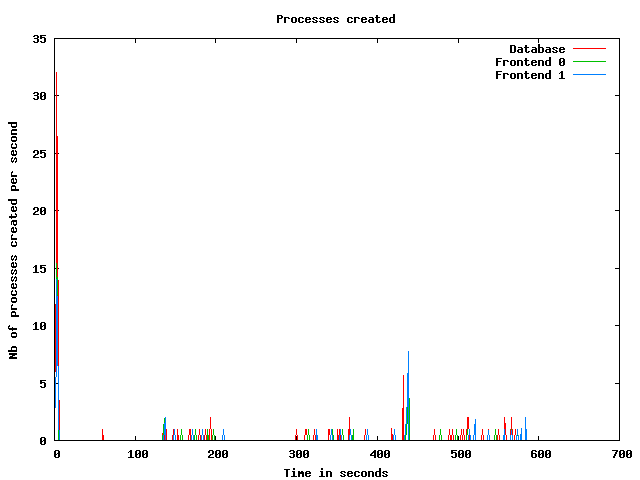
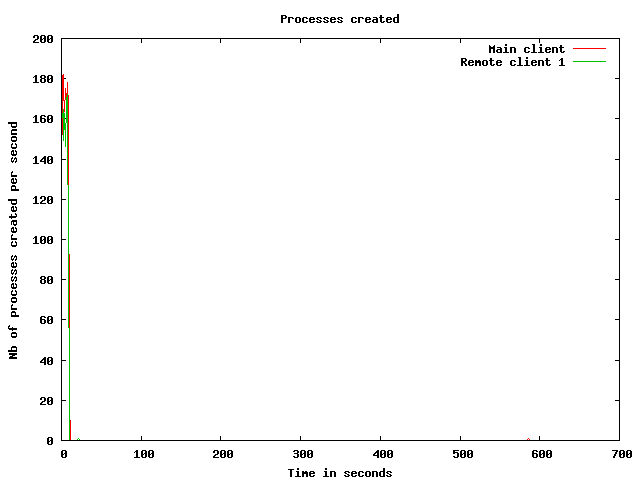
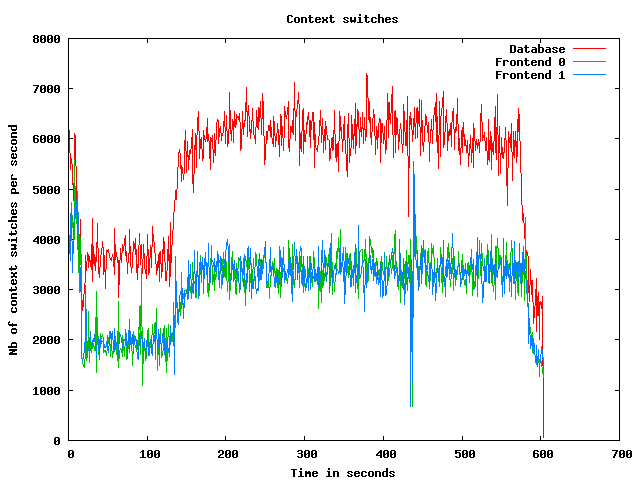
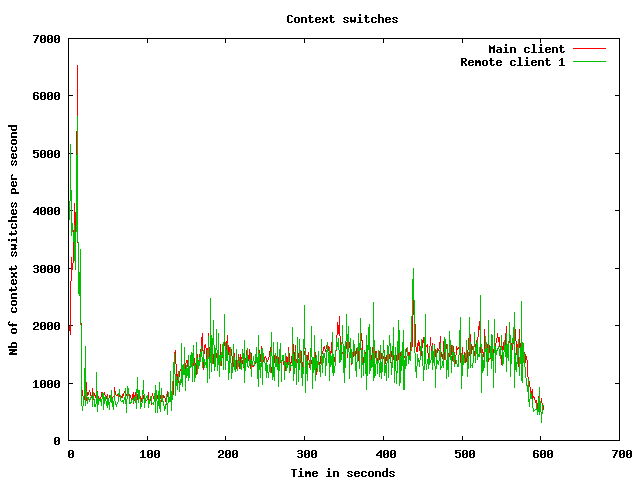
Processes usage graphs
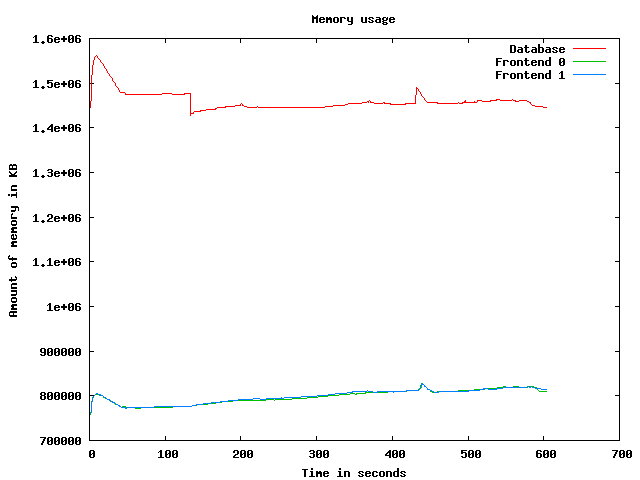
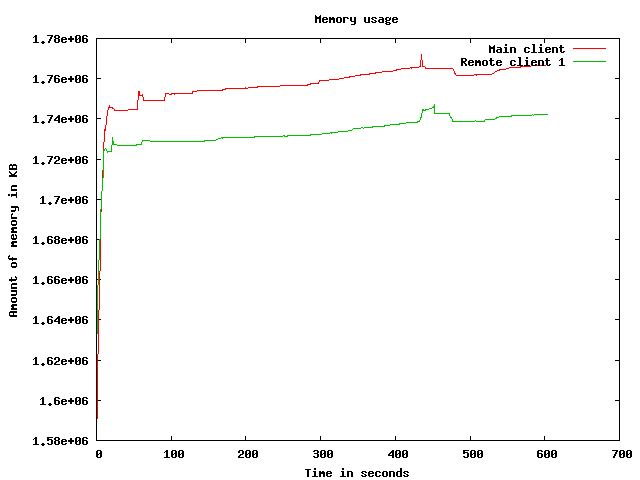
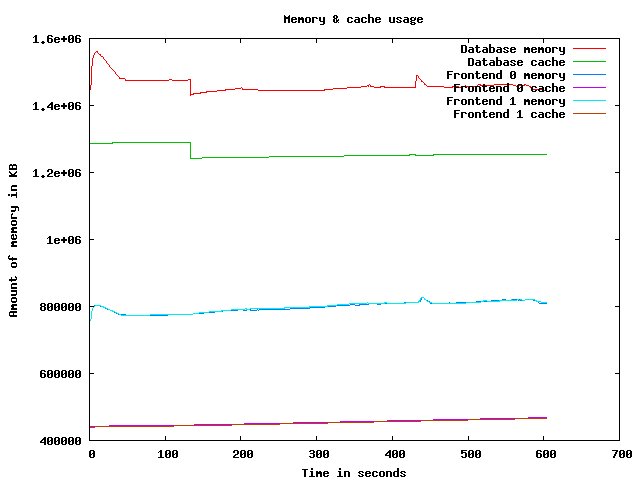
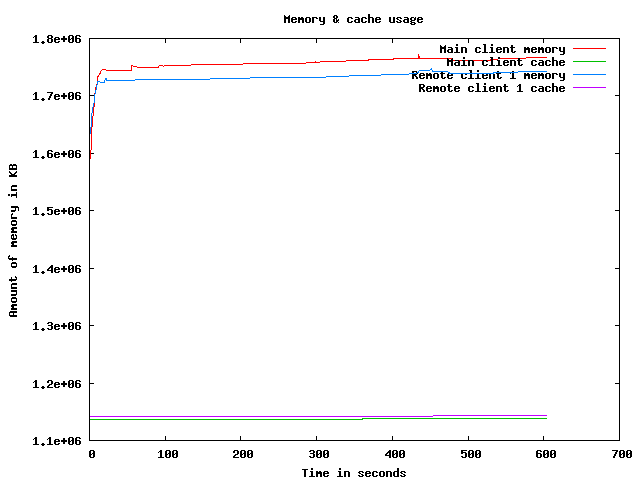
Memory usage graph
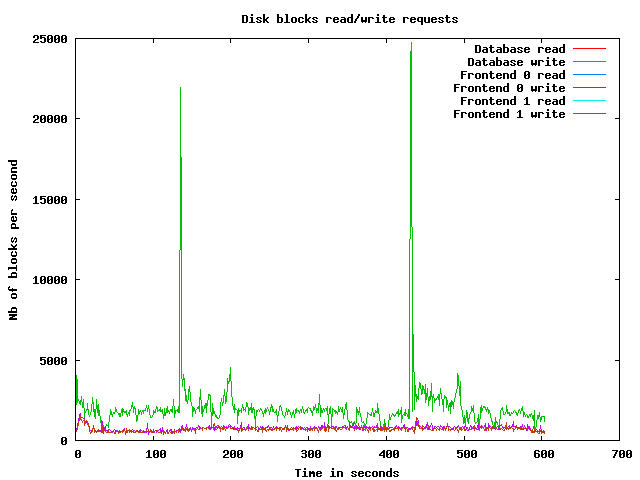
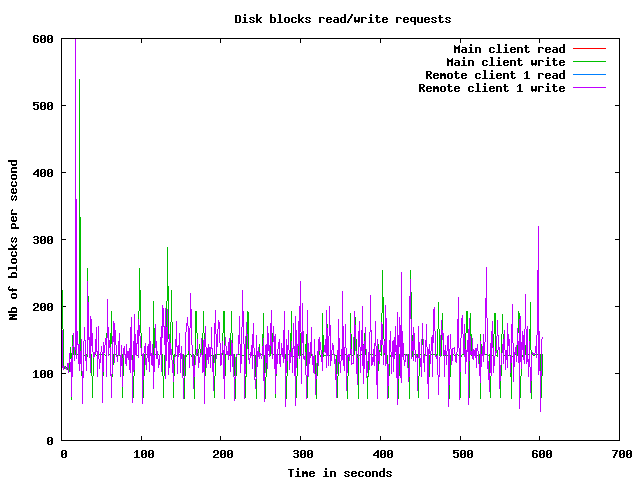
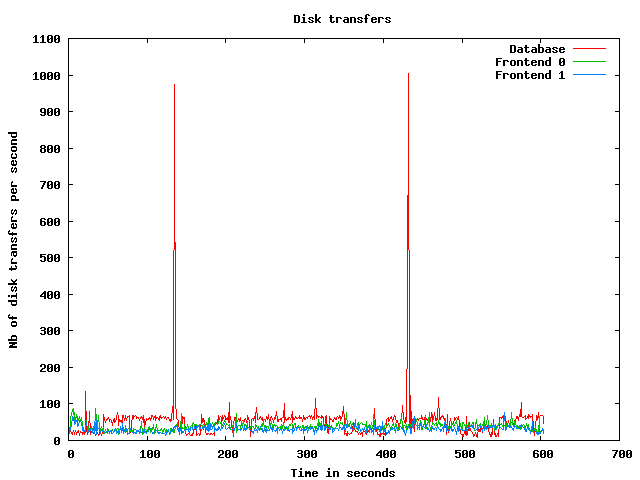
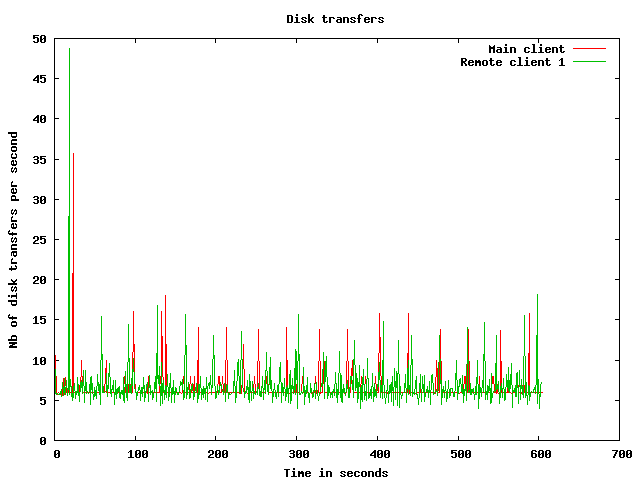
Disk usage graphs
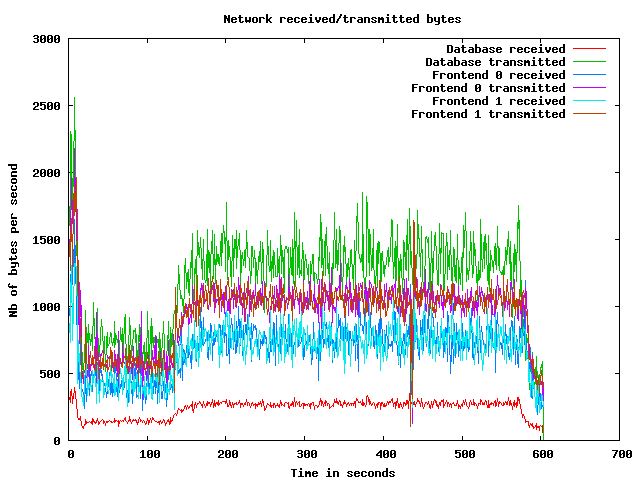
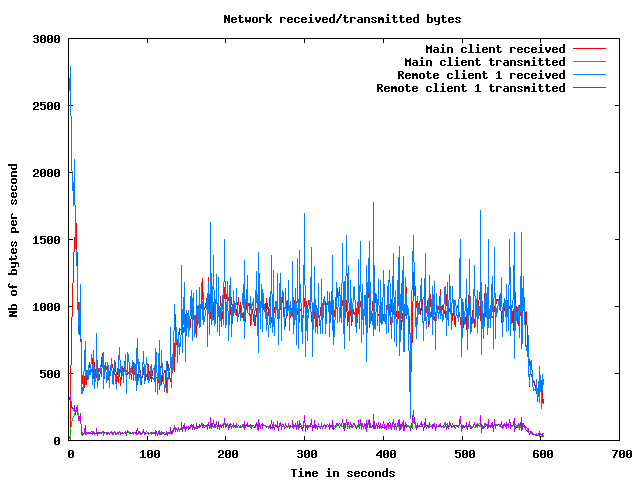
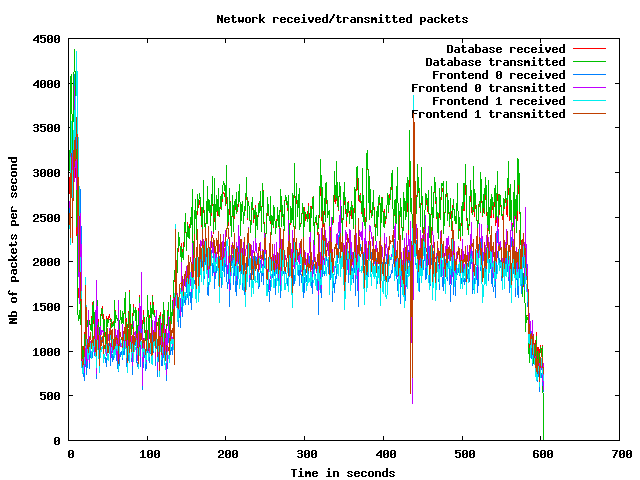
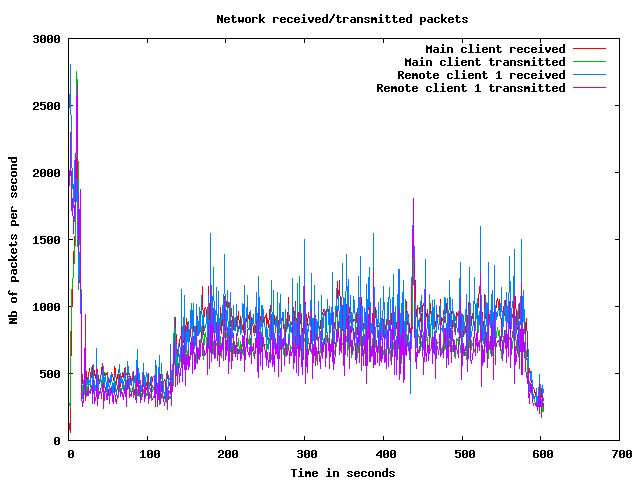
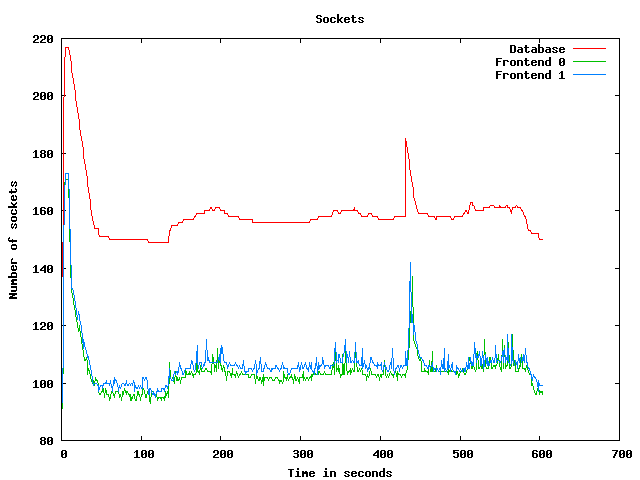
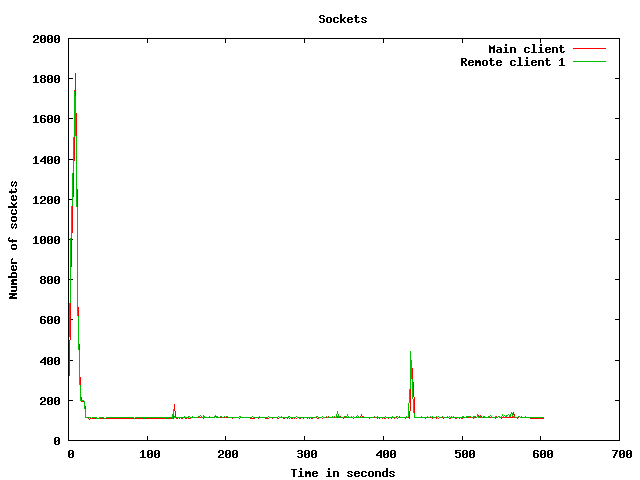
Network usage graphs
| Test start | 2009-3-19 20:4:37 |
| Up ramp start | 2009-3-19 20:4:49 |
| Runtime session start | 2009-3-19 20:6:49 |
| Down ramp start | 2009-3-19 20:14:19 |
| Test end | 2009-3-19 20:16:30 |
| Up ramp length | 2 minutes 1 millisecond (requested 120000 ms) |
| Runtime session length | 7 minutes 30 seconds 0 millisecond (requested 450000 ms) |
| Down ramp length | 30 seconds 0 millisecond (requested 30000 ms) |
| Total test length | 11 minutes 52 seconds 770 milliseconds |
| State name | % of total | Count | Errors | Minimum Time | Maximum Time | Average Time |
|---|---|---|---|---|---|---|
Home | 11 % | 2558 | 0 | 0 ms | 21026 ms | 3642 ms
|
Register | 1 % | 331 | 0 | 0 ms | 9046 ms | 377 ms
|
RegisterUser | 1 % | 301 | 3 | 4 ms | 9023 ms | 279 ms
|
Browse | 10 % | 2388 | 0 | 0 ms | 9080 ms | 538 ms
|
BrowseCategories | 6 % | 1572 | 0 | 3 ms | 9111 ms | 326 ms
|
SearchItemsInCategory | 14 % | 3353 | 0 | 0 ms | 9195 ms | 225 ms
|
BrowseRegions | 2 % | 637 | 0 | 3 ms | 9029 ms | 212 ms
|
BrowseCategoriesInRegion | 2 % | 592 | 0 | 3 ms | 9022 ms | 279 ms
|
SearchItemsInRegion | 4 % | 1020 | 0 | 0 ms | 9018 ms | 105 ms
|
ViewItem | 11 % | 2699 | 0 | 4 ms | 9056 ms | 111 ms
|
ViewUserInfo | 2 % | 458 | 0 | 3 ms | 9024 ms | 129 ms
|
ViewBidHistory | 1 % | 245 | 0 | 4 ms | 3023 ms | 30 ms
|
BuyNowAuth | 0 % | 207 | 0 | 2 ms | 8996 ms | 104 ms
|
BuyNow | 0 % | 179 | 26 | 4 ms | 3010 ms | 27 ms
|
StoreBuyBow | 0 % | 123 | 0 | 4 ms | 3009 ms | 59 ms
|
PutBidAuth | 4 % | 933 | 0 | 0 ms | 9005 ms | 48 ms
|
PutBid | 3 % | 848 | 135 | 4 ms | 9014 ms | 94 ms
|
StoreBid | 2 % | 469 | 0 | 4 ms | 9009 ms | 78 ms
|
PutCommentAuth | 0 % | 0 | 0 | 0 ms | 0 ms | 0 ms
|
PutComment | 0 % | 69 | 5 | 4 ms | 3089 ms | 79 ms
|
StoreComment | 0 % | 57 | 0 | 4 ms | 162 ms | 14 ms
|
Sell | 0 % | 176 | 0 | 0 ms | 9007 ms | 622 ms
|
SelectCategoryToSellItem | 0 % | 157 | 0 | 4 ms | 9000 ms | 240 ms
|
SellItemForm | 0 % | 144 | 0 | 2 ms | 9123 ms | 192 ms
|
RegisterItem | 0 % | 137 | 0 | 4 ms | 9189 ms | 233 ms
|
AboutMe (auth form) | 2 % | 548 | 0 | 0 ms | 9898 ms | 463 ms
|
AboutMe | 3 % | 732 | 0 | 9 ms | 9192 ms | 250 ms
|
Back probability | 6 % | 1564 | 0 | 0 ms | 0 ms | 0 ms
|
End of Session | 0 % | 208 | 0 | 0 ms | 0 ms | 0 ms
|
Total | 100 % | 22705 | 169 | - | - | 599 ms
|
Average throughput | 190 req/s
| |||||
Completed sessions | 180
| |||||
Total time | 12030 seconds
| |||||
Average session time | 66 seconds
| |||||
| State name | % of total | Count | Errors | Minimum Time | Maximum Time | Average Time |
|---|---|---|---|---|---|---|
Home | 4 % | 6386 | 0 | 0 ms | 3407 ms | 6 ms
|
Register | 1 % | 1394 | 0 | 0 ms | 3408 ms | 12 ms
|
RegisterUser | 1 % | 1365 | 18 | 4 ms | 2462 ms | 23 ms
|
Browse | 7 % | 9442 | 0 | 0 ms | 3413 ms | 10 ms
|
BrowseCategories | 5 % | 6572 | 0 | 3 ms | 3466 ms | 21 ms
|
SearchItemsInCategory | 15 % | 20410 | 0 | 0 ms | 3782 ms | 50 ms
|
BrowseRegions | 2 % | 2749 | 0 | 3 ms | 3388 ms | 18 ms
|
BrowseCategoriesInRegion | 2 % | 2675 | 0 | 3 ms | 3386 ms | 19 ms
|
SearchItemsInRegion | 4 % | 6455 | 0 | 0 ms | 3601 ms | 28 ms
|
ViewItem | 14 % | 18597 | 0 | 4 ms | 3453 ms | 26 ms
|
ViewUserInfo | 3 % | 4210 | 0 | 3 ms | 3341 ms | 21 ms
|
ViewBidHistory | 1 % | 2114 | 0 | 4 ms | 3370 ms | 31 ms
|
BuyNowAuth | 1 % | 1742 | 0 | 2 ms | 3000 ms | 13 ms
|
BuyNow | 1 % | 1714 | 297 | 4 ms | 3013 ms | 16 ms
|
StoreBuyBow | 1 % | 1389 | 0 | 4 ms | 2493 ms | 21 ms
|
PutBidAuth | 4 % | 6299 | 0 | 0 ms | 3444 ms | 15 ms
|
PutBid | 5 % | 7107 | 943 | 4 ms | 3475 ms | 26 ms
|
StoreBid | 3 % | 4565 | 0 | 4 ms | 3453 ms | 25 ms
|
PutCommentAuth | 0 % | 0 | 0 | 0 ms | 0 ms | 0 ms
|
PutComment | 0 % | 591 | 58 | 4 ms | 2503 ms | 17 ms
|
StoreComment | 0 % | 524 | 0 | 4 ms | 2584 ms | 26 ms
|
Sell | 0 % | 746 | 0 | 0 ms | 3369 ms | 10 ms
|
SelectCategoryToSellItem | 0 % | 737 | 0 | 4 ms | 722 ms | 15 ms
|
SellItemForm | 0 % | 729 | 0 | 2 ms | 3001 ms | 20 ms
|
RegisterItem | 0 % | 708 | 0 | 4 ms | 2591 ms | 16 ms
|
AboutMe (auth form) | 1 % | 2152 | 0 | 0 ms | 3425 ms | 17 ms
|
AboutMe | 2 % | 3584 | 0 | 8 ms | 3582 ms | 47 ms
|
Back probability | 10 % | 13260 | 0 | 0 ms | 0 ms | 0 ms
|
End of Session | 1 % | 1819 | 0 | 0 ms | 0 ms | 0 ms
|
Total | 100 % | 130035 | 1316 | - | - | 23 ms
|
Average throughput | 291 req/s
| |||||
Completed sessions | 1822
| |||||
Total time | 460670 seconds
| |||||
Average session time | 252 seconds
| |||||
| State name | % of total | Count | Errors | Minimum Time | Maximum Time | Average Time |
|---|---|---|---|---|---|---|
Home | 4 % | 208 | 0 | 0 ms | 3 ms | 0 ms
|
Register | 1 % | 48 | 0 | 0 ms | 3 ms | 0 ms
|
RegisterUser | 1 % | 45 | 0 | 5 ms | 45 ms | 12 ms
|
Browse | 7 % | 330 | 0 | 0 ms | 5 ms | 0 ms
|
BrowseCategories | 5 % | 228 | 0 | 3 ms | 46 ms | 7 ms
|
SearchItemsInCategory | 15 % | 667 | 0 | 0 ms | 213 ms | 33 ms
|
BrowseRegions | 2 % | 87 | 0 | 3 ms | 25 ms | 8 ms
|
BrowseCategoriesInRegion | 2 % | 99 | 0 | 3 ms | 31 ms | 6 ms
|
SearchItemsInRegion | 5 % | 232 | 0 | 0 ms | 84 ms | 13 ms
|
ViewItem | 14 % | 603 | 0 | 4 ms | 84 ms | 11 ms
|
ViewUserInfo | 2 % | 115 | 0 | 3 ms | 33 ms | 7 ms
|
ViewBidHistory | 1 % | 73 | 0 | 4 ms | 80 ms | 16 ms
|
BuyNowAuth | 1 % | 67 | 0 | 2 ms | 15 ms | 3 ms
|
BuyNow | 1 % | 58 | 9 | 4 ms | 25 ms | 7 ms
|
StoreBuyBow | 0 % | 41 | 0 | 4 ms | 41 ms | 12 ms
|
PutBidAuth | 4 % | 206 | 0 | 0 ms | 14 ms | 3 ms
|
PutBid | 5 % | 223 | 22 | 4 ms | 64 ms | 11 ms
|
StoreBid | 3 % | 154 | 0 | 4 ms | 54 ms | 9 ms
|
PutCommentAuth | 0 % | 0 | 0 | 0 ms | 0 ms | 0 ms
|
PutComment | 0 % | 31 | 0 | 4 ms | 11 ms | 4 ms
|
StoreComment | 0 % | 20 | 0 | 5 ms | 34 ms | 10 ms
|
Sell | 0 % | 12 | 0 | 0 ms | 5 ms | 1 ms
|
SelectCategoryToSellItem | 0 % | 13 | 0 | 4 ms | 32 ms | 10 ms
|
SellItemForm | 0 % | 14 | 0 | 2 ms | 5 ms | 3 ms
|
RegisterItem | 0 % | 17 | 0 | 4 ms | 42 ms | 14 ms
|
AboutMe (auth form) | 1 % | 82 | 0 | 0 ms | 3 ms | 0 ms
|
AboutMe | 2 % | 124 | 0 | 10 ms | 105 ms | 22 ms
|
Back probability | 9 % | 397 | 0 | 0 ms | 0 ms | 0 ms
|
End of Session | 1 % | 71 | 0 | 0 ms | 0 ms | 0 ms
|
Total | 100 % | 4265 | 31 | - | - | 11 ms
|
Average throughput | 143 req/s
| |||||
Completed sessions | 63
| |||||
Total time | 19636 seconds
| |||||
Average session time | 311 seconds
| |||||
| State name | % of total | Count | Errors | Minimum Time | Maximum Time | Average Time |
|---|---|---|---|---|---|---|
Home | 5 % | 9152 | 0 | 0 ms | 21026 ms | 1022 ms
|
Register | 1 % | 1773 | 0 | 0 ms | 9046 ms | 80 ms
|
RegisterUser | 1 % | 1711 | 21 | 4 ms | 9023 ms | 68 ms
|
Browse | 7 % | 12160 | 0 | 0 ms | 9080 ms | 114 ms
|
BrowseCategories | 5 % | 8372 | 0 | 3 ms | 9111 ms | 78 ms
|
SearchItemsInCategory | 15 % | 24515 | 0 | 0 ms | 9195 ms | 74 ms
|
BrowseRegions | 2 % | 3473 | 0 | 3 ms | 9029 ms | 53 ms
|
BrowseCategoriesInRegion | 2 % | 3366 | 0 | 3 ms | 9022 ms | 65 ms
|
SearchItemsInRegion | 4 % | 7721 | 0 | 0 ms | 9018 ms | 37 ms
|
ViewItem | 13 % | 21931 | 0 | 4 ms | 9056 ms | 36 ms
|
ViewUserInfo | 3 % | 4791 | 0 | 3 ms | 9024 ms | 31 ms
|
ViewBidHistory | 1 % | 2433 | 0 | 4 ms | 3370 ms | 31 ms
|
BuyNowAuth | 1 % | 2016 | 0 | 2 ms | 8996 ms | 22 ms
|
BuyNow | 1 % | 1951 | 332 | 4 ms | 3013 ms | 17 ms
|
StoreBuyBow | 0 % | 1553 | 0 | 4 ms | 3009 ms | 24 ms
|
PutBidAuth | 4 % | 7438 | 0 | 0 ms | 9005 ms | 18 ms
|
PutBid | 5 % | 8194 | 1100 | 4 ms | 9014 ms | 32 ms
|
StoreBid | 3 % | 5188 | 0 | 4 ms | 9009 ms | 30 ms
|
PutCommentAuth | 0 % | 0 | 0 | 0 ms | 0 ms | 0 ms
|
PutComment | 0 % | 691 | 63 | 4 ms | 3089 ms | 23 ms
|
StoreComment | 0 % | 601 | 0 | 4 ms | 2584 ms | 24 ms
|
Sell | 0 % | 934 | 0 | 0 ms | 9007 ms | 125 ms
|
SelectCategoryToSellItem | 0 % | 907 | 0 | 4 ms | 9000 ms | 54 ms
|
SellItemForm | 0 % | 887 | 0 | 2 ms | 9123 ms | 48 ms
|
RegisterItem | 0 % | 862 | 0 | 4 ms | 9189 ms | 51 ms
|
AboutMe (auth form) | 1 % | 2782 | 0 | 0 ms | 9898 ms | 104 ms
|
AboutMe | 2 % | 4463 | 0 | 8 ms | 9192 ms | 79 ms
|
Back probability | 9 % | 15221 | 0 | 0 ms | 0 ms | 0 ms
|
End of Session | 1 % | 2098 | 0 | 0 ms | 0 ms | 0 ms
|
Total | 100 % | 157184 | 1516 | - | - | 105 ms
|
Average throughput | 264 req/s
| |||||
Completed sessions | 2097
| |||||
Total time | 501875 seconds
| |||||
Average session time | 239 seconds
| |||||
An error occured while waiting for remote processes termination (Skipping waits)
Command is: /usr/bin/scp farm6.csail.mit.edu:/tmp/client1 /home/drkp/sandbox/txcache/src/RUBiS-1.4.3/bench/2009-3-19@20:4:37//client1.bin
Command is: /usr/bin/ssh -x localhost /bin/bash -c 'LANG=en_GB.UTF-8 /usr/bin/sar -n DEV -n SOCK -rubcw 1 605 -f /home/drkp/sandbox/txcache/src/RUBiS-1.4.3/bench/2009-3-19@20:4:37//client1.bin > /home/drkp/sandbox/txcache/src/RUBiS-1.4.3/bench/2009-3-19@20:4:37//client1'
Command is: /usr/bin/scp farm14:/tmp/db_server0 /home/drkp/sandbox/txcache/src/RUBiS-1.4.3/bench/2009-3-19@20:4:37//db_server0.bin
Command is: /usr/bin/ssh -x localhost /bin/bash -c 'LANG=en_GB.UTF-8 /usr/bin/sar -n DEV -n SOCK -rubcw 1 605 -f /home/drkp/sandbox/txcache/src/RUBiS-1.4.3/bench/2009-3-19@20:4:37//db_server0.bin > /home/drkp/sandbox/txcache/src/RUBiS-1.4.3/bench/2009-3-19@20:4:37//db_server0'
Command is: /usr/bin/scp farm12.csail.mit.edu:/tmp/web_server0 /home/drkp/sandbox/txcache/src/RUBiS-1.4.3/bench/2009-3-19@20:4:37//web_server0.bin
Command is: /usr/bin/ssh -x localhost /bin/bash -c 'LANG=en_GB.UTF-8 /usr/bin/sar -n DEV -n SOCK -rubcw 1 605 -f /home/drkp/sandbox/txcache/src/RUBiS-1.4.3/bench/2009-3-19@20:4:37//web_server0.bin > /home/drkp/sandbox/txcache/src/RUBiS-1.4.3/bench/2009-3-19@20:4:37//web_server0'
Command is: /usr/bin/scp farm13.csail.mit.edu:/tmp/web_server1 /home/drkp/sandbox/txcache/src/RUBiS-1.4.3/bench/2009-3-19@20:4:37//web_server1.bin
Command is: /usr/bin/ssh -x localhost /bin/bash -c 'LANG=en_GB.UTF-8 /usr/bin/sar -n DEV -n SOCK -rubcw 1 605 -f /home/drkp/sandbox/txcache/src/RUBiS-1.4.3/bench/2009-3-19@20:4:37//web_server1.bin > /home/drkp/sandbox/txcache/src/RUBiS-1.4.3/bench/2009-3-19@20:4:37//web_server1'
Command is: /usr/bin/scp localhost:/tmp/client0 /home/drkp/sandbox/txcache/src/RUBiS-1.4.3/bench/2009-3-19@20:4:37//client0.bin
Command is: /usr/bin/ssh -x localhost /bin/bash -c 'LANG=en_GB.UTF-8 /usr/bin/sar -n DEV -n SOCK -rubcw 1 605 -f /home/drkp/sandbox/txcache/src/RUBiS-1.4.3/bench/2009-3-19@20:4:37//client0.bin > /home/drkp/sandbox/txcache/src/RUBiS-1.4.3/bench/2009-3-19@20:4:37//client0'
Command is: /usr/bin/scp farm6.csail.mit.edu:/tmp/trace_client1.html /home/drkp/sandbox/txcache/src/RUBiS-1.4.3/bench/2009-3-19@20:4:37//
Command is: /usr/bin/scp farm6.csail.mit.edu:/tmp/stat_client1.html /home/drkp/sandbox/txcache/src/RUBiS-1.4.3/bench/2009-3-19@20:4:37//
|
|
|
|
|
|
 | 
|
 | 
|
 | 
|
 | 
|
 | 
|
 | 
|
 | 
|
 | 
|
 | 
|