Node information
Test timing information
Up ramp statistics
Runtime session statistics
Down ramp statistics
Overall statistics
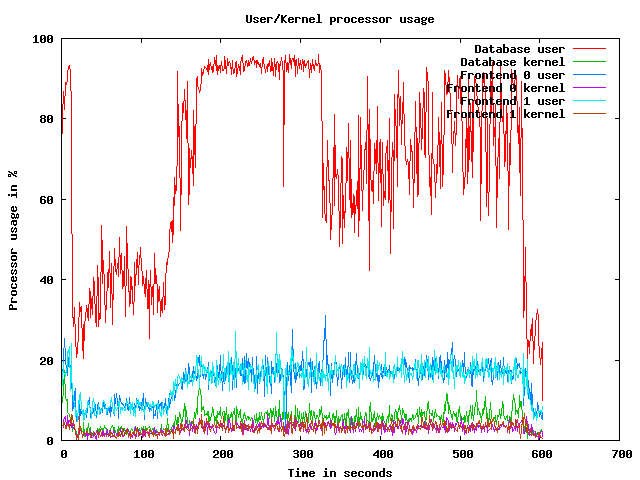
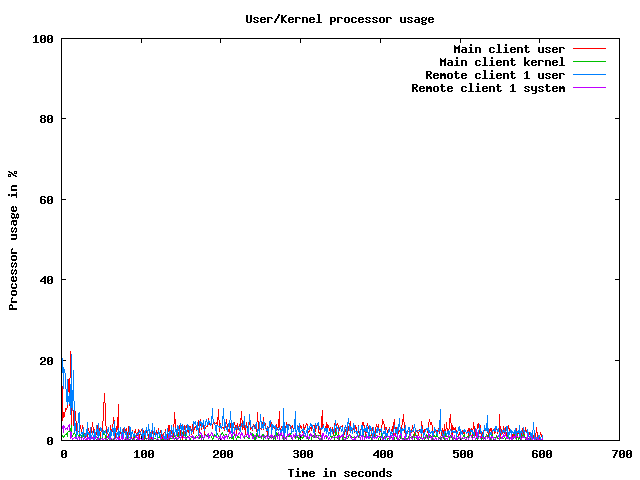
CPU usage graphs
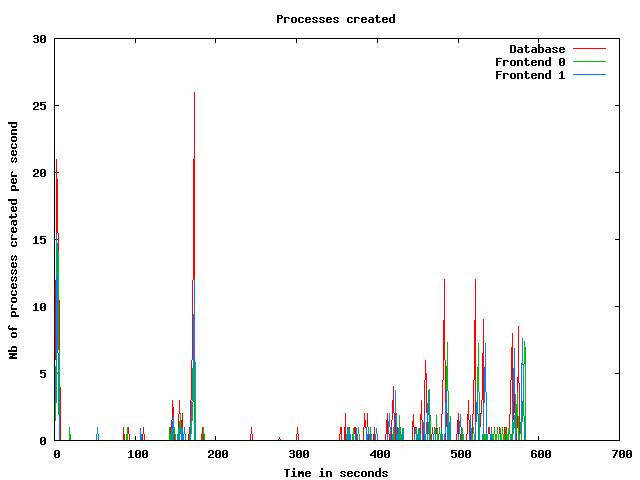
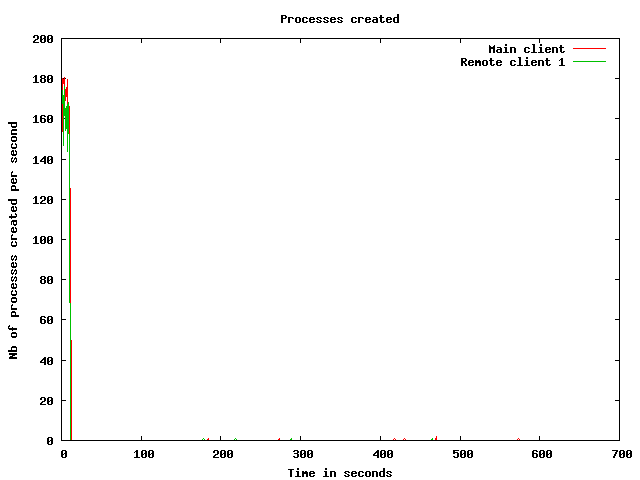
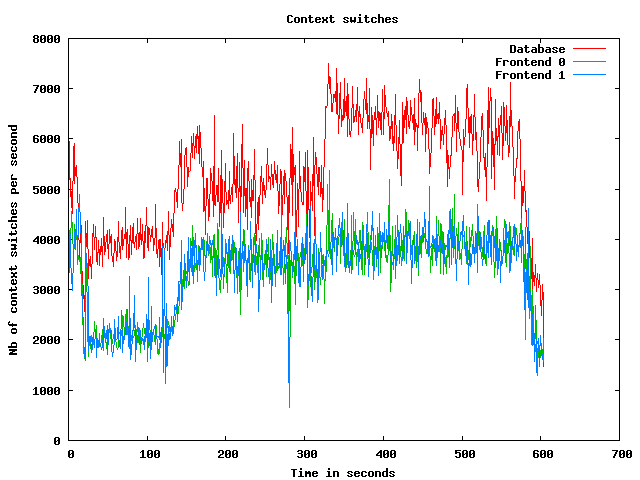
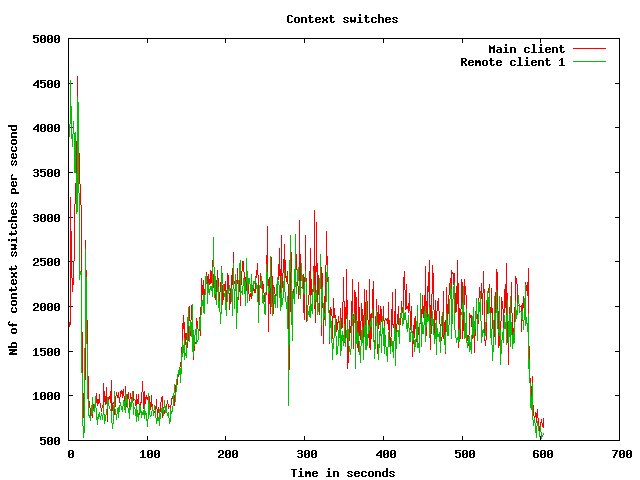
Processes usage graphs
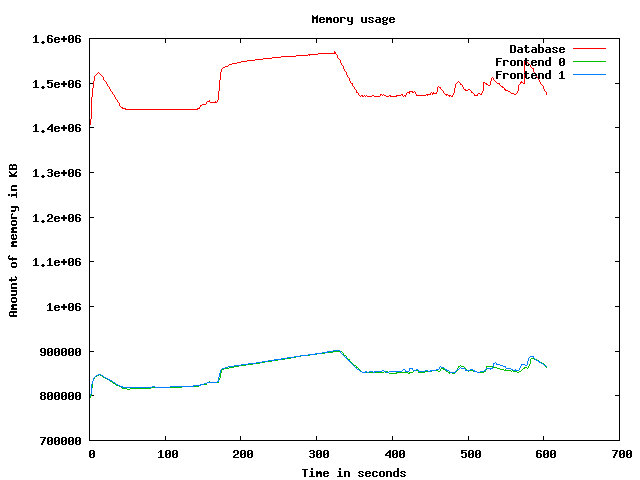
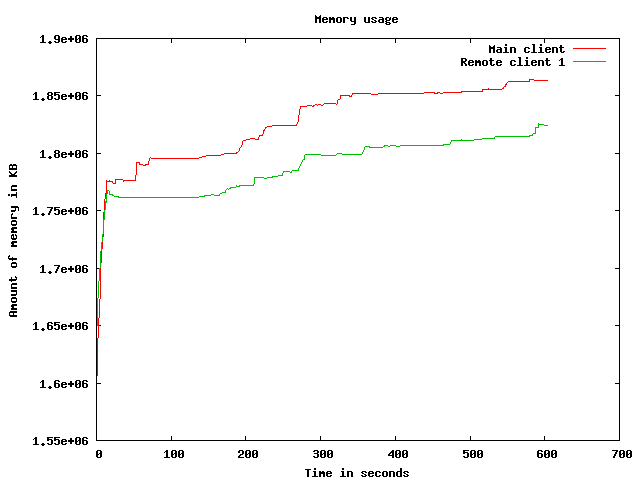
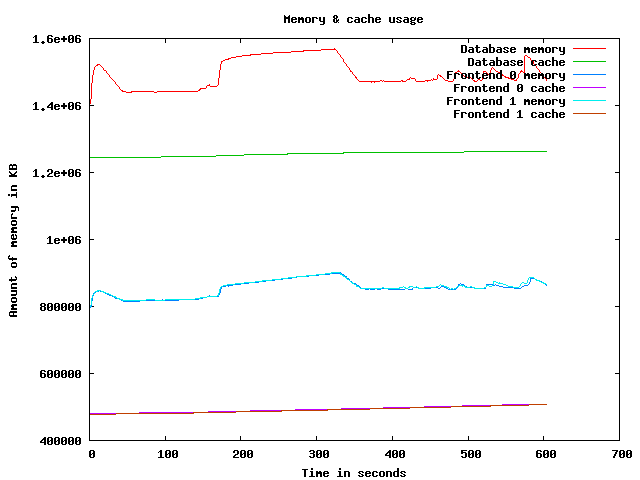
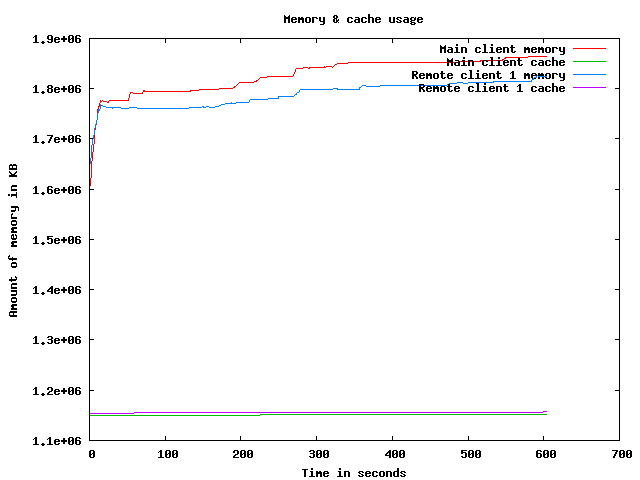
Memory usage graph
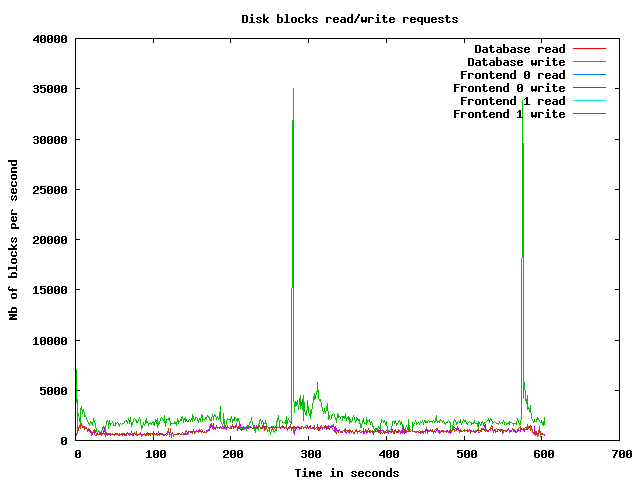
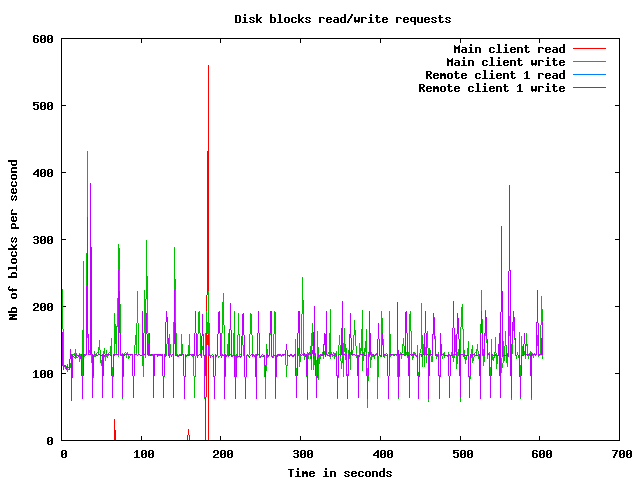
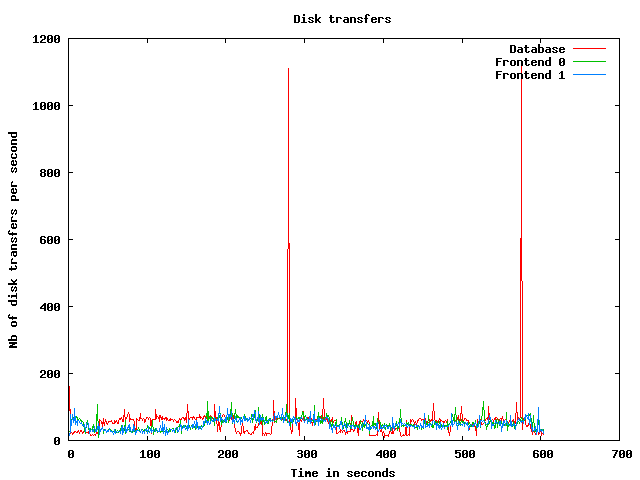
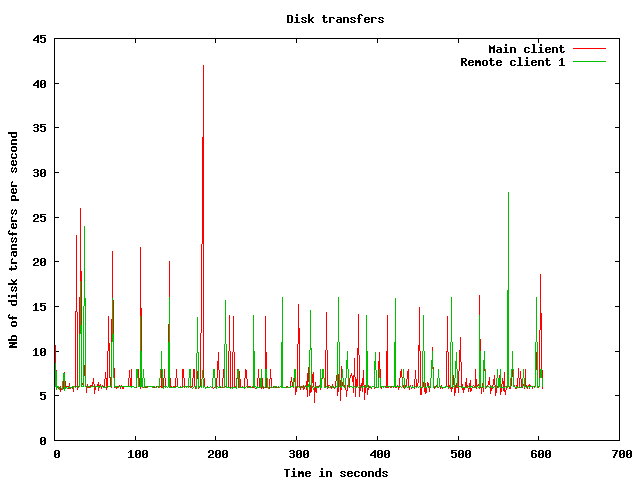
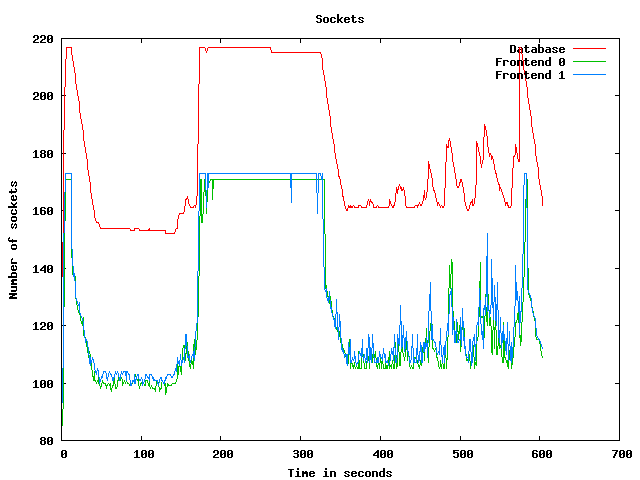
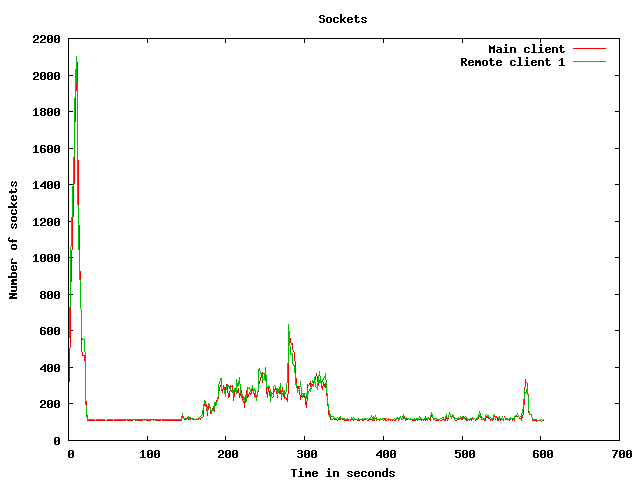
Disk usage graphs
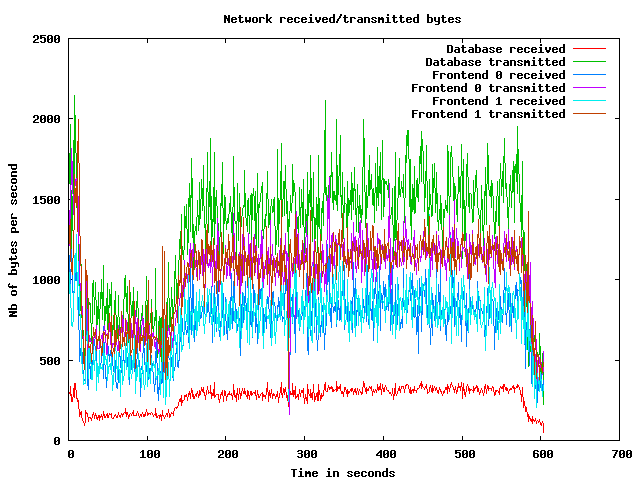
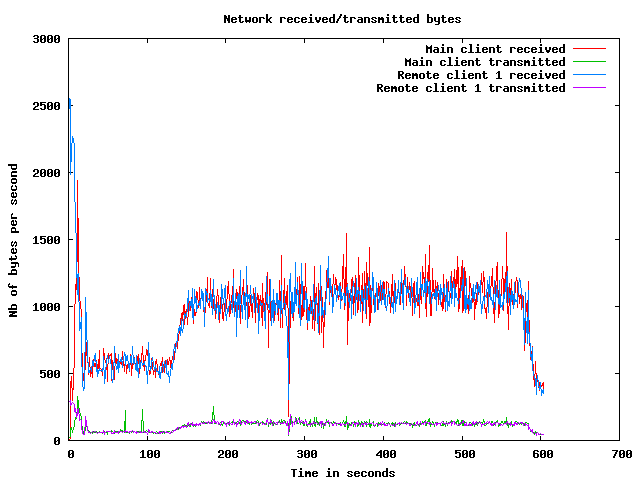
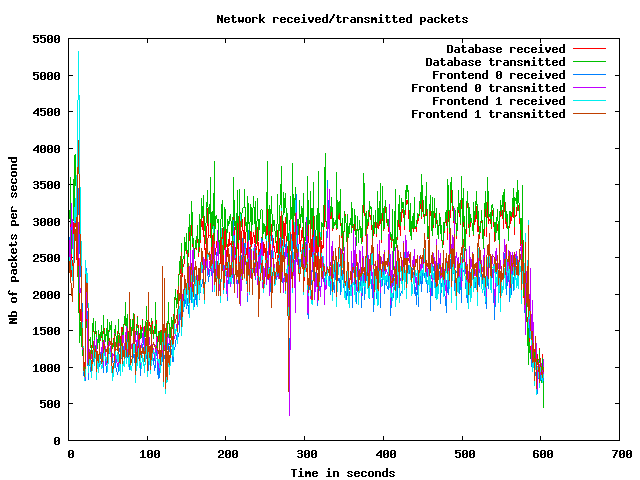
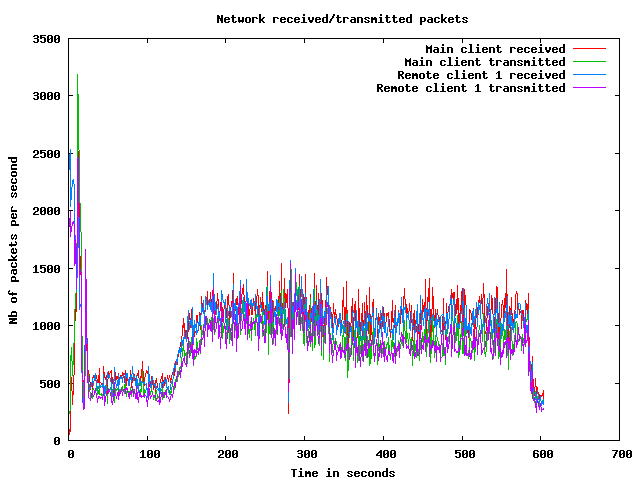
Network usage graphs
| Test start | 2009-3-19 20:17:13 |
| Up ramp start | 2009-3-19 20:17:27 |
| Runtime session start | 2009-3-19 20:19:27 |
| Down ramp start | 2009-3-19 20:26:57 |
| Test end | 2009-3-19 20:29:26 |
| Up ramp length | 2 minutes 0 millisecond (requested 120000 ms) |
| Runtime session length | 7 minutes 30 seconds 0 millisecond (requested 450000 ms) |
| Down ramp length | 30 seconds 1 millisecond (requested 30000 ms) |
| Total test length | 12 minutes 12 seconds 928 milliseconds |
| State name | % of total | Count | Errors | Minimum Time | Maximum Time | Average Time |
|---|---|---|---|---|---|---|
Home | 11 % | 2901 | 0 | 0 ms | 21034 ms | 5093 ms
|
Register | 1 % | 334 | 0 | 0 ms | 21018 ms | 530 ms
|
RegisterUser | 1 % | 301 | 3 | 5 ms | 9064 ms | 373 ms
|
Browse | 10 % | 2656 | 0 | 0 ms | 21007 ms | 704 ms
|
BrowseCategories | 6 % | 1733 | 0 | 3 ms | 21012 ms | 338 ms
|
SearchItemsInCategory | 14 % | 3601 | 0 | 0 ms | 21043 ms | 199 ms
|
BrowseRegions | 2 % | 738 | 0 | 3 ms | 21008 ms | 324 ms
|
BrowseCategoriesInRegion | 2 % | 683 | 0 | 3 ms | 20995 ms | 273 ms
|
SearchItemsInRegion | 4 % | 1255 | 0 | 0 ms | 21023 ms | 121 ms
|
ViewItem | 11 % | 2990 | 0 | 4 ms | 21012 ms | 127 ms
|
ViewUserInfo | 1 % | 503 | 0 | 3 ms | 9005 ms | 55 ms
|
ViewBidHistory | 1 % | 257 | 0 | 4 ms | 3228 ms | 79 ms
|
BuyNowAuth | 0 % | 251 | 0 | 2 ms | 2997 ms | 16 ms
|
BuyNow | 0 % | 214 | 38 | 4 ms | 9006 ms | 102 ms
|
StoreBuyBow | 0 % | 149 | 0 | 4 ms | 194 ms | 12 ms
|
PutBidAuth | 4 % | 1042 | 0 | 0 ms | 9017 ms | 50 ms
|
PutBid | 3 % | 937 | 139 | 4 ms | 9126 ms | 70 ms
|
StoreBid | 1 % | 491 | 0 | 4 ms | 9069 ms | 68 ms
|
PutCommentAuth | 0 % | 0 | 0 | 0 ms | 0 ms | 0 ms
|
PutComment | 0 % | 89 | 12 | 4 ms | 8996 ms | 109 ms
|
StoreComment | 0 % | 66 | 0 | 5 ms | 49 ms | 8 ms
|
Sell | 0 % | 203 | 0 | 0 ms | 9299 ms | 446 ms
|
SelectCategoryToSellItem | 0 % | 190 | 0 | 4 ms | 9816 ms | 516 ms
|
SellItemForm | 0 % | 179 | 0 | 2 ms | 9003 ms | 204 ms
|
RegisterItem | 0 % | 165 | 0 | 4 ms | 9002 ms | 143 ms
|
AboutMe (auth form) | 2 % | 590 | 0 | 0 ms | 21005 ms | 735 ms
|
AboutMe | 3 % | 775 | 0 | 8 ms | 21037 ms | 314 ms
|
Back probability | 6 % | 1694 | 0 | 0 ms | 0 ms | 0 ms
|
End of Session | 0 % | 196 | 0 | 0 ms | 0 ms | 0 ms
|
Total | 100 % | 25183 | 192 | - | - | 802 ms
|
Average throughput | 211 req/s
| |||||
Completed sessions | 167
| |||||
Total time | 11614 seconds
| |||||
Average session time | 69 seconds
| |||||
| State name | % of total | Count | Errors | Minimum Time | Maximum Time | Average Time |
|---|---|---|---|---|---|---|
Home | 4 % | 7058 | 0 | 0 ms | 24040 ms | 63 ms
|
Register | 1 % | 1499 | 0 | 0 ms | 24025 ms | 170 ms
|
RegisterUser | 1 % | 1464 | 26 | 5 ms | 24050 ms | 190 ms
|
Browse | 7 % | 10422 | 0 | 0 ms | 24031 ms | 180 ms
|
BrowseCategories | 5 % | 7234 | 0 | 3 ms | 24028 ms | 191 ms
|
SearchItemsInCategory | 15 % | 22482 | 0 | 0 ms | 22539 ms | 434 ms
|
BrowseRegions | 2 % | 3064 | 0 | 3 ms | 24081 ms | 226 ms
|
BrowseCategoriesInRegion | 2 % | 3022 | 0 | 3 ms | 23998 ms | 189 ms
|
SearchItemsInRegion | 4 % | 7124 | 0 | 0 ms | 24289 ms | 243 ms
|
ViewItem | 14 % | 20363 | 0 | 4 ms | 24043 ms | 203 ms
|
ViewUserInfo | 3 % | 4486 | 0 | 3 ms | 45013 ms | 240 ms
|
ViewBidHistory | 1 % | 2329 | 0 | 4 ms | 24036 ms | 244 ms
|
BuyNowAuth | 1 % | 1901 | 0 | 2 ms | 23918 ms | 166 ms
|
BuyNow | 1 % | 1866 | 261 | 4 ms | 24432 ms | 253 ms
|
StoreBuyBow | 1 % | 1580 | 0 | 4 ms | 22053 ms | 215 ms
|
PutBidAuth | 4 % | 7014 | 0 | 0 ms | 23665 ms | 149 ms
|
PutBid | 5 % | 7933 | 1064 | 0 ms | 24487 ms | 216 ms
|
StoreBid | 3 % | 5097 | 3 | 4 ms | 21005 ms | 204 ms
|
PutCommentAuth | 0 % | 0 | 0 | 0 ms | 0 ms | 0 ms
|
PutComment | 0 % | 624 | 68 | 4 ms | 10693 ms | 190 ms
|
StoreComment | 0 % | 549 | 0 | 4 ms | 12201 ms | 213 ms
|
Sell | 0 % | 822 | 0 | 0 ms | 23932 ms | 186 ms
|
SelectCategoryToSellItem | 0 % | 809 | 0 | 4 ms | 11711 ms | 303 ms
|
SellItemForm | 0 % | 795 | 0 | 2 ms | 12271 ms | 160 ms
|
RegisterItem | 0 % | 785 | 0 | 4 ms | 9963 ms | 188 ms
|
AboutMe (auth form) | 1 % | 2490 | 0 | 0 ms | 21000 ms | 186 ms
|
AboutMe | 2 % | 4199 | 0 | 9 ms | 22112 ms | 239 ms
|
Back probability | 10 % | 14616 | 0 | 0 ms | 0 ms | 0 ms
|
End of Session | 1 % | 2052 | 0 | 0 ms | 0 ms | 0 ms
|
Total | 100 % | 143679 | 1422 | - | - | 207 ms
|
Average throughput | 322 req/s
| |||||
Completed sessions | 2057
| |||||
Total time | 515449 seconds
| |||||
Average session time | 250 seconds
| |||||
| State name | % of total | Count | Errors | Minimum Time | Maximum Time | Average Time |
|---|---|---|---|---|---|---|
Home | 4 % | 224 | 0 | 0 ms | 2996 ms | 30 ms
|
Register | 1 % | 51 | 0 | 0 ms | 8994 ms | 490 ms
|
RegisterUser | 1 % | 52 | 2 | 5 ms | 4399 ms | 326 ms
|
Browse | 7 % | 356 | 0 | 0 ms | 9000 ms | 208 ms
|
BrowseCategories | 5 % | 260 | 0 | 3 ms | 9020 ms | 210 ms
|
SearchItemsInCategory | 15 % | 750 | 0 | 0 ms | 9199 ms | 358 ms
|
BrowseRegions | 1 % | 96 | 0 | 3 ms | 2422 ms | 70 ms
|
BrowseCategoriesInRegion | 1 % | 87 | 0 | 3 ms | 4291 ms | 117 ms
|
SearchItemsInRegion | 5 % | 248 | 0 | 0 ms | 4406 ms | 197 ms
|
ViewItem | 14 % | 707 | 0 | 4 ms | 9036 ms | 199 ms
|
ViewUserInfo | 2 % | 133 | 0 | 3 ms | 4418 ms | 191 ms
|
ViewBidHistory | 1 % | 74 | 0 | 4 ms | 9007 ms | 396 ms
|
BuyNowAuth | 1 % | 71 | 0 | 2 ms | 4152 ms | 190 ms
|
BuyNow | 1 % | 68 | 5 | 4 ms | 9002 ms | 196 ms
|
StoreBuyBow | 1 % | 57 | 0 | 4 ms | 4203 ms | 213 ms
|
PutBidAuth | 5 % | 267 | 0 | 0 ms | 9010 ms | 208 ms
|
PutBid | 5 % | 268 | 36 | 4 ms | 4422 ms | 155 ms
|
StoreBid | 3 % | 171 | 0 | 4 ms | 9044 ms | 422 ms
|
PutCommentAuth | 0 % | 0 | 0 | 0 ms | 0 ms | 0 ms
|
PutComment | 0 % | 30 | 0 | 5 ms | 2739 ms | 97 ms
|
StoreComment | 0 % | 17 | 0 | 4 ms | 2211 ms | 151 ms
|
Sell | 0 % | 28 | 0 | 0 ms | 1431 ms | 51 ms
|
SelectCategoryToSellItem | 0 % | 24 | 0 | 4 ms | 1994 ms | 164 ms
|
SellItemForm | 0 % | 30 | 0 | 2 ms | 9000 ms | 602 ms
|
RegisterItem | 0 % | 23 | 0 | 4 ms | 2429 ms | 113 ms
|
AboutMe (auth form) | 1 % | 90 | 0 | 0 ms | 9000 ms | 214 ms
|
AboutMe | 3 % | 146 | 0 | 11 ms | 9074 ms | 320 ms
|
Back probability | 9 % | 450 | 0 | 0 ms | 0 ms | 0 ms
|
End of Session | 1 % | 85 | 0 | 0 ms | 0 ms | 0 ms
|
Total | 100 % | 4863 | 43 | - | - | 206 ms
|
Average throughput | 163 req/s
| |||||
Completed sessions | 73
| |||||
Total time | 25264 seconds
| |||||
Average session time | 346 seconds
| |||||
| State name | % of total | Count | Errors | Minimum Time | Maximum Time | Average Time |
|---|---|---|---|---|---|---|
Home | 5 % | 10184 | 0 | 0 ms | 24040 ms | 1495 ms
|
Register | 1 % | 1884 | 0 | 0 ms | 24025 ms | 242 ms
|
RegisterUser | 1 % | 1817 | 31 | 5 ms | 24050 ms | 224 ms
|
Browse | 7 % | 13434 | 0 | 0 ms | 24031 ms | 285 ms
|
BrowseCategories | 5 % | 9227 | 0 | 3 ms | 24028 ms | 219 ms
|
SearchItemsInCategory | 15 % | 26924 | 0 | 0 ms | 22539 ms | 399 ms
|
BrowseRegions | 2 % | 3898 | 0 | 3 ms | 24081 ms | 240 ms
|
BrowseCategoriesInRegion | 2 % | 3792 | 0 | 3 ms | 23998 ms | 202 ms
|
SearchItemsInRegion | 4 % | 8637 | 0 | 0 ms | 24289 ms | 223 ms
|
ViewItem | 13 % | 24104 | 0 | 4 ms | 24043 ms | 193 ms
|
ViewUserInfo | 2 % | 5128 | 0 | 3 ms | 45013 ms | 220 ms
|
ViewBidHistory | 1 % | 2667 | 0 | 4 ms | 24036 ms | 232 ms
|
BuyNowAuth | 1 % | 2223 | 0 | 2 ms | 23918 ms | 149 ms
|
BuyNow | 1 % | 2148 | 305 | 4 ms | 24432 ms | 236 ms
|
StoreBuyBow | 1 % | 1786 | 0 | 4 ms | 22053 ms | 198 ms
|
PutBidAuth | 4 % | 8323 | 0 | 0 ms | 23665 ms | 138 ms
|
PutBid | 5 % | 9157 | 1239 | 0 ms | 24487 ms | 198 ms
|
StoreBid | 3 % | 5759 | 3 | 4 ms | 21005 ms | 199 ms
|
PutCommentAuth | 0 % | 0 | 0 | 0 ms | 0 ms | 0 ms
|
PutComment | 0 % | 743 | 80 | 4 ms | 10693 ms | 176 ms
|
StoreComment | 0 % | 632 | 0 | 4 ms | 12201 ms | 190 ms
|
Sell | 0 % | 1053 | 0 | 0 ms | 23932 ms | 233 ms
|
SelectCategoryToSellItem | 0 % | 1023 | 0 | 4 ms | 11711 ms | 339 ms
|
SellItemForm | 0 % | 1004 | 0 | 2 ms | 12271 ms | 181 ms
|
RegisterItem | 0 % | 973 | 0 | 4 ms | 9963 ms | 179 ms
|
AboutMe (auth form) | 1 % | 3170 | 0 | 0 ms | 21005 ms | 289 ms
|
AboutMe | 2 % | 5140 | 0 | 8 ms | 22112 ms | 251 ms
|
Back probability | 9 % | 16761 | 0 | 0 ms | 0 ms | 0 ms
|
End of Session | 1 % | 2334 | 0 | 0 ms | 0 ms | 0 ms
|
Total | 100 % | 173925 | 1658 | - | - | 293 ms
|
Average throughput | 292 req/s
| |||||
Completed sessions | 2334
| |||||
Total time | 565292 seconds
| |||||
Average session time | 242 seconds
| |||||
An error occured while waiting for remote processes termination (Skipping waits)
Command is: /usr/bin/scp farm6.csail.mit.edu:/tmp/client1 /home/drkp/sandbox/txcache/src/RUBiS-1.4.3/bench/2009-3-19@20:17:13//client1.bin
Command is: /usr/bin/ssh -x localhost /bin/bash -c 'LANG=en_GB.UTF-8 /usr/bin/sar -n DEV -n SOCK -rubcw 1 605 -f /home/drkp/sandbox/txcache/src/RUBiS-1.4.3/bench/2009-3-19@20:17:13//client1.bin > /home/drkp/sandbox/txcache/src/RUBiS-1.4.3/bench/2009-3-19@20:17:13//client1'
Command is: /usr/bin/scp farm14:/tmp/db_server0 /home/drkp/sandbox/txcache/src/RUBiS-1.4.3/bench/2009-3-19@20:17:13//db_server0.bin
Command is: /usr/bin/ssh -x localhost /bin/bash -c 'LANG=en_GB.UTF-8 /usr/bin/sar -n DEV -n SOCK -rubcw 1 605 -f /home/drkp/sandbox/txcache/src/RUBiS-1.4.3/bench/2009-3-19@20:17:13//db_server0.bin > /home/drkp/sandbox/txcache/src/RUBiS-1.4.3/bench/2009-3-19@20:17:13//db_server0'
Command is: /usr/bin/scp farm12.csail.mit.edu:/tmp/web_server0 /home/drkp/sandbox/txcache/src/RUBiS-1.4.3/bench/2009-3-19@20:17:13//web_server0.bin
Command is: /usr/bin/ssh -x localhost /bin/bash -c 'LANG=en_GB.UTF-8 /usr/bin/sar -n DEV -n SOCK -rubcw 1 605 -f /home/drkp/sandbox/txcache/src/RUBiS-1.4.3/bench/2009-3-19@20:17:13//web_server0.bin > /home/drkp/sandbox/txcache/src/RUBiS-1.4.3/bench/2009-3-19@20:17:13//web_server0'
Command is: /usr/bin/scp farm13.csail.mit.edu:/tmp/web_server1 /home/drkp/sandbox/txcache/src/RUBiS-1.4.3/bench/2009-3-19@20:17:13//web_server1.bin
Command is: /usr/bin/ssh -x localhost /bin/bash -c 'LANG=en_GB.UTF-8 /usr/bin/sar -n DEV -n SOCK -rubcw 1 605 -f /home/drkp/sandbox/txcache/src/RUBiS-1.4.3/bench/2009-3-19@20:17:13//web_server1.bin > /home/drkp/sandbox/txcache/src/RUBiS-1.4.3/bench/2009-3-19@20:17:13//web_server1'
Command is: /usr/bin/scp localhost:/tmp/client0 /home/drkp/sandbox/txcache/src/RUBiS-1.4.3/bench/2009-3-19@20:17:13//client0.bin
Command is: /usr/bin/ssh -x localhost /bin/bash -c 'LANG=en_GB.UTF-8 /usr/bin/sar -n DEV -n SOCK -rubcw 1 605 -f /home/drkp/sandbox/txcache/src/RUBiS-1.4.3/bench/2009-3-19@20:17:13//client0.bin > /home/drkp/sandbox/txcache/src/RUBiS-1.4.3/bench/2009-3-19@20:17:13//client0'
Command is: /usr/bin/scp farm6.csail.mit.edu:/tmp/trace_client1.html /home/drkp/sandbox/txcache/src/RUBiS-1.4.3/bench/2009-3-19@20:17:13//
Command is: /usr/bin/scp farm6.csail.mit.edu:/tmp/stat_client1.html /home/drkp/sandbox/txcache/src/RUBiS-1.4.3/bench/2009-3-19@20:17:13//
|
|
|
|
|
|
 | 
|
 | 
|
 | 
|
 | 
|
 | 
|
 | 
|
 | 
|
 | 
|
 | 
|