Node information
Test timing information
Up ramp statistics
Runtime session statistics
Down ramp statistics
Overall statistics
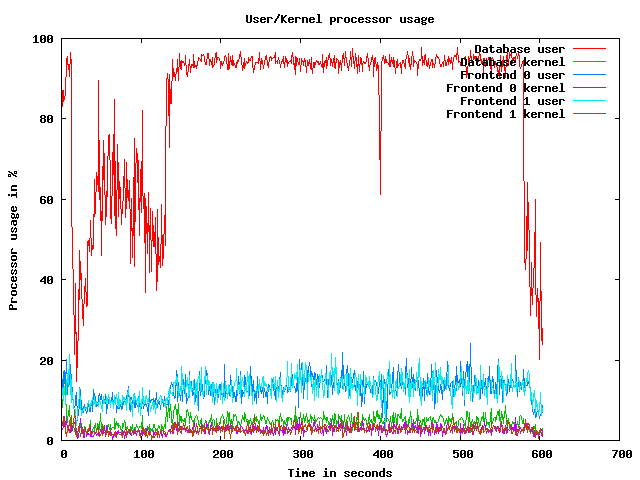
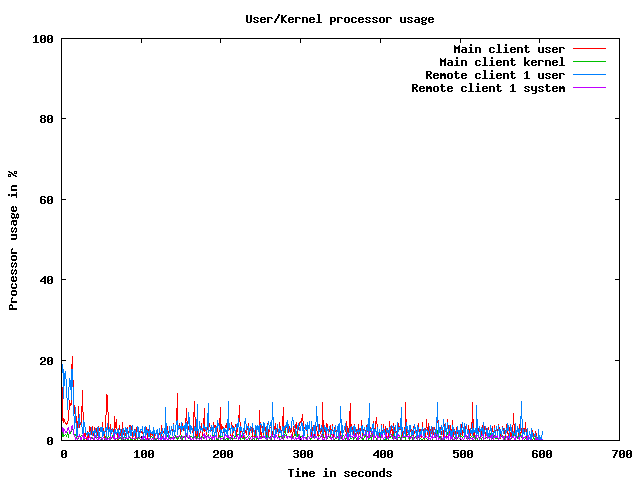
CPU usage graphs
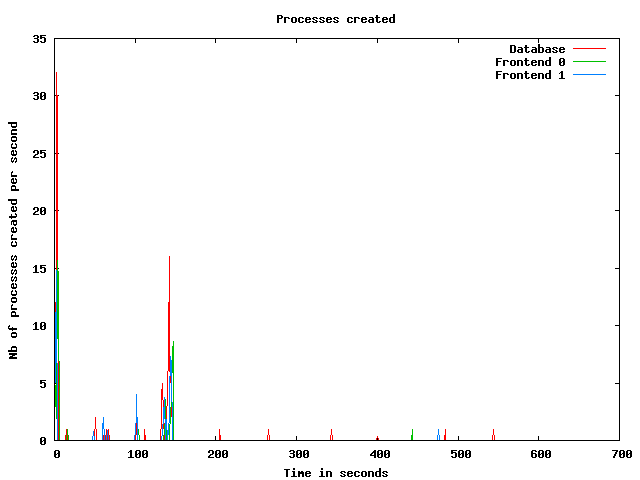
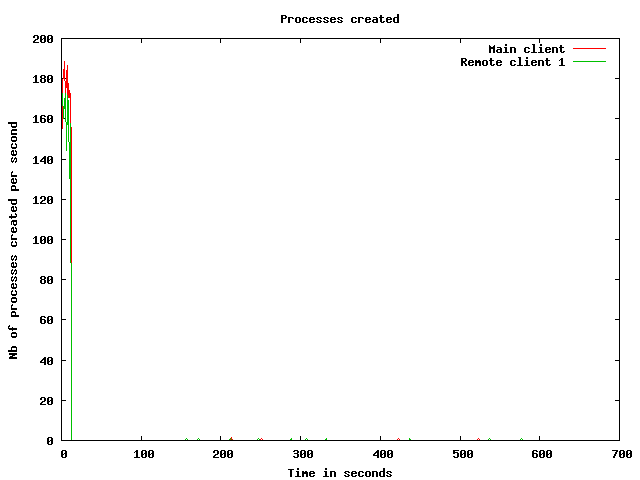
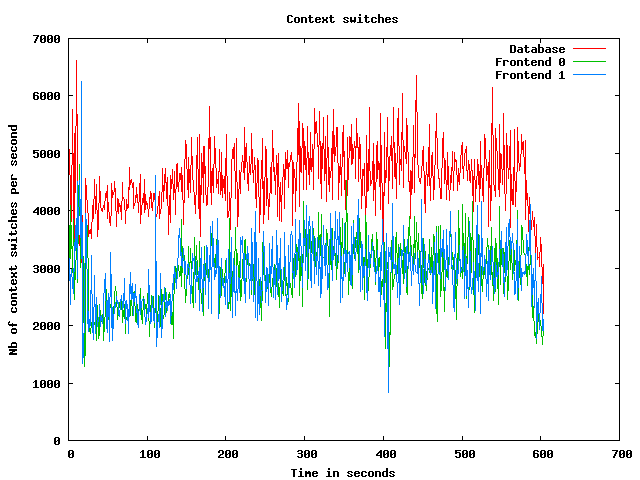
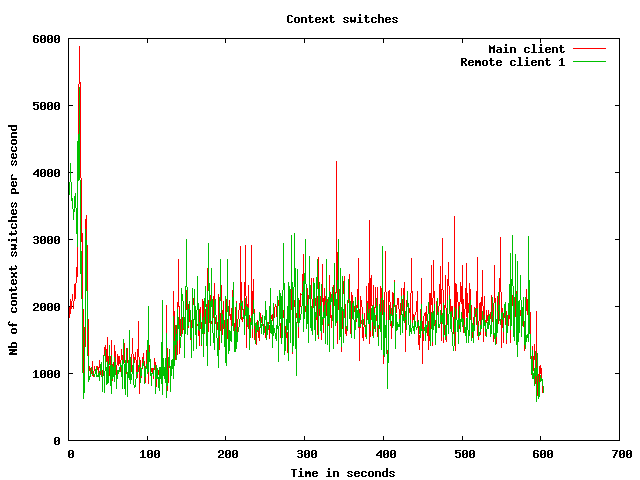
Processes usage graphs
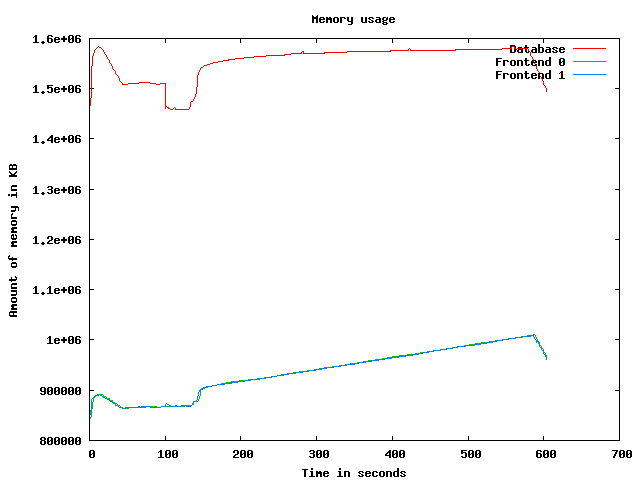
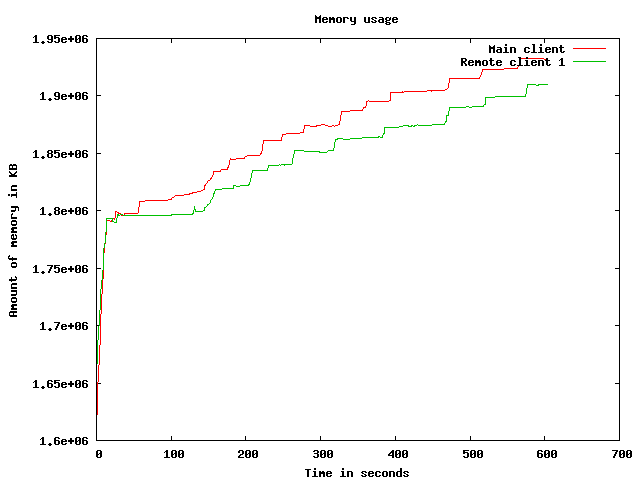
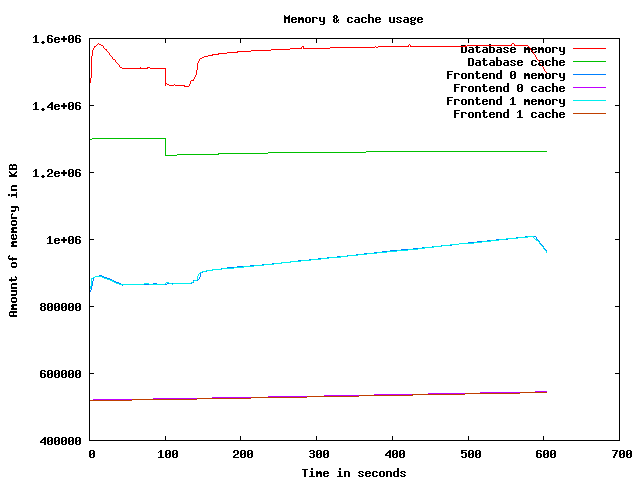
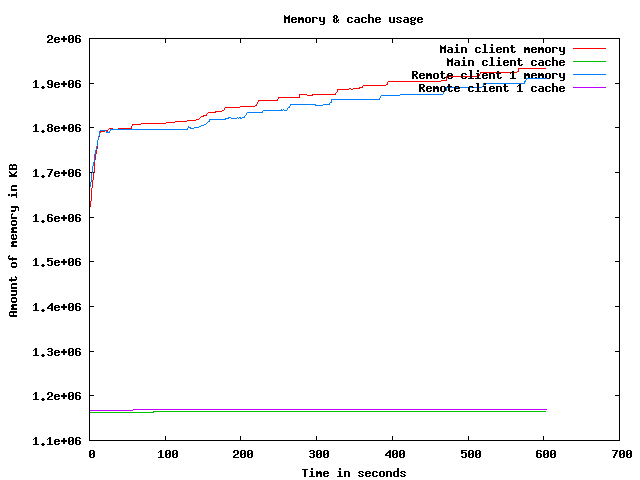
Memory usage graph
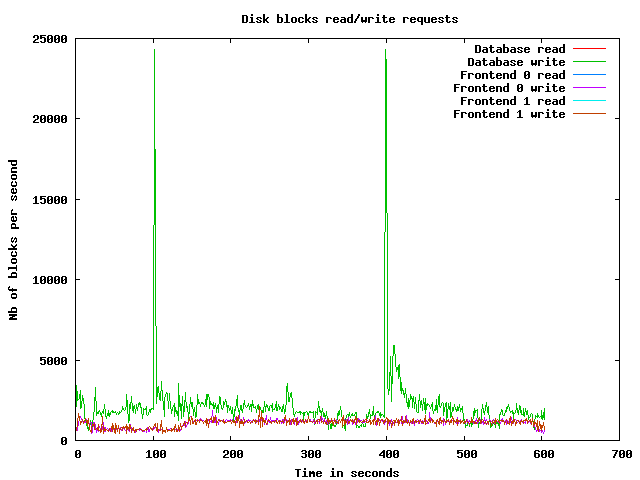
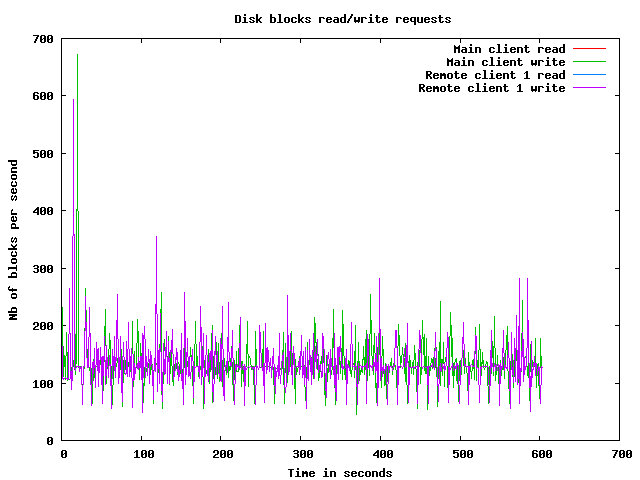
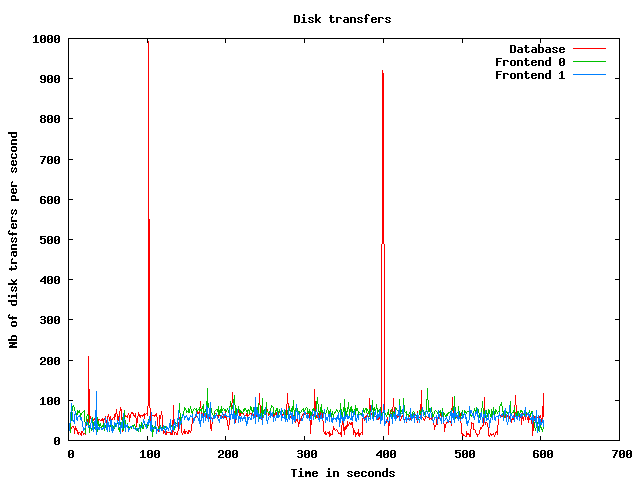
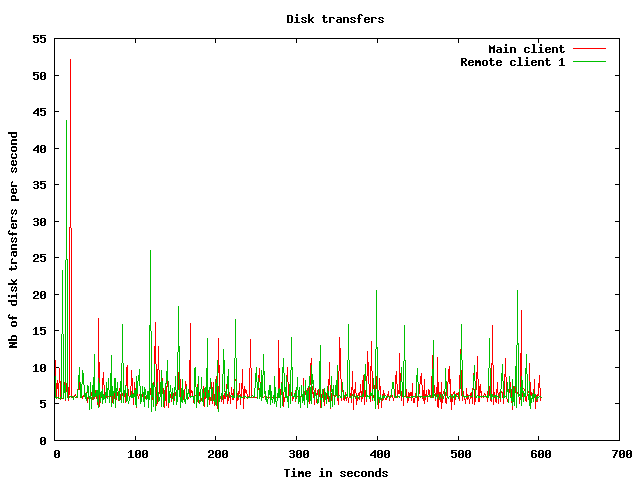
Disk usage graphs
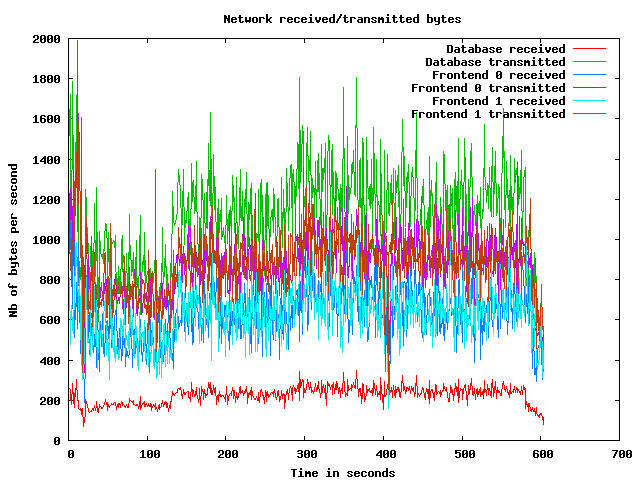
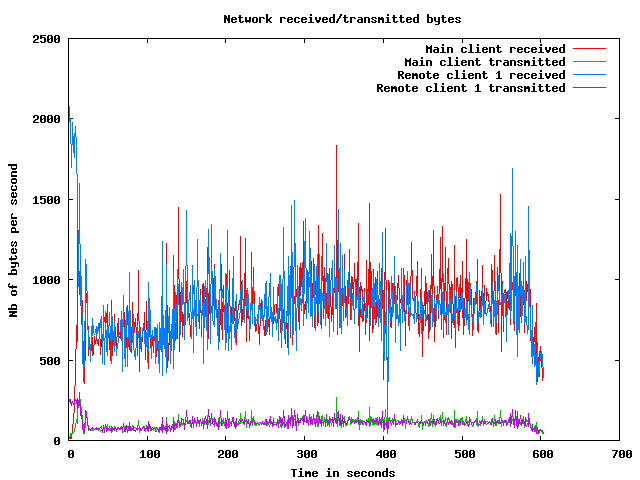
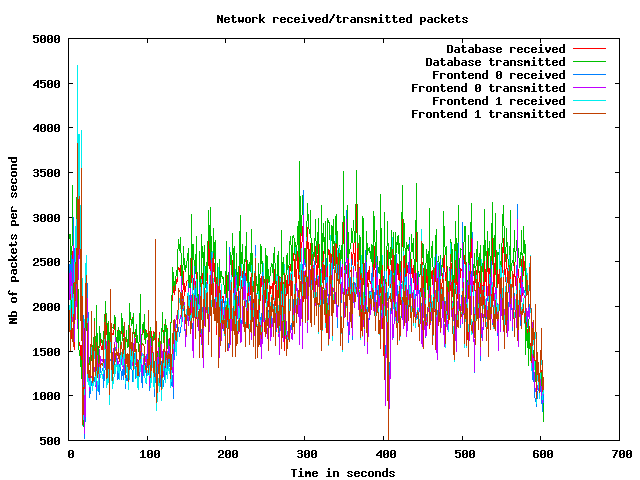
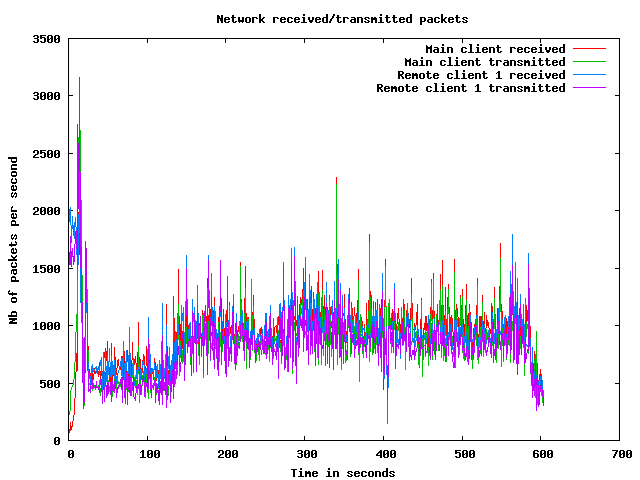
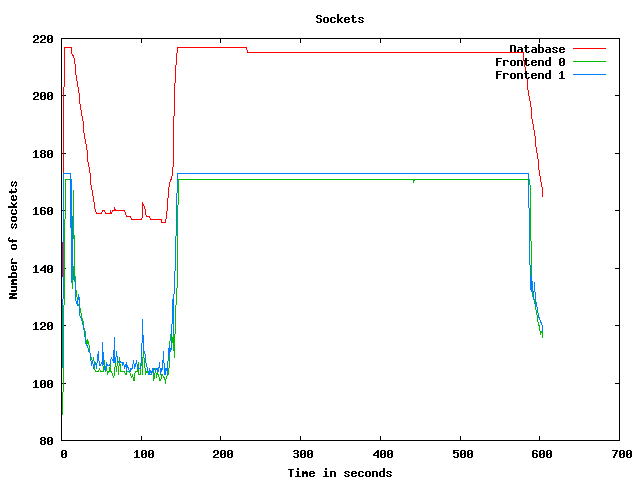
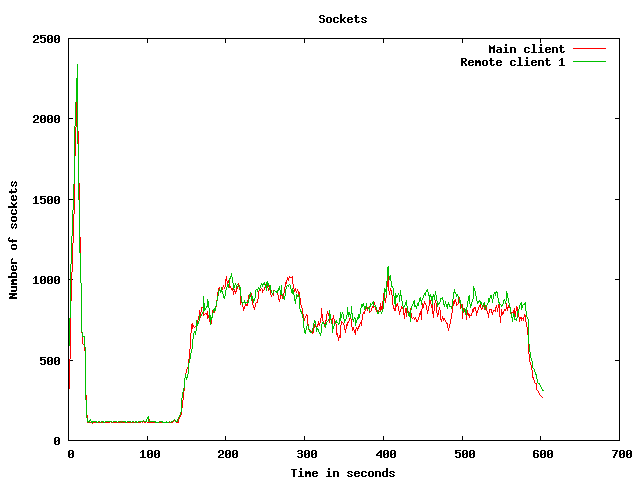
Network usage graphs
| Test start | 2009-3-19 20:30:9 |
| Up ramp start | 2009-3-19 20:30:24 |
| Runtime session start | 2009-3-19 20:32:24 |
| Down ramp start | 2009-3-19 20:39:54 |
| Test end | 2009-3-19 20:42:25 |
| Up ramp length | 2 minutes 0 millisecond (requested 120000 ms) |
| Runtime session length | 7 minutes 30 seconds 0 millisecond (requested 450000 ms) |
| Down ramp length | 30 seconds 1 millisecond (requested 30000 ms) |
| Total test length | 12 minutes 15 seconds 256 milliseconds |
| State name | % of total | Count | Errors | Minimum Time | Maximum Time | Average Time |
|---|---|---|---|---|---|---|
Home | 12 % | 3231 | 0 | 0 ms | 21035 ms | 6514 ms
|
Register | 1 % | 419 | 0 | 0 ms | 9496 ms | 134 ms
|
RegisterUser | 1 % | 373 | 7 | 4 ms | 9022 ms | 108 ms
|
Browse | 10 % | 2857 | 0 | 0 ms | 9618 ms | 259 ms
|
BrowseCategories | 7 % | 1851 | 0 | 3 ms | 9148 ms | 141 ms
|
SearchItemsInCategory | 14 % | 3707 | 0 | 0 ms | 9552 ms | 120 ms
|
BrowseRegions | 2 % | 783 | 0 | 3 ms | 9007 ms | 117 ms
|
BrowseCategoriesInRegion | 2 % | 731 | 0 | 3 ms | 9004 ms | 96 ms
|
SearchItemsInRegion | 5 % | 1347 | 0 | 0 ms | 9019 ms | 78 ms
|
ViewItem | 11 % | 3107 | 0 | 4 ms | 9011 ms | 52 ms
|
ViewUserInfo | 1 % | 438 | 0 | 3 ms | 3054 ms | 24 ms
|
ViewBidHistory | 0 % | 224 | 0 | 4 ms | 3374 ms | 51 ms
|
BuyNowAuth | 0 % | 264 | 0 | 2 ms | 3068 ms | 21 ms
|
BuyNow | 0 % | 222 | 37 | 4 ms | 3120 ms | 24 ms
|
StoreBuyBow | 0 % | 146 | 0 | 4 ms | 57 ms | 10 ms
|
PutBidAuth | 3 % | 1043 | 0 | 0 ms | 3299 ms | 7 ms
|
PutBid | 3 % | 904 | 138 | 4 ms | 6356 ms | 28 ms
|
StoreBid | 1 % | 475 | 0 | 4 ms | 3490 ms | 32 ms
|
PutCommentAuth | 0 % | 0 | 0 | 0 ms | 0 ms | 0 ms
|
PutComment | 0 % | 78 | 9 | 4 ms | 909 ms | 22 ms
|
StoreComment | 0 % | 56 | 0 | 5 ms | 61 ms | 10 ms
|
Sell | 0 % | 245 | 0 | 0 ms | 9178 ms | 336 ms
|
SelectCategoryToSellItem | 0 % | 215 | 0 | 4 ms | 9136 ms | 318 ms
|
SellItemForm | 0 % | 195 | 0 | 2 ms | 3207 ms | 56 ms
|
RegisterItem | 0 % | 176 | 0 | 4 ms | 9006 ms | 96 ms
|
AboutMe (auth form) | 2 % | 622 | 0 | 0 ms | 9001 ms | 162 ms
|
AboutMe | 3 % | 793 | 0 | 9 ms | 9060 ms | 147 ms
|
Back probability | 6 % | 1684 | 0 | 0 ms | 0 ms | 0 ms
|
End of Session | 0 % | 243 | 0 | 0 ms | 0 ms | 0 ms
|
Total | 100 % | 26429 | 191 | - | - | 883 ms
|
Average throughput | 221 req/s
| |||||
Completed sessions | 213
| |||||
Total time | 17101 seconds
| |||||
Average session time | 80 seconds
| |||||
| State name | % of total | Count | Errors | Minimum Time | Maximum Time | Average Time |
|---|---|---|---|---|---|---|
Home | 4 % | 5539 | 0 | 0 ms | 201830 ms | 1101 ms
|
Register | 1 % | 1178 | 0 | 0 ms | 189996 ms | 2266 ms
|
RegisterUser | 1 % | 1158 | 28 | 6 ms | 195869 ms | 3120 ms
|
Browse | 7 % | 8392 | 0 | 0 ms | 194494 ms | 2555 ms
|
BrowseCategories | 5 % | 5914 | 0 | 4 ms | 201948 ms | 2548 ms
|
SearchItemsInCategory | 16 % | 18410 | 0 | 0 ms | 381690 ms | 3398 ms
|
BrowseRegions | 2 % | 2391 | 0 | 3 ms | 203558 ms | 2672 ms
|
BrowseCategoriesInRegion | 2 % | 2340 | 0 | 4 ms | 194837 ms | 2221 ms
|
SearchItemsInRegion | 4 % | 5488 | 0 | 0 ms | 196641 ms | 2801 ms
|
ViewItem | 14 % | 16072 | 0 | 4 ms | 403465 ms | 2729 ms
|
ViewUserInfo | 3 % | 3513 | 0 | 4 ms | 201607 ms | 2424 ms
|
ViewBidHistory | 1 % | 1898 | 0 | 4 ms | 215152 ms | 2952 ms
|
BuyNowAuth | 1 % | 1455 | 0 | 2 ms | 202556 ms | 2339 ms
|
BuyNow | 1 % | 1440 | 232 | 4 ms | 203909 ms | 2758 ms
|
StoreBuyBow | 1 % | 1197 | 2 | 5 ms | 194517 ms | 3192 ms
|
PutBidAuth | 4 % | 5585 | 0 | 0 ms | 203692 ms | 2468 ms
|
PutBid | 5 % | 6404 | 790 | 4 ms | 204030 ms | 2724 ms
|
StoreBid | 3 % | 4158 | 2 | 5 ms | 239428 ms | 3105 ms
|
PutCommentAuth | 0 % | 0 | 0 | 0 ms | 0 ms | 0 ms
|
PutComment | 0 % | 536 | 40 | 5 ms | 50159 ms | 1652 ms
|
StoreComment | 0 % | 493 | 0 | 5 ms | 50672 ms | 2271 ms
|
Sell | 0 % | 633 | 0 | 0 ms | 190002 ms | 2457 ms
|
SelectCategoryToSellItem | 0 % | 637 | 0 | 4 ms | 190066 ms | 2192 ms
|
SellItemForm | 0 % | 632 | 0 | 2 ms | 193014 ms | 2725 ms
|
RegisterItem | 0 % | 622 | 0 | 4 ms | 190010 ms | 2727 ms
|
AboutMe (auth form) | 1 % | 1980 | 0 | 0 ms | 190009 ms | 2081 ms
|
AboutMe | 2 % | 3356 | 0 | 10 ms | 241478 ms | 2612 ms
|
Back probability | 10 % | 11514 | 0 | 0 ms | 0 ms | 0 ms
|
End of Session | 1 % | 1595 | 0 | 0 ms | 0 ms | 0 ms
|
Total | 100 % | 114530 | 1094 | - | - | 2361 ms
|
Average throughput | 256 req/s
| |||||
Completed sessions | 1610
| |||||
Total time | 435151 seconds
| |||||
Average session time | 270 seconds
| |||||
| State name | % of total | Count | Errors | Minimum Time | Maximum Time | Average Time |
|---|---|---|---|---|---|---|
Home | 4 % | 225 | 0 | 0 ms | 92999 ms | 1920 ms
|
Register | 1 % | 55 | 0 | 0 ms | 190001 ms | 9027 ms
|
RegisterUser | 0 % | 50 | 0 | 5 ms | 45006 ms | 1625 ms
|
Browse | 6 % | 351 | 0 | 0 ms | 190004 ms | 5388 ms
|
BrowseCategories | 4 % | 233 | 0 | 3 ms | 287348 ms | 8184 ms
|
SearchItemsInCategory | 15 % | 772 | 0 | 0 ms | 190908 ms | 7882 ms
|
BrowseRegions | 2 % | 124 | 0 | 4 ms | 190033 ms | 8519 ms
|
BrowseCategoriesInRegion | 2 % | 115 | 0 | 3 ms | 190012 ms | 9662 ms
|
SearchItemsInRegion | 5 % | 271 | 0 | 0 ms | 190046 ms | 7807 ms
|
ViewItem | 14 % | 750 | 0 | 4 ms | 283017 ms | 7017 ms
|
ViewUserInfo | 3 % | 173 | 0 | 3 ms | 190006 ms | 6598 ms
|
ViewBidHistory | 1 % | 77 | 0 | 4 ms | 93031 ms | 5109 ms
|
BuyNowAuth | 1 % | 75 | 0 | 2 ms | 96477 ms | 4826 ms
|
BuyNow | 1 % | 67 | 11 | 4 ms | 190012 ms | 5382 ms
|
StoreBuyBow | 0 % | 49 | 0 | 4 ms | 96759 ms | 6276 ms
|
PutBidAuth | 4 % | 245 | 0 | 0 ms | 283011 ms | 4133 ms
|
PutBid | 5 % | 274 | 40 | 4 ms | 190070 ms | 4985 ms
|
StoreBid | 3 % | 164 | 0 | 5 ms | 235011 ms | 5575 ms
|
PutCommentAuth | 0 % | 0 | 0 | 0 ms | 0 ms | 0 ms
|
PutComment | 0 % | 25 | 4 | 4 ms | 5395 ms | 396 ms
|
StoreComment | 0 % | 16 | 0 | 5 ms | 3967 ms | 278 ms
|
Sell | 0 % | 28 | 0 | 0 ms | 92994 ms | 4071 ms
|
SelectCategoryToSellItem | 0 % | 24 | 0 | 4 ms | 190039 ms | 16619 ms
|
SellItemForm | 0 % | 27 | 0 | 2 ms | 98031 ms | 4678 ms
|
RegisterItem | 0 % | 29 | 0 | 5 ms | 190014 ms | 10343 ms
|
AboutMe (auth form) | 1 % | 83 | 0 | 0 ms | 189998 ms | 10804 ms
|
AboutMe | 2 % | 151 | 0 | 9 ms | 190017 ms | 5280 ms
|
Back probability | 10 % | 550 | 0 | 0 ms | 0 ms | 0 ms
|
End of Session | 1 % | 64 | 0 | 0 ms | 0 ms | 0 ms
|
Total | 100 % | 5067 | 55 | - | - | 5651 ms
|
Average throughput | 170 req/s
| |||||
Completed sessions | 47
| |||||
Total time | 21171 seconds
| |||||
Average session time | 450 seconds
| |||||
| State name | % of total | Count | Errors | Minimum Time | Maximum Time | Average Time |
|---|---|---|---|---|---|---|
Home | 6 % | 8996 | 0 | 0 ms | 201830 ms | 3161 ms
|
Register | 1 % | 1653 | 0 | 0 ms | 190001 ms | 1949 ms
|
RegisterUser | 1 % | 1581 | 35 | 4 ms | 195869 ms | 2421 ms
|
Browse | 7 % | 11610 | 0 | 0 ms | 194494 ms | 2253 ms
|
BrowseCategories | 5 % | 8005 | 0 | 3 ms | 287348 ms | 2236 ms
|
SearchItemsInCategory | 15 % | 23039 | 0 | 0 ms | 381690 ms | 3127 ms
|
BrowseRegions | 2 % | 3304 | 0 | 3 ms | 203558 ms | 2538 ms
|
BrowseCategoriesInRegion | 2 % | 3192 | 0 | 3 ms | 194837 ms | 2116 ms
|
SearchItemsInRegion | 4 % | 7130 | 0 | 0 ms | 196641 ms | 2560 ms
|
ViewItem | 13 % | 19995 | 0 | 4 ms | 403465 ms | 2601 ms
|
ViewUserInfo | 2 % | 4138 | 0 | 3 ms | 201607 ms | 2542 ms
|
ViewBidHistory | 1 % | 2207 | 0 | 4 ms | 215152 ms | 3021 ms
|
BuyNowAuth | 1 % | 1796 | 0 | 2 ms | 202556 ms | 2100 ms
|
BuyNow | 1 % | 1729 | 281 | 4 ms | 203909 ms | 2670 ms
|
StoreBuyBow | 0 % | 1394 | 2 | 4 ms | 194517 ms | 3165 ms
|
PutBidAuth | 4 % | 6876 | 0 | 0 ms | 283011 ms | 2277 ms
|
PutBid | 5 % | 7609 | 968 | 4 ms | 283007 ms | 2699 ms
|
StoreBid | 3 % | 4803 | 2 | 4 ms | 239428 ms | 2901 ms
|
PutCommentAuth | 0 % | 0 | 0 | 0 ms | 0 ms | 0 ms
|
PutComment | 0 % | 642 | 53 | 4 ms | 50159 ms | 1397 ms
|
StoreComment | 0 % | 565 | 0 | 5 ms | 190005 ms | 2327 ms
|
Sell | 0 % | 906 | 0 | 0 ms | 190002 ms | 2139 ms
|
SelectCategoryToSellItem | 0 % | 878 | 0 | 4 ms | 190066 ms | 2122 ms
|
SellItemForm | 0 % | 854 | 0 | 2 ms | 193014 ms | 2177 ms
|
RegisterItem | 0 % | 827 | 0 | 4 ms | 190014 ms | 3007 ms
|
AboutMe (auth form) | 1 % | 2688 | 0 | 0 ms | 190009 ms | 1974 ms
|
AboutMe | 2 % | 4338 | 0 | 9 ms | 241478 ms | 2253 ms
|
Back probability | 9 % | 13766 | 0 | 0 ms | 0 ms | 0 ms
|
End of Session | 1 % | 1905 | 0 | 0 ms | 0 ms | 0 ms
|
Total | 100 % | 146426 | 1341 | - | - | 2318 ms
|
Average throughput | 246 req/s
| |||||
Completed sessions | 1905
| |||||
Total time | 488987 seconds
| |||||
Average session time | 256 seconds
| |||||
An error occured while waiting for remote processes termination (Skipping waits)
Command is: /usr/bin/scp farm6.csail.mit.edu:/tmp/client1 /home/drkp/sandbox/txcache/src/RUBiS-1.4.3/bench/2009-3-19@20:30:9//client1.bin
Command is: /usr/bin/ssh -x localhost /bin/bash -c 'LANG=en_GB.UTF-8 /usr/bin/sar -n DEV -n SOCK -rubcw 1 605 -f /home/drkp/sandbox/txcache/src/RUBiS-1.4.3/bench/2009-3-19@20:30:9//client1.bin > /home/drkp/sandbox/txcache/src/RUBiS-1.4.3/bench/2009-3-19@20:30:9//client1'
Command is: /usr/bin/scp farm14:/tmp/db_server0 /home/drkp/sandbox/txcache/src/RUBiS-1.4.3/bench/2009-3-19@20:30:9//db_server0.bin
Command is: /usr/bin/ssh -x localhost /bin/bash -c 'LANG=en_GB.UTF-8 /usr/bin/sar -n DEV -n SOCK -rubcw 1 605 -f /home/drkp/sandbox/txcache/src/RUBiS-1.4.3/bench/2009-3-19@20:30:9//db_server0.bin > /home/drkp/sandbox/txcache/src/RUBiS-1.4.3/bench/2009-3-19@20:30:9//db_server0'
Command is: /usr/bin/scp farm12.csail.mit.edu:/tmp/web_server0 /home/drkp/sandbox/txcache/src/RUBiS-1.4.3/bench/2009-3-19@20:30:9//web_server0.bin
Command is: /usr/bin/ssh -x localhost /bin/bash -c 'LANG=en_GB.UTF-8 /usr/bin/sar -n DEV -n SOCK -rubcw 1 605 -f /home/drkp/sandbox/txcache/src/RUBiS-1.4.3/bench/2009-3-19@20:30:9//web_server0.bin > /home/drkp/sandbox/txcache/src/RUBiS-1.4.3/bench/2009-3-19@20:30:9//web_server0'
Command is: /usr/bin/scp farm13.csail.mit.edu:/tmp/web_server1 /home/drkp/sandbox/txcache/src/RUBiS-1.4.3/bench/2009-3-19@20:30:9//web_server1.bin
Command is: /usr/bin/ssh -x localhost /bin/bash -c 'LANG=en_GB.UTF-8 /usr/bin/sar -n DEV -n SOCK -rubcw 1 605 -f /home/drkp/sandbox/txcache/src/RUBiS-1.4.3/bench/2009-3-19@20:30:9//web_server1.bin > /home/drkp/sandbox/txcache/src/RUBiS-1.4.3/bench/2009-3-19@20:30:9//web_server1'
Command is: /usr/bin/scp localhost:/tmp/client0 /home/drkp/sandbox/txcache/src/RUBiS-1.4.3/bench/2009-3-19@20:30:9//client0.bin
Command is: /usr/bin/ssh -x localhost /bin/bash -c 'LANG=en_GB.UTF-8 /usr/bin/sar -n DEV -n SOCK -rubcw 1 605 -f /home/drkp/sandbox/txcache/src/RUBiS-1.4.3/bench/2009-3-19@20:30:9//client0.bin > /home/drkp/sandbox/txcache/src/RUBiS-1.4.3/bench/2009-3-19@20:30:9//client0'
Command is: /usr/bin/scp farm6.csail.mit.edu:/tmp/trace_client1.html /home/drkp/sandbox/txcache/src/RUBiS-1.4.3/bench/2009-3-19@20:30:9//
Command is: /usr/bin/scp farm6.csail.mit.edu:/tmp/stat_client1.html /home/drkp/sandbox/txcache/src/RUBiS-1.4.3/bench/2009-3-19@20:30:9//
|
|
|
|
|
|
 | 
|
 | 
|
 | 
|
 | 
|
 | 
|
 | 
|
 | 
|
 | 
|
 | 
|