Node information
Test timing information
Up ramp statistics
Runtime session statistics
Down ramp statistics
Overall statistics
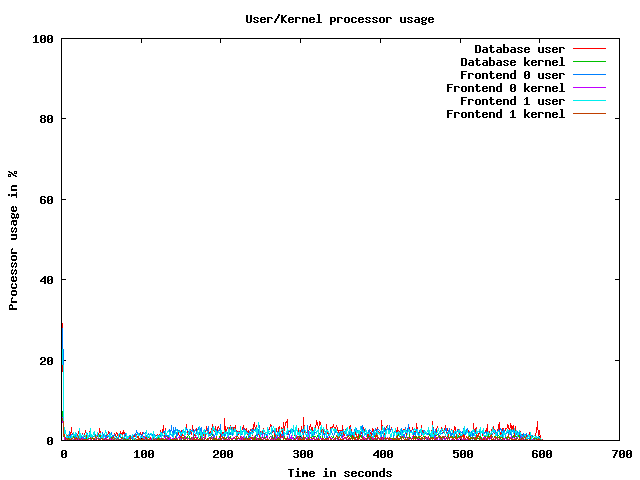
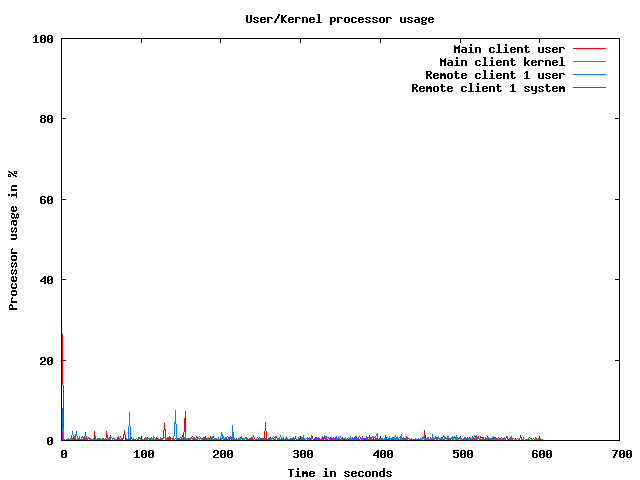
CPU usage graphs
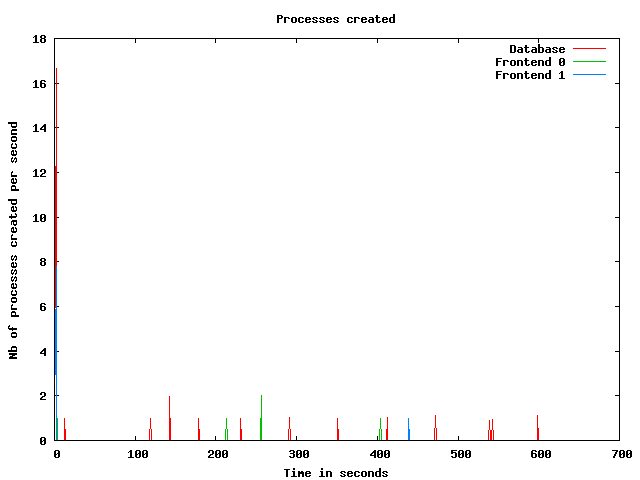
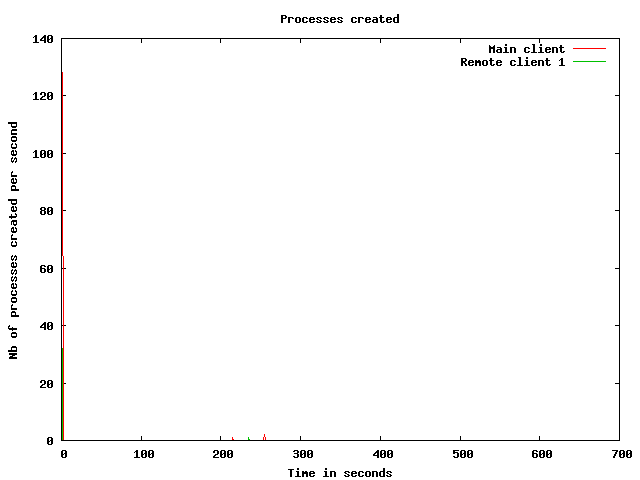
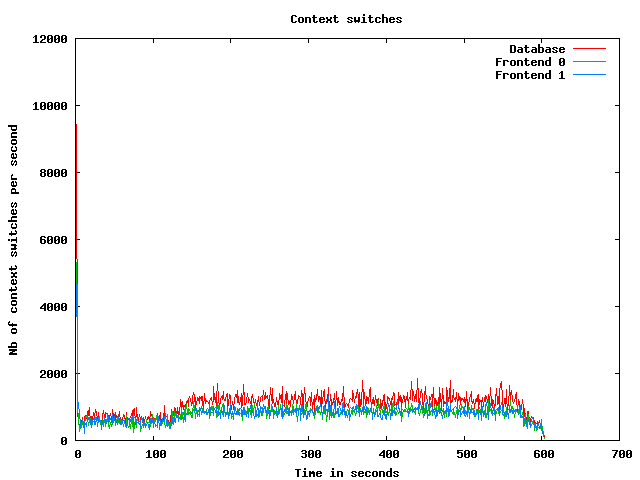
Processes usage graphs
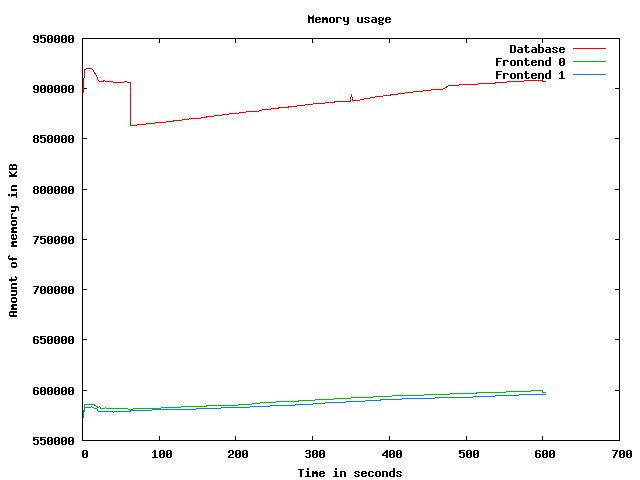
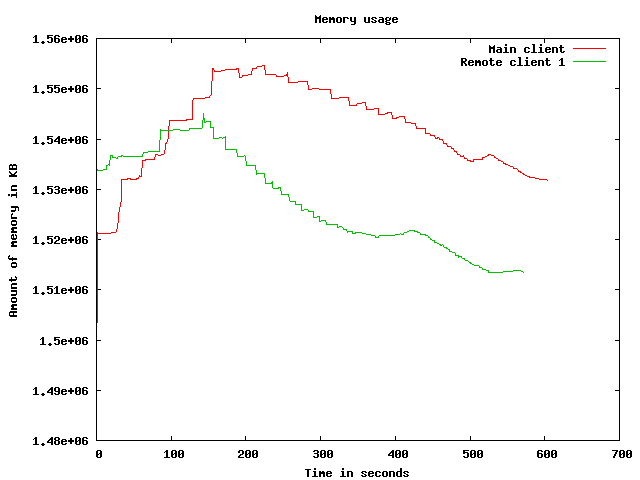
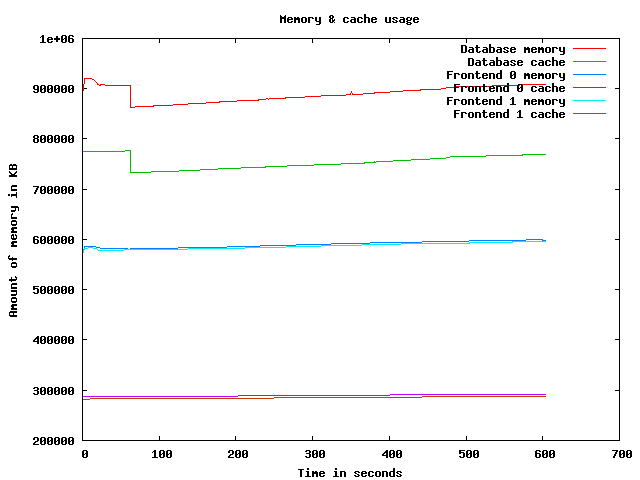
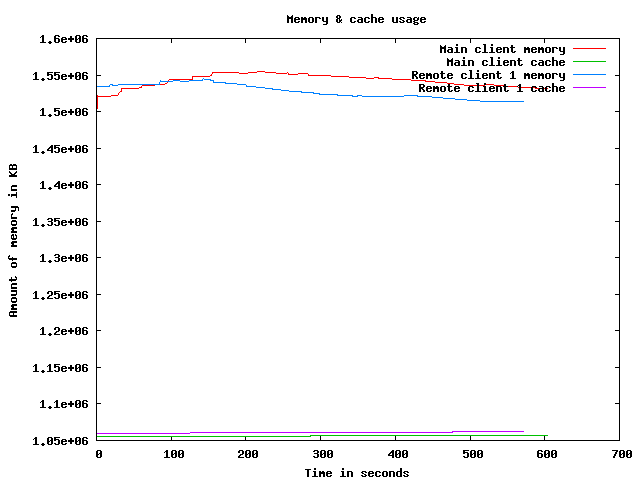
Memory usage graph
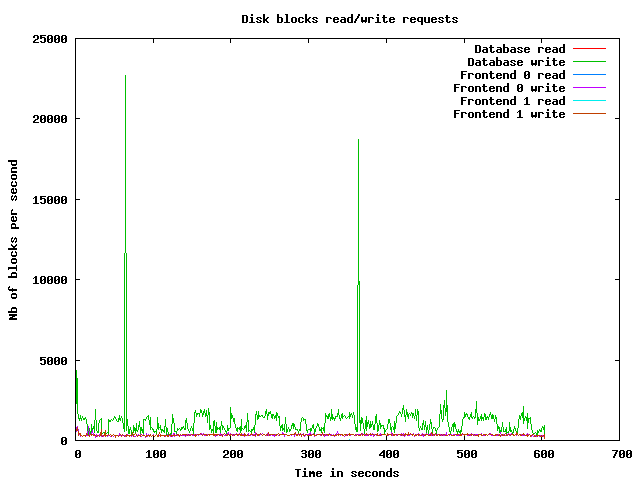
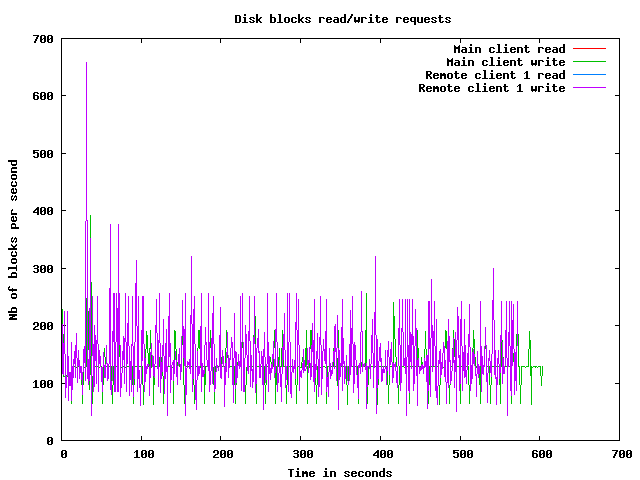
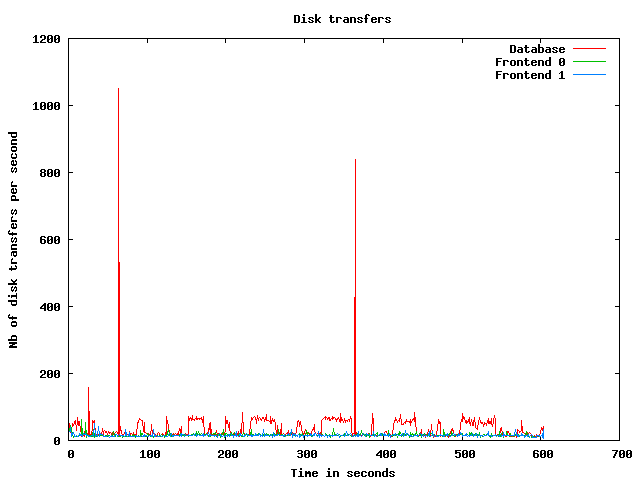
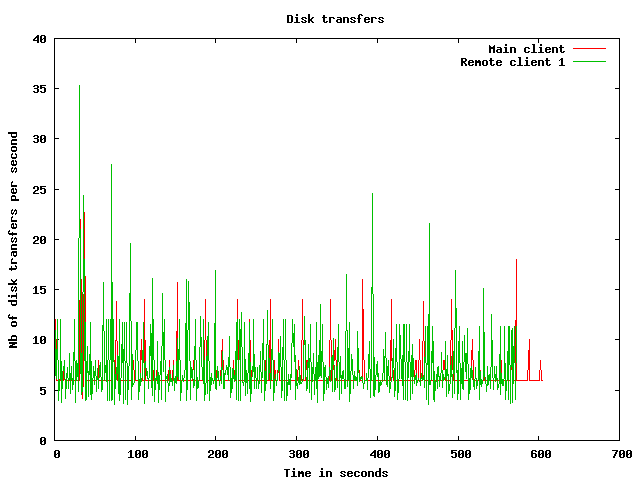
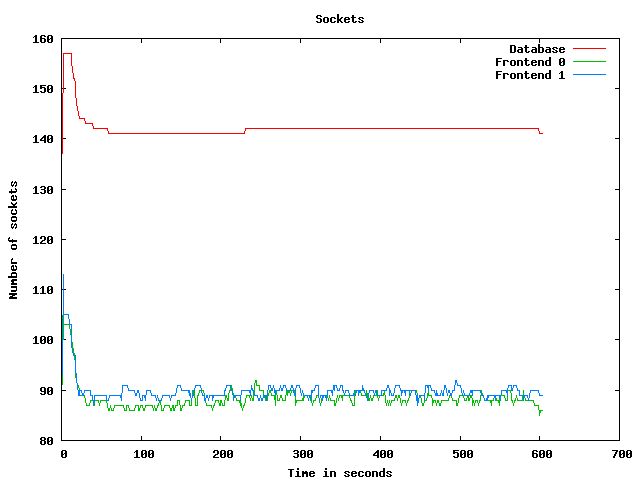
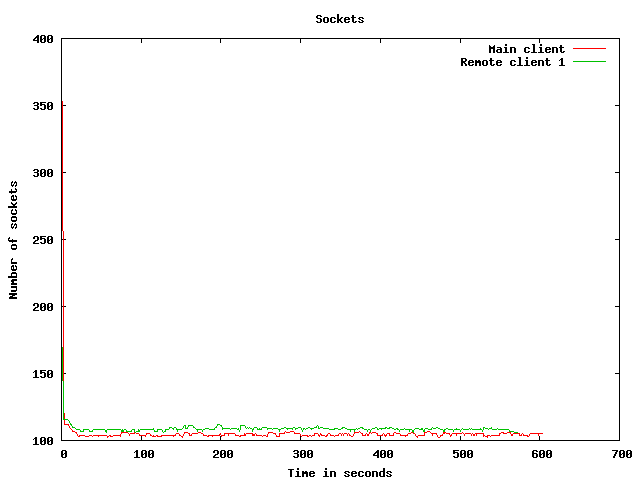
Disk usage graphs
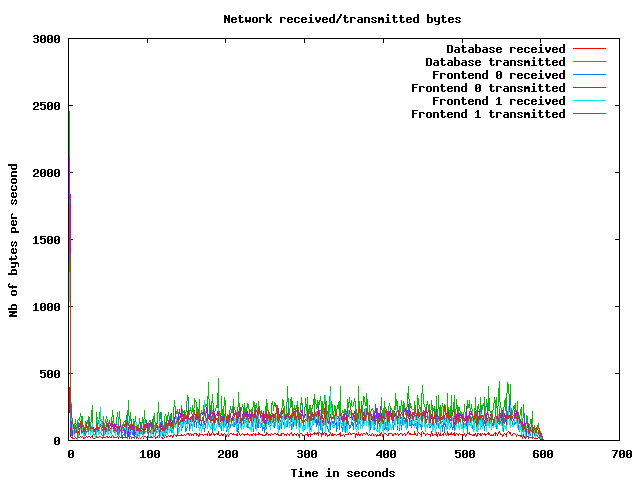
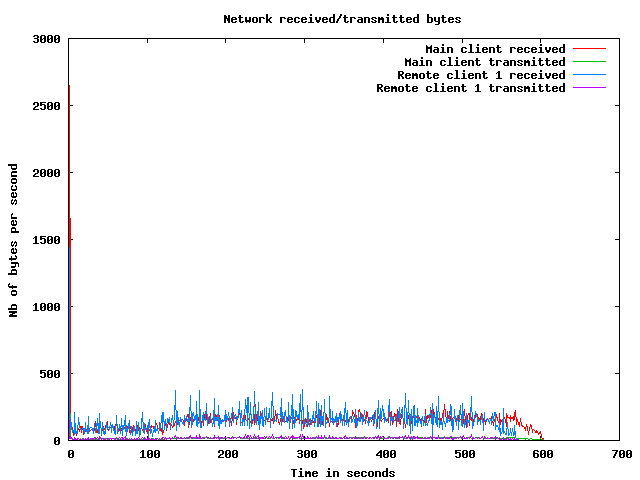
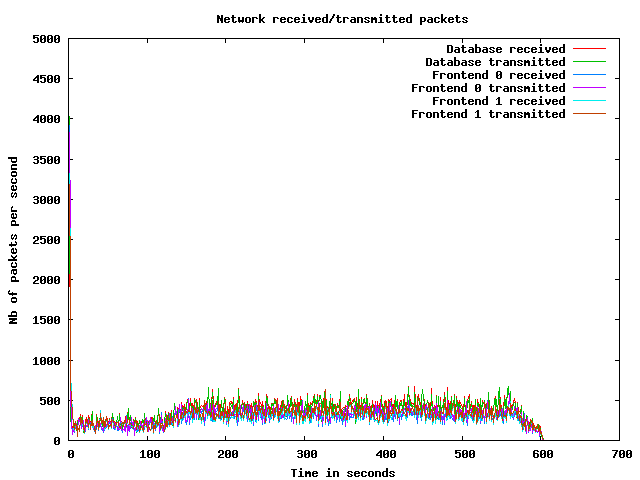
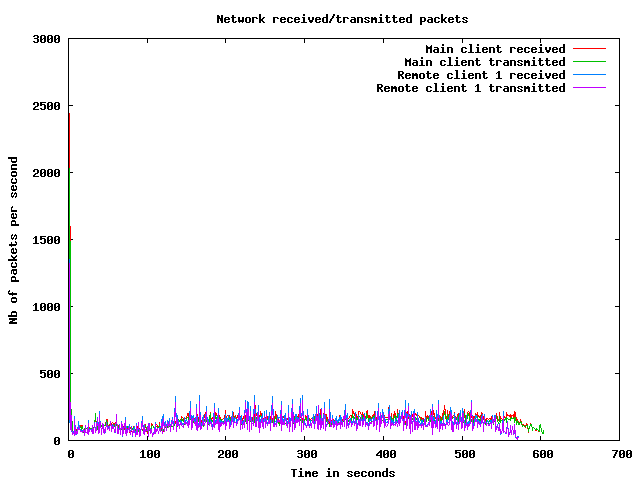
Network usage graphs
| Test start | 2009-3-19 18:50:48 |
| Up ramp start | 2009-3-19 18:50:51 |
| Runtime session start | 2009-3-19 18:52:51 |
| Down ramp start | 2009-3-19 19:0:21 |
| Test end | 2009-3-19 19:1:55 |
| Up ramp length | 2 minutes 0 millisecond (requested 120000 ms) |
| Runtime session length | 7 minutes 30 seconds 1 millisecond (requested 450000 ms) |
| Down ramp length | 30 seconds 0 millisecond (requested 30000 ms) |
| Total test length | 11 minutes 6 seconds 794 milliseconds |
| State name | % of total | Count | Errors | Minimum Time | Maximum Time | Average Time |
|---|---|---|---|---|---|---|
Home | 10 % | 384 | 0 | 0 ms | 3005 ms | 631 ms
|
Register | 1 % | 56 | 0 | 0 ms | 2997 ms | 54 ms
|
RegisterUser | 1 % | 51 | 0 | 5 ms | 1293 ms | 33 ms
|
Browse | 9 % | 365 | 0 | 0 ms | 2999 ms | 93 ms
|
BrowseCategories | 6 % | 242 | 0 | 3 ms | 1448 ms | 31 ms
|
SearchItemsInCategory | 14 % | 550 | 0 | 0 ms | 3007 ms | 53 ms
|
BrowseRegions | 2 % | 95 | 0 | 3 ms | 1208 ms | 18 ms
|
BrowseCategoriesInRegion | 2 % | 87 | 0 | 3 ms | 3003 ms | 73 ms
|
SearchItemsInRegion | 4 % | 175 | 0 | 0 ms | 1318 ms | 34 ms
|
ViewItem | 12 % | 488 | 0 | 4 ms | 3009 ms | 37 ms
|
ViewUserInfo | 2 % | 103 | 0 | 3 ms | 1240 ms | 16 ms
|
ViewBidHistory | 1 % | 51 | 0 | 4 ms | 3018 ms | 91 ms
|
BuyNowAuth | 1 % | 41 | 0 | 2 ms | 1275 ms | 33 ms
|
BuyNow | 0 % | 36 | 4 | 4 ms | 47 ms | 5 ms
|
StoreBuyBow | 0 % | 26 | 0 | 4 ms | 406 ms | 22 ms
|
PutBidAuth | 3 % | 141 | 0 | 0 ms | 1473 ms | 33 ms
|
PutBid | 3 % | 130 | 20 | 4 ms | 3005 ms | 40 ms
|
StoreBid | 1 % | 71 | 0 | 4 ms | 3013 ms | 126 ms
|
PutCommentAuth | 0 % | 0 | 0 | 0 ms | 0 ms | 0 ms
|
PutComment | 0 % | 7 | 1 | 4 ms | 12 ms | 6 ms
|
StoreComment | 0 % | 6 | 0 | 5 ms | 955 ms | 161 ms
|
Sell | 0 % | 30 | 0 | 0 ms | 934 ms | 32 ms
|
SelectCategoryToSellItem | 0 % | 29 | 0 | 4 ms | 25 ms | 5 ms
|
SellItemForm | 0 % | 24 | 0 | 2 ms | 1363 ms | 86 ms
|
RegisterItem | 0 % | 22 | 0 | 4 ms | 17 ms | 6 ms
|
AboutMe (auth form) | 2 % | 96 | 0 | 0 ms | 1285 ms | 37 ms
|
AboutMe | 3 % | 134 | 0 | 9 ms | 3013 ms | 128 ms
|
Back probability | 8 % | 323 | 0 | 0 ms | 0 ms | 0 ms
|
End of Session | 0 % | 35 | 0 | 0 ms | 0 ms | 0 ms
|
Total | 100 % | 3798 | 25 | - | - | 105 ms
|
Average throughput | 31 req/s
| |||||
Completed sessions | 31
| |||||
Total time | 1770 seconds
| |||||
Average session time | 57 seconds
| |||||
| State name | % of total | Count | Errors | Minimum Time | Maximum Time | Average Time |
|---|---|---|---|---|---|---|
Home | 4 % | 867 | 0 | 0 ms | 8 ms | 0 ms
|
Register | 0 % | 175 | 0 | 0 ms | 3 ms | 0 ms
|
RegisterUser | 0 % | 172 | 1 | 5 ms | 11 ms | 5 ms
|
Browse | 7 % | 1342 | 0 | 0 ms | 6 ms | 0 ms
|
BrowseCategories | 4 % | 898 | 0 | 3 ms | 15 ms | 4 ms
|
SearchItemsInCategory | 15 % | 2851 | 0 | 0 ms | 17 ms | 6 ms
|
BrowseRegions | 2 % | 430 | 0 | 3 ms | 16 ms | 4 ms
|
BrowseCategoriesInRegion | 2 % | 427 | 0 | 3 ms | 13 ms | 4 ms
|
SearchItemsInRegion | 5 % | 1037 | 0 | 0 ms | 66 ms | 7 ms
|
ViewItem | 14 % | 2587 | 0 | 4 ms | 67 ms | 6 ms
|
ViewUserInfo | 3 % | 560 | 0 | 3 ms | 15 ms | 5 ms
|
ViewBidHistory | 1 % | 281 | 0 | 4 ms | 22 ms | 10 ms
|
BuyNowAuth | 1 % | 222 | 0 | 2 ms | 7 ms | 2 ms
|
BuyNow | 1 % | 213 | 28 | 4 ms | 14 ms | 5 ms
|
StoreBuyBow | 0 % | 182 | 0 | 4 ms | 11 ms | 5 ms
|
PutBidAuth | 4 % | 902 | 0 | 0 ms | 9 ms | 2 ms
|
PutBid | 5 % | 1036 | 118 | 4 ms | 17 ms | 6 ms
|
StoreBid | 3 % | 681 | 0 | 4 ms | 14 ms | 5 ms
|
PutCommentAuth | 0 % | 0 | 0 | 0 ms | 0 ms | 0 ms
|
PutComment | 0 % | 80 | 6 | 4 ms | 9 ms | 4 ms
|
StoreComment | 0 % | 70 | 0 | 4 ms | 9 ms | 5 ms
|
Sell | 0 % | 119 | 0 | 0 ms | 5 ms | 0 ms
|
SelectCategoryToSellItem | 0 % | 112 | 0 | 4 ms | 9 ms | 5 ms
|
SellItemForm | 0 % | 113 | 0 | 2 ms | 6 ms | 2 ms
|
RegisterItem | 0 % | 113 | 0 | 4 ms | 10 ms | 5 ms
|
AboutMe (auth form) | 1 % | 300 | 0 | 0 ms | 10 ms | 0 ms
|
AboutMe | 2 % | 483 | 0 | 8 ms | 27 ms | 13 ms
|
Back probability | 10 % | 1843 | 0 | 0 ms | 0 ms | 0 ms
|
End of Session | 1 % | 244 | 0 | 0 ms | 0 ms | 0 ms
|
Total | 100 % | 18340 | 153 | - | - | 4 ms
|
Average throughput | 41 req/s
| |||||
Completed sessions | 245
| |||||
Total time | 58908 seconds
| |||||
Average session time | 240 seconds
| |||||
| State name | % of total | Count | Errors | Minimum Time | Maximum Time | Average Time |
|---|---|---|---|---|---|---|
Home | 5 % | 36 | 0 | 0 ms | 3 ms | 0 ms
|
Register | 0 % | 2 | 0 | 1 ms | 1 ms | 0 ms
|
RegisterUser | 0 % | 1 | 0 | 5 ms | 6 ms | 21 ms
|
Browse | 7 % | 49 | 0 | 0 ms | 2 ms | 0 ms
|
BrowseCategories | 6 % | 38 | 0 | 3 ms | 9 ms | 4 ms
|
SearchItemsInCategory | 19 % | 122 | 0 | 1 ms | 12 ms | 5 ms
|
BrowseRegions | 1 % | 10 | 0 | 4 ms | 4 ms | 4 ms
|
BrowseCategoriesInRegion | 1 % | 10 | 0 | 4 ms | 7 ms | 5 ms
|
SearchItemsInRegion | 4 % | 27 | 0 | 0 ms | 60 ms | 13 ms
|
ViewItem | 13 % | 85 | 0 | 4 ms | 85 ms | 6 ms
|
ViewUserInfo | 2 % | 18 | 0 | 4 ms | 7 ms | 4 ms
|
ViewBidHistory | 1 % | 9 | 0 | 5 ms | 15 ms | 10 ms
|
BuyNowAuth | 1 % | 7 | 0 | 2 ms | 3 ms | 3 ms
|
BuyNow | 1 % | 10 | 2 | 5 ms | 6 ms | 3 ms
|
StoreBuyBow | 0 % | 5 | 0 | 4 ms | 5 ms | 6 ms
|
PutBidAuth | 4 % | 31 | 0 | 1 ms | 9 ms | 2 ms
|
PutBid | 4 % | 30 | 6 | 4 ms | 13 ms | 7 ms
|
StoreBid | 3 % | 21 | 0 | 4 ms | 7 ms | 4 ms
|
PutCommentAuth | 0 % | 0 | 0 | 0 ms | 0 ms | 0 ms
|
PutComment | 0 % | 3 | 2 | 4 ms | 5 ms | 7 ms
|
StoreComment | 0 % | 3 | 0 | 5 ms | 11 ms | 13 ms
|
Sell | 0 % | 1 | 0 | 0 ms | 1 ms | 2 ms
|
SelectCategoryToSellItem | 0 % | 4 | 0 | 4 ms | 7 ms | 6 ms
|
SellItemForm | 0 % | 5 | 0 | 2 ms | 2 ms | 1 ms
|
RegisterItem | 0 % | 4 | 0 | 4 ms | 5 ms | 5 ms
|
AboutMe (auth form) | 1 % | 8 | 0 | 0 ms | 1 ms | 0 ms
|
AboutMe | 2 % | 16 | 0 | 11 ms | 21 ms | 13 ms
|
Back probability | 9 % | 58 | 0 | 0 ms | 0 ms | 0 ms
|
End of Session | 1 % | 10 | 0 | 0 ms | 0 ms | 0 ms
|
Total | 100 % | 623 | 10 | - | - | 4 ms
|
Average throughput | 21 req/s
| |||||
Completed sessions | 8
| |||||
Total time | 1870 seconds
| |||||
Average session time | 233 seconds
| |||||
| State name | % of total | Count | Errors | Minimum Time | Maximum Time | Average Time |
|---|---|---|---|---|---|---|
Home | 5 % | 1287 | 0 | 0 ms | 3005 ms | 188 ms
|
Register | 1 % | 233 | 0 | 0 ms | 2997 ms | 13 ms
|
RegisterUser | 0 % | 224 | 1 | 5 ms | 1293 ms | 12 ms
|
Browse | 7 % | 1756 | 0 | 0 ms | 2999 ms | 19 ms
|
BrowseCategories | 5 % | 1178 | 0 | 3 ms | 1448 ms | 9 ms
|
SearchItemsInCategory | 15 % | 3532 | 0 | 0 ms | 3007 ms | 13 ms
|
BrowseRegions | 2 % | 535 | 0 | 3 ms | 1208 ms | 6 ms
|
BrowseCategoriesInRegion | 2 % | 524 | 0 | 3 ms | 3003 ms | 15 ms
|
SearchItemsInRegion | 5 % | 1241 | 0 | 0 ms | 1318 ms | 11 ms
|
ViewItem | 13 % | 3169 | 0 | 4 ms | 3009 ms | 11 ms
|
ViewUserInfo | 2 % | 683 | 0 | 3 ms | 1240 ms | 6 ms
|
ViewBidHistory | 1 % | 341 | 0 | 4 ms | 3018 ms | 22 ms
|
BuyNowAuth | 1 % | 270 | 0 | 2 ms | 1275 ms | 7 ms
|
BuyNow | 1 % | 259 | 34 | 4 ms | 47 ms | 5 ms
|
StoreBuyBow | 0 % | 213 | 0 | 4 ms | 406 ms | 7 ms
|
PutBidAuth | 4 % | 1074 | 0 | 0 ms | 1473 ms | 6 ms
|
PutBid | 5 % | 1199 | 144 | 4 ms | 3005 ms | 10 ms
|
StoreBid | 3 % | 773 | 0 | 4 ms | 3013 ms | 16 ms
|
PutCommentAuth | 0 % | 0 | 0 | 0 ms | 0 ms | 0 ms
|
PutComment | 0 % | 90 | 9 | 4 ms | 12 ms | 5 ms
|
StoreComment | 0 % | 79 | 0 | 4 ms | 955 ms | 17 ms
|
Sell | 0 % | 150 | 0 | 0 ms | 934 ms | 6 ms
|
SelectCategoryToSellItem | 0 % | 145 | 0 | 4 ms | 25 ms | 5 ms
|
SellItemForm | 0 % | 142 | 0 | 2 ms | 1363 ms | 16 ms
|
RegisterItem | 0 % | 139 | 0 | 4 ms | 17 ms | 5 ms
|
AboutMe (auth form) | 1 % | 404 | 0 | 0 ms | 1285 ms | 9 ms
|
AboutMe | 2 % | 638 | 0 | 8 ms | 3013 ms | 37 ms
|
Back probability | 9 % | 2224 | 0 | 0 ms | 0 ms | 0 ms
|
End of Session | 1 % | 289 | 0 | 0 ms | 0 ms | 0 ms
|
Total | 100 % | 22791 | 188 | - | - | 21 ms
|
Average throughput | 38 req/s
| |||||
Completed sessions | 289
| |||||
Total time | 64570 seconds
| |||||
Average session time | 223 seconds
| |||||
An error occured while waiting for remote processes termination (Skipping waits)
Command is: /usr/bin/scp farm6.csail.mit.edu:/tmp/client1 /home/drkp/sandbox/txcache/src/RUBiS-1.4.3/bench/2009-3-19@18:50:48//client1.bin
Command is: /usr/bin/ssh -x localhost /bin/bash -c 'LANG=en_GB.UTF-8 /usr/bin/sar -n DEV -n SOCK -rubcw 1 605 -f /home/drkp/sandbox/txcache/src/RUBiS-1.4.3/bench/2009-3-19@18:50:48//client1.bin > /home/drkp/sandbox/txcache/src/RUBiS-1.4.3/bench/2009-3-19@18:50:48//client1'
Command is: /usr/bin/scp farm14:/tmp/db_server0 /home/drkp/sandbox/txcache/src/RUBiS-1.4.3/bench/2009-3-19@18:50:48//db_server0.bin
Command is: /usr/bin/ssh -x localhost /bin/bash -c 'LANG=en_GB.UTF-8 /usr/bin/sar -n DEV -n SOCK -rubcw 1 605 -f /home/drkp/sandbox/txcache/src/RUBiS-1.4.3/bench/2009-3-19@18:50:48//db_server0.bin > /home/drkp/sandbox/txcache/src/RUBiS-1.4.3/bench/2009-3-19@18:50:48//db_server0'
Command is: /usr/bin/scp farm12.csail.mit.edu:/tmp/web_server0 /home/drkp/sandbox/txcache/src/RUBiS-1.4.3/bench/2009-3-19@18:50:48//web_server0.bin
Command is: /usr/bin/ssh -x localhost /bin/bash -c 'LANG=en_GB.UTF-8 /usr/bin/sar -n DEV -n SOCK -rubcw 1 605 -f /home/drkp/sandbox/txcache/src/RUBiS-1.4.3/bench/2009-3-19@18:50:48//web_server0.bin > /home/drkp/sandbox/txcache/src/RUBiS-1.4.3/bench/2009-3-19@18:50:48//web_server0'
Command is: /usr/bin/scp farm13.csail.mit.edu:/tmp/web_server1 /home/drkp/sandbox/txcache/src/RUBiS-1.4.3/bench/2009-3-19@18:50:48//web_server1.bin
Command is: /usr/bin/ssh -x localhost /bin/bash -c 'LANG=en_GB.UTF-8 /usr/bin/sar -n DEV -n SOCK -rubcw 1 605 -f /home/drkp/sandbox/txcache/src/RUBiS-1.4.3/bench/2009-3-19@18:50:48//web_server1.bin > /home/drkp/sandbox/txcache/src/RUBiS-1.4.3/bench/2009-3-19@18:50:48//web_server1'
Command is: /usr/bin/scp localhost:/tmp/client0 /home/drkp/sandbox/txcache/src/RUBiS-1.4.3/bench/2009-3-19@18:50:48//client0.bin
Command is: /usr/bin/ssh -x localhost /bin/bash -c 'LANG=en_GB.UTF-8 /usr/bin/sar -n DEV -n SOCK -rubcw 1 605 -f /home/drkp/sandbox/txcache/src/RUBiS-1.4.3/bench/2009-3-19@18:50:48//client0.bin > /home/drkp/sandbox/txcache/src/RUBiS-1.4.3/bench/2009-3-19@18:50:48//client0'
Command is: /usr/bin/scp farm6.csail.mit.edu:/tmp/trace_client1.html /home/drkp/sandbox/txcache/src/RUBiS-1.4.3/bench/2009-3-19@18:50:48//
Command is: /usr/bin/scp farm6.csail.mit.edu:/tmp/stat_client1.html /home/drkp/sandbox/txcache/src/RUBiS-1.4.3/bench/2009-3-19@18:50:48//
|
|
|
|
|
|
 | 
|
 | 
|
 | 
|
 | 
|
 | 
|
 | 
|
 | 
|
 | 
|
 | 
|