Node information
Test timing information
Up ramp statistics
Runtime session statistics
Down ramp statistics
Overall statistics
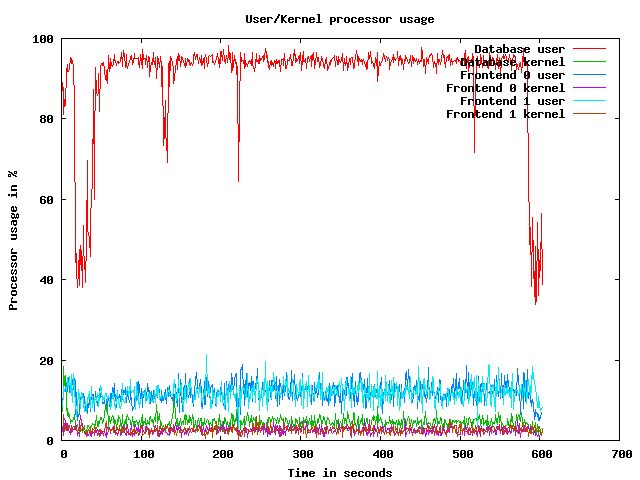
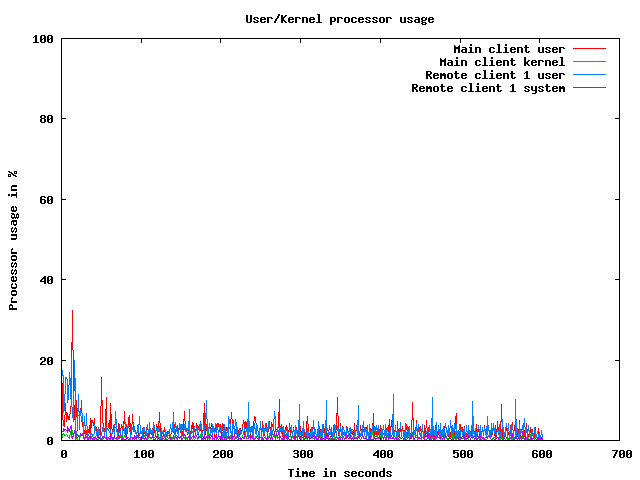
CPU usage graphs
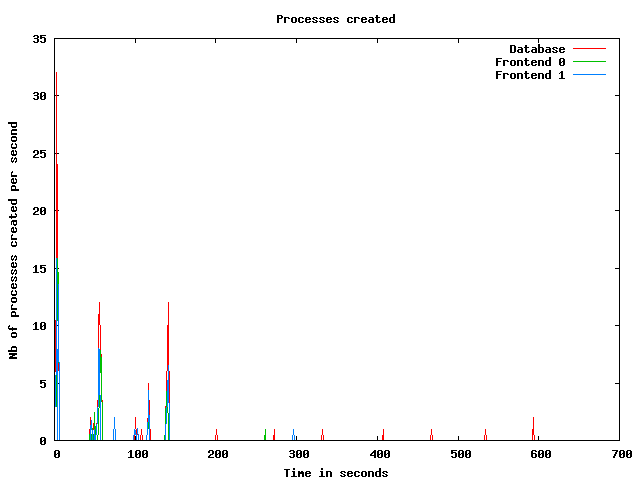
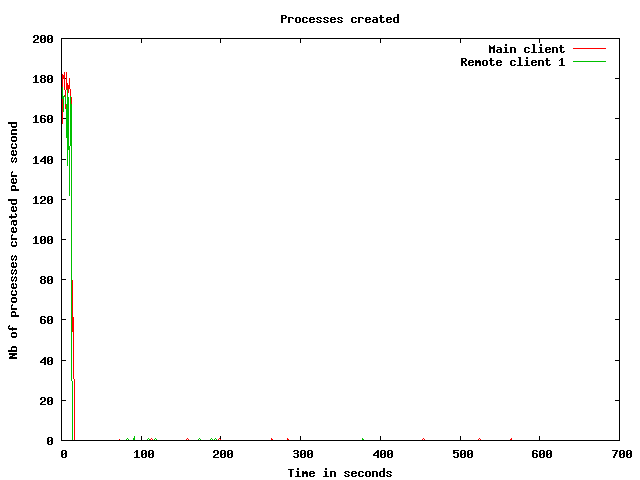
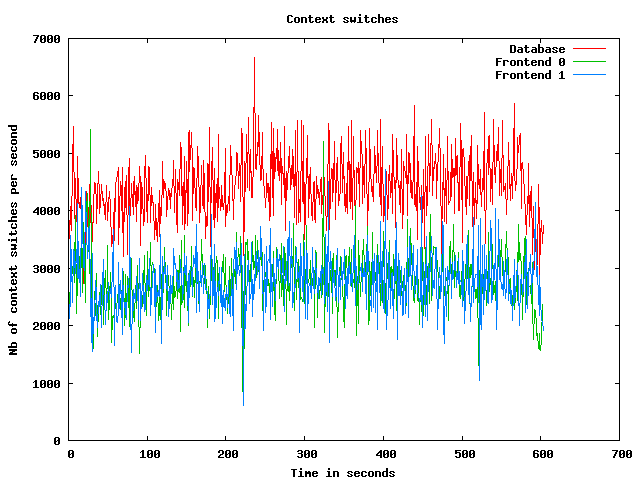
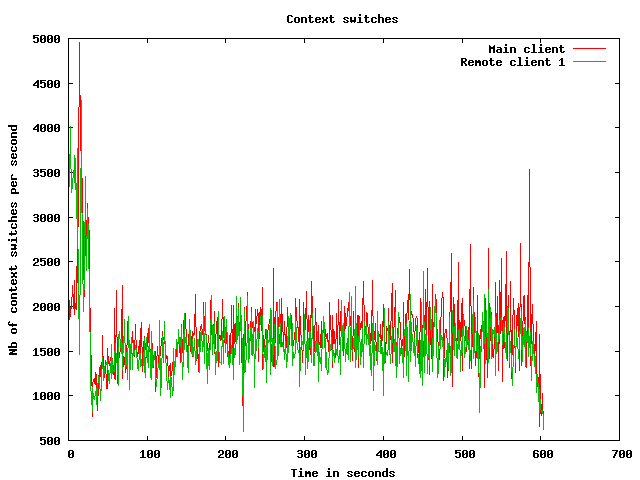
Processes usage graphs
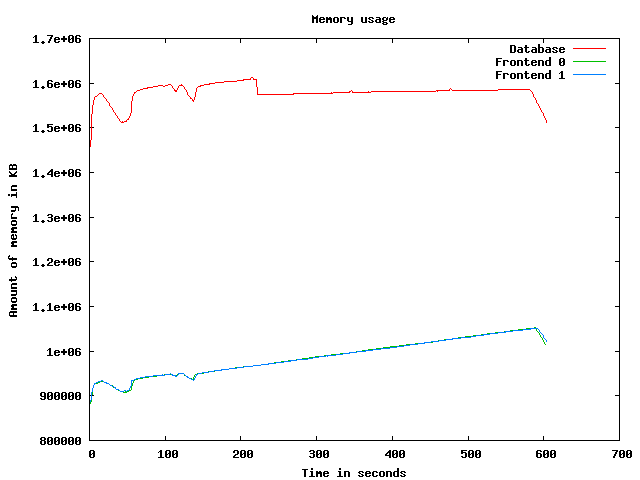
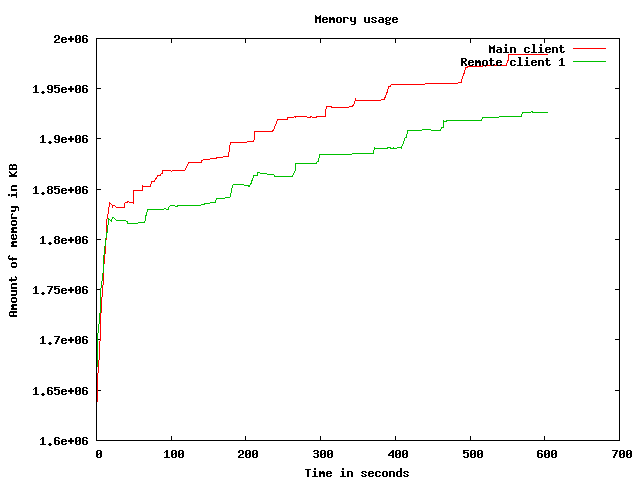
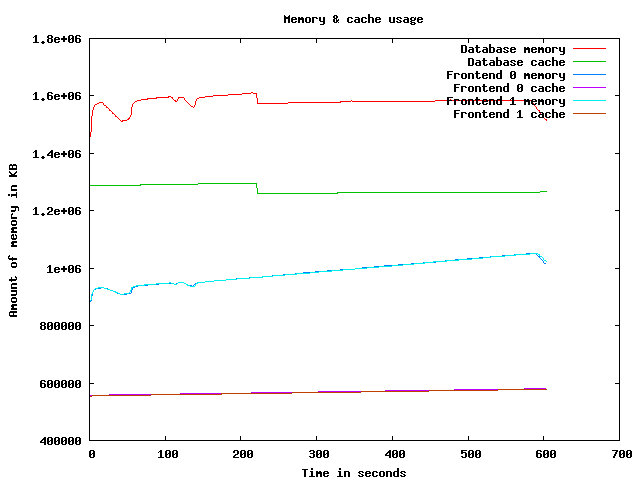
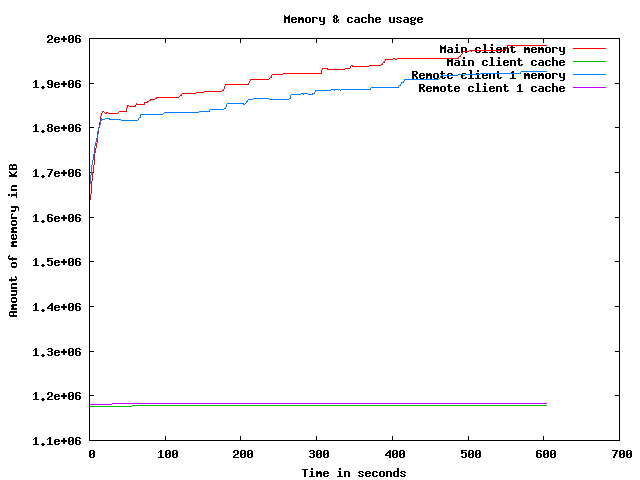
Memory usage graph
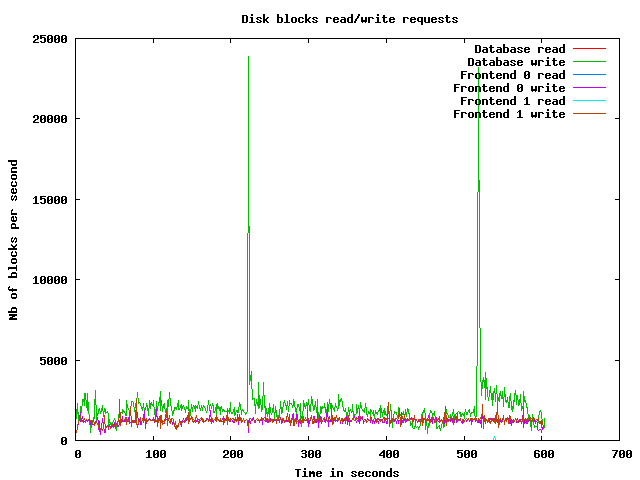
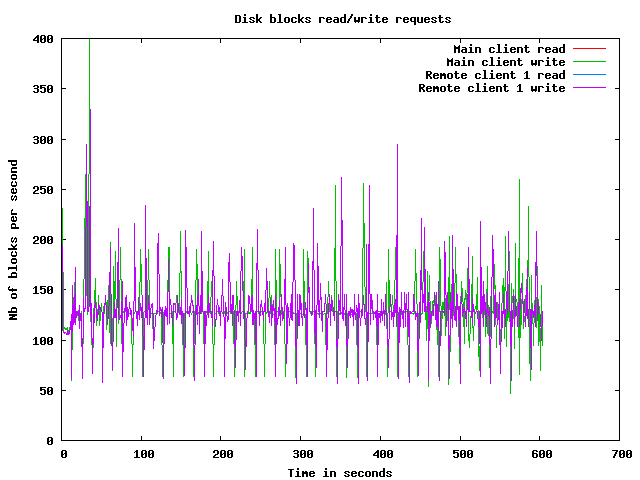
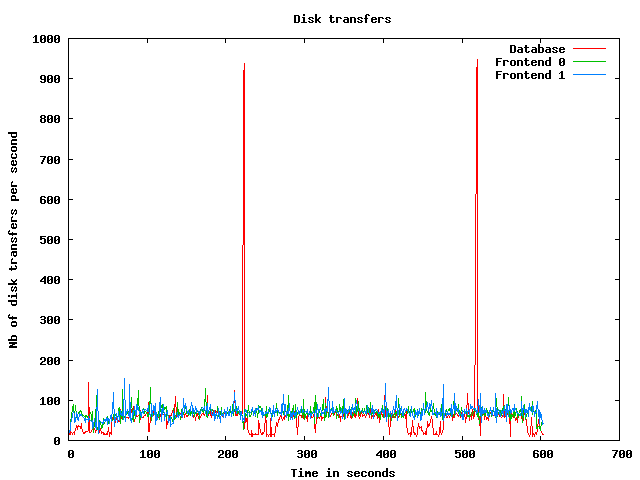
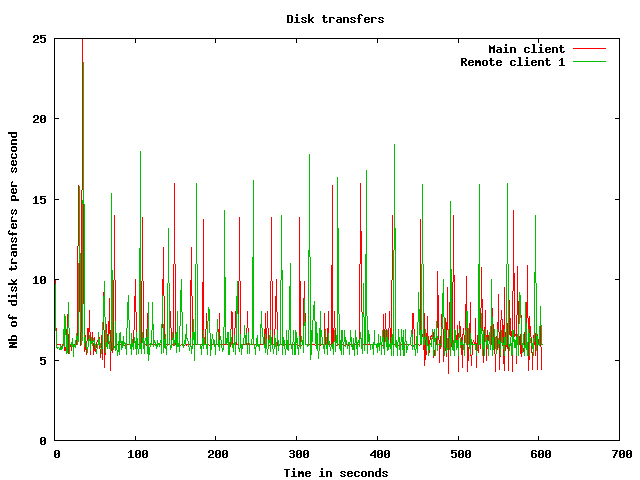
Disk usage graphs
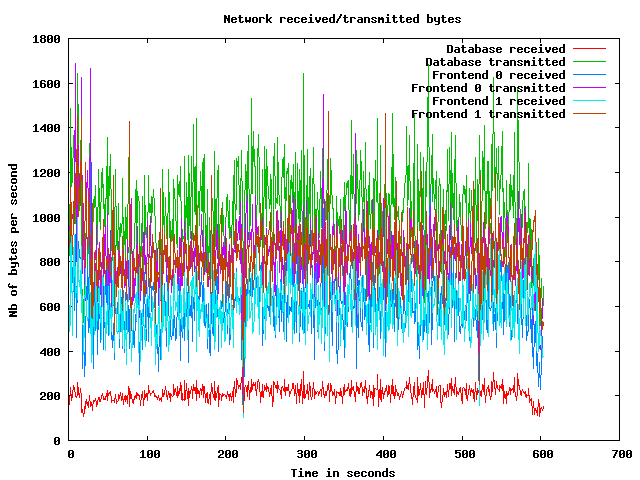
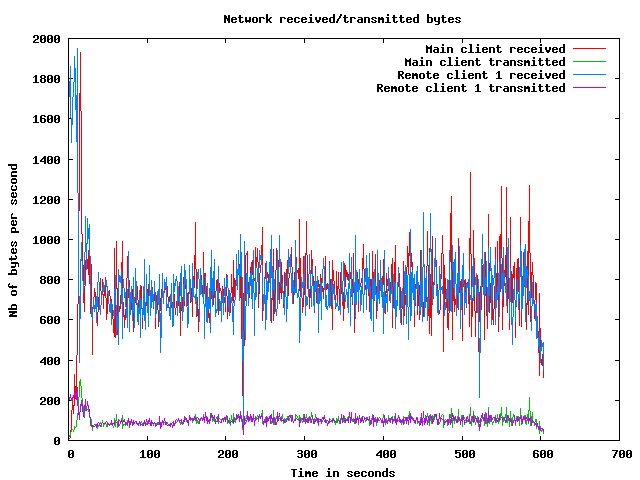
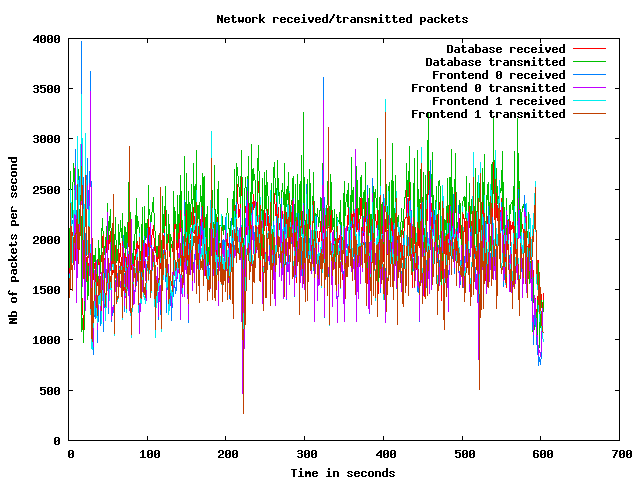
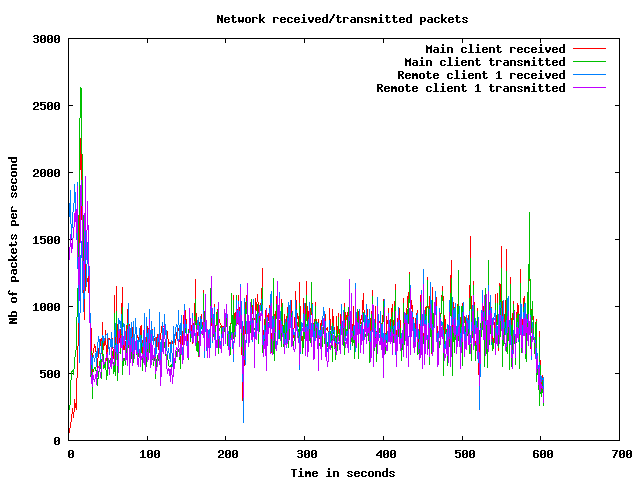
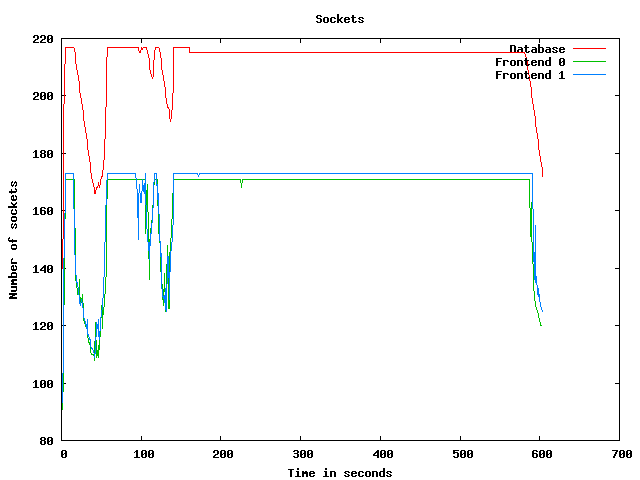
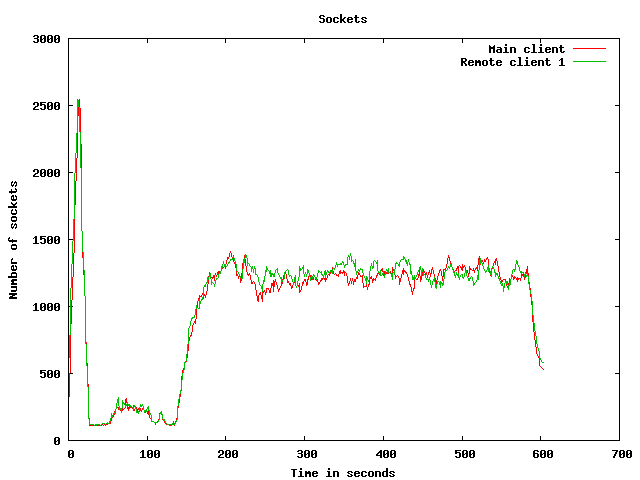
Network usage graphs
| Test start | 2009-3-19 20:43:9 |
| Up ramp start | 2009-3-19 20:43:26 |
| Runtime session start | 2009-3-19 20:45:26 |
| Down ramp start | 2009-3-19 20:52:56 |
| Test end | 2009-3-19 20:55:19 |
| Up ramp length | 2 minutes 0 millisecond (requested 120000 ms) |
| Runtime session length | 7 minutes 30 seconds 1 millisecond (requested 450000 ms) |
| Down ramp length | 30 seconds 0 millisecond (requested 30000 ms) |
| Total test length | 12 minutes 10 seconds 238 milliseconds |
| State name | % of total | Count | Errors | Minimum Time | Maximum Time | Average Time |
|---|---|---|---|---|---|---|
Home | 11 % | 3521 | 0 | 0 ms | 26666 ms | 8008 ms
|
Register | 1 % | 425 | 0 | 0 ms | 21000 ms | 511 ms
|
RegisterUser | 1 % | 387 | 9 | 5 ms | 21009 ms | 408 ms
|
Browse | 10 % | 3177 | 0 | 0 ms | 21004 ms | 591 ms
|
BrowseCategories | 7 % | 2086 | 0 | 3 ms | 21019 ms | 495 ms
|
SearchItemsInCategory | 14 % | 4363 | 0 | 0 ms | 21076 ms | 844 ms
|
BrowseRegions | 2 % | 852 | 0 | 3 ms | 9238 ms | 341 ms
|
BrowseCategoriesInRegion | 2 % | 781 | 0 | 3 ms | 12325 ms | 347 ms
|
SearchItemsInRegion | 4 % | 1367 | 0 | 0 ms | 21023 ms | 576 ms
|
ViewItem | 11 % | 3518 | 0 | 4 ms | 12332 ms | 339 ms
|
ViewUserInfo | 1 % | 570 | 0 | 4 ms | 20997 ms | 262 ms
|
ViewBidHistory | 0 % | 282 | 0 | 4 ms | 11574 ms | 391 ms
|
BuyNowAuth | 0 % | 291 | 0 | 2 ms | 4419 ms | 198 ms
|
BuyNow | 0 % | 251 | 43 | 5 ms | 6149 ms | 273 ms
|
StoreBuyBow | 0 % | 161 | 0 | 5 ms | 6192 ms | 353 ms
|
PutBidAuth | 3 % | 1155 | 0 | 0 ms | 9159 ms | 264 ms
|
PutBid | 3 % | 1022 | 172 | 1 ms | 9008 ms | 275 ms
|
StoreBid | 1 % | 531 | 0 | 5 ms | 6049 ms | 272 ms
|
PutCommentAuth | 0 % | 0 | 0 | 0 ms | 0 ms | 0 ms
|
PutComment | 0 % | 96 | 8 | 5 ms | 4969 ms | 311 ms
|
StoreComment | 0 % | 80 | 0 | 5 ms | 5615 ms | 309 ms
|
Sell | 0 % | 224 | 0 | 0 ms | 9005 ms | 297 ms
|
SelectCategoryToSellItem | 0 % | 204 | 0 | 4 ms | 21007 ms | 375 ms
|
SellItemForm | 0 % | 193 | 0 | 2 ms | 20998 ms | 418 ms
|
RegisterItem | 0 % | 174 | 0 | 4 ms | 9003 ms | 438 ms
|
AboutMe (auth form) | 2 % | 725 | 0 | 0 ms | 21004 ms | 561 ms
|
AboutMe | 3 % | 959 | 0 | 10 ms | 21214 ms | 618 ms
|
Back probability | 6 % | 1973 | 0 | 0 ms | 0 ms | 0 ms
|
End of Session | 0 % | 254 | 0 | 0 ms | 0 ms | 0 ms
|
Total | 100 % | 29622 | 232 | - | - | 1348 ms
|
Average throughput | 248 req/s
| |||||
Completed sessions | 215
| |||||
Total time | 16900 seconds
| |||||
Average session time | 78 seconds
| |||||
| State name | % of total | Count | Errors | Minimum Time | Maximum Time | Average Time |
|---|---|---|---|---|---|---|
Home | 4 % | 4900 | 0 | 0 ms | 217452 ms | 2003 ms
|
Register | 1 % | 1085 | 0 | 0 ms | 379997 ms | 4954 ms
|
RegisterUser | 1 % | 1074 | 28 | 5 ms | 380023 ms | 4863 ms
|
Browse | 7 % | 7494 | 0 | 0 ms | 379999 ms | 4617 ms
|
BrowseCategories | 5 % | 5205 | 0 | 3 ms | 403548 ms | 4466 ms
|
SearchItemsInCategory | 15 % | 16154 | 0 | 0 ms | 419614 ms | 5370 ms
|
BrowseRegions | 2 % | 2207 | 0 | 3 ms | 403570 ms | 4400 ms
|
BrowseCategoriesInRegion | 2 % | 2172 | 0 | 4 ms | 380059 ms | 3995 ms
|
SearchItemsInRegion | 4 % | 5142 | 0 | 0 ms | 379999 ms | 3911 ms
|
ViewItem | 14 % | 14823 | 0 | 5 ms | 395961 ms | 4415 ms
|
ViewUserInfo | 3 % | 3224 | 0 | 4 ms | 287915 ms | 4525 ms
|
ViewBidHistory | 1 % | 1693 | 0 | 5 ms | 216242 ms | 4004 ms
|
BuyNowAuth | 1 % | 1363 | 0 | 2 ms | 287817 ms | 5084 ms
|
BuyNow | 1 % | 1342 | 190 | 5 ms | 237959 ms | 4818 ms
|
StoreBuyBow | 1 % | 1146 | 0 | 5 ms | 239355 ms | 4426 ms
|
PutBidAuth | 4 % | 5014 | 0 | 0 ms | 380013 ms | 4317 ms
|
PutBid | 5 % | 5681 | 675 | 0 ms | 380022 ms | 4484 ms
|
StoreBid | 3 % | 3730 | 2 | 5 ms | 287001 ms | 4588 ms
|
PutCommentAuth | 0 % | 0 | 0 | 0 ms | 0 ms | 0 ms
|
PutComment | 0 % | 486 | 44 | 5 ms | 238878 ms | 7076 ms
|
StoreComment | 0 % | 425 | 0 | 5 ms | 193374 ms | 3055 ms
|
Sell | 0 % | 606 | 0 | 0 ms | 189995 ms | 3015 ms
|
SelectCategoryToSellItem | 0 % | 604 | 0 | 4 ms | 214745 ms | 4464 ms
|
SellItemForm | 0 % | 585 | 0 | 2 ms | 193003 ms | 4548 ms
|
RegisterItem | 0 % | 572 | 0 | 5 ms | 202555 ms | 4041 ms
|
AboutMe (auth form) | 1 % | 1717 | 0 | 0 ms | 392248 ms | 4654 ms
|
AboutMe | 2 % | 2976 | 0 | 10 ms | 216459 ms | 5253 ms
|
Back probability | 10 % | 10559 | 0 | 0 ms | 0 ms | 0 ms
|
End of Session | 1 % | 1476 | 0 | 0 ms | 0 ms | 0 ms
|
Total | 100 % | 103455 | 939 | - | - | 3936 ms
|
Average throughput | 231 req/s
| |||||
Completed sessions | 1492
| |||||
Total time | 420239 seconds
| |||||
Average session time | 281 seconds
| |||||
| State name | % of total | Count | Errors | Minimum Time | Maximum Time | Average Time |
|---|---|---|---|---|---|---|
Home | 4 % | 242 | 0 | 0 ms | 189996 ms | 4408 ms
|
Register | 1 % | 55 | 0 | 0 ms | 190002 ms | 7799 ms
|
RegisterUser | 1 % | 50 | 1 | 5 ms | 93027 ms | 7408 ms
|
Browse | 7 % | 375 | 0 | 0 ms | 283002 ms | 12329 ms
|
BrowseCategories | 5 % | 250 | 0 | 3 ms | 190027 ms | 11184 ms
|
SearchItemsInCategory | 15 % | 766 | 0 | 0 ms | 386899 ms | 12495 ms
|
BrowseRegions | 2 % | 121 | 0 | 4 ms | 189999 ms | 4389 ms
|
BrowseCategoriesInRegion | 2 % | 111 | 0 | 3 ms | 190028 ms | 8079 ms
|
SearchItemsInRegion | 4 % | 238 | 0 | 0 ms | 190040 ms | 7991 ms
|
ViewItem | 14 % | 702 | 0 | 4 ms | 389823 ms | 12719 ms
|
ViewUserInfo | 3 % | 162 | 0 | 4 ms | 190016 ms | 12433 ms
|
ViewBidHistory | 1 % | 75 | 0 | 4 ms | 190047 ms | 14525 ms
|
BuyNowAuth | 1 % | 73 | 0 | 2 ms | 189999 ms | 8659 ms
|
BuyNow | 1 % | 64 | 12 | 4 ms | 380017 ms | 10643 ms
|
StoreBuyBow | 1 % | 50 | 0 | 4 ms | 380005 ms | 19056 ms
|
PutBidAuth | 5 % | 257 | 0 | 0 ms | 190005 ms | 7968 ms
|
PutBid | 5 % | 255 | 41 | 4 ms | 190049 ms | 9942 ms
|
StoreBid | 3 % | 164 | 0 | 5 ms | 195640 ms | 12224 ms
|
PutCommentAuth | 0 % | 0 | 0 | 0 ms | 0 ms | 0 ms
|
PutComment | 0 % | 29 | 3 | 4 ms | 92998 ms | 5837 ms
|
StoreComment | 0 % | 29 | 0 | 5 ms | 190023 ms | 20979 ms
|
Sell | 0 % | 28 | 0 | 0 ms | 44994 ms | 2122 ms
|
SelectCategoryToSellItem | 0 % | 22 | 0 | 4 ms | 190001 ms | 13319 ms
|
SellItemForm | 0 % | 33 | 0 | 2 ms | 95251 ms | 10741 ms
|
RegisterItem | 0 % | 32 | 0 | 4 ms | 201477 ms | 14376 ms
|
AboutMe (auth form) | 1 % | 86 | 0 | 0 ms | 193001 ms | 9975 ms
|
AboutMe | 2 % | 144 | 0 | 8 ms | 190394 ms | 9791 ms
|
Back probability | 10 % | 502 | 0 | 0 ms | 0 ms | 0 ms
|
End of Session | 1 % | 81 | 0 | 0 ms | 0 ms | 0 ms
|
Total | 100 % | 4996 | 57 | - | - | 9358 ms
|
Average throughput | 168 req/s
| |||||
Completed sessions | 62
| |||||
Total time | 25187 seconds
| |||||
Average session time | 406 seconds
| |||||
| State name | % of total | Count | Errors | Minimum Time | Maximum Time | Average Time |
|---|---|---|---|---|---|---|
Home | 6 % | 8667 | 0 | 0 ms | 282995 ms | 4673 ms
|
Register | 1 % | 1568 | 0 | 0 ms | 379997 ms | 4083 ms
|
RegisterUser | 1 % | 1512 | 38 | 5 ms | 380023 ms | 4472 ms
|
Browse | 7 % | 11073 | 0 | 0 ms | 473010 ms | 4019 ms
|
BrowseCategories | 5 % | 7557 | 0 | 3 ms | 403548 ms | 4009 ms
|
SearchItemsInCategory | 15 % | 21464 | 0 | 0 ms | 473010 ms | 5060 ms
|
BrowseRegions | 2 % | 3184 | 0 | 3 ms | 403570 ms | 3636 ms
|
BrowseCategoriesInRegion | 2 % | 3070 | 0 | 3 ms | 380059 ms | 3485 ms
|
SearchItemsInRegion | 4 % | 6787 | 0 | 0 ms | 380022 ms | 3971 ms
|
ViewItem | 13 % | 19147 | 0 | 4 ms | 473027 ms | 4363 ms
|
ViewUserInfo | 2 % | 3979 | 0 | 4 ms | 287915 ms | 4710 ms
|
ViewBidHistory | 1 % | 2063 | 0 | 4 ms | 283039 ms | 4142 ms
|
BuyNowAuth | 1 % | 1728 | 0 | 2 ms | 287817 ms | 4573 ms
|
BuyNow | 1 % | 1659 | 246 | 4 ms | 380017 ms | 5148 ms
|
StoreBuyBow | 0 % | 1364 | 0 | 4 ms | 380005 ms | 5223 ms
|
PutBidAuth | 4 % | 6439 | 0 | 0 ms | 380013 ms | 4154 ms
|
PutBid | 5 % | 7001 | 891 | 0 ms | 380030 ms | 4541 ms
|
StoreBid | 3 % | 4437 | 2 | 5 ms | 287001 ms | 4918 ms
|
PutCommentAuth | 0 % | 0 | 0 | 0 ms | 0 ms | 0 ms
|
PutComment | 0 % | 614 | 55 | 4 ms | 238878 ms | 6544 ms
|
StoreComment | 0 % | 536 | 0 | 5 ms | 193374 ms | 3604 ms
|
Sell | 0 % | 859 | 0 | 0 ms | 189996 ms | 2495 ms
|
SelectCategoryToSellItem | 0 % | 831 | 0 | 4 ms | 214745 ms | 3689 ms
|
SellItemForm | 0 % | 811 | 0 | 2 ms | 193003 ms | 4166 ms
|
RegisterItem | 0 % | 780 | 0 | 4 ms | 202555 ms | 3651 ms
|
AboutMe (auth form) | 1 % | 2533 | 0 | 0 ms | 392248 ms | 3954 ms
|
AboutMe | 2 % | 4120 | 0 | 8 ms | 216459 ms | 4787 ms
|
Back probability | 9 % | 13070 | 0 | 0 ms | 0 ms | 0 ms
|
End of Session | 1 % | 1816 | 0 | 0 ms | 0 ms | 0 ms
|
Total | 100 % | 138669 | 1232 | - | - | 3918 ms
|
Average throughput | 233 req/s
| |||||
Completed sessions | 1816
| |||||
Total time | 486555 seconds
| |||||
Average session time | 267 seconds
| |||||
An error occured while waiting for remote processes termination (Skipping waits)
Command is: /usr/bin/scp farm6.csail.mit.edu:/tmp/client1 /home/drkp/sandbox/txcache/src/RUBiS-1.4.3/bench/2009-3-19@20:43:9//client1.bin
Command is: /usr/bin/ssh -x localhost /bin/bash -c 'LANG=en_GB.UTF-8 /usr/bin/sar -n DEV -n SOCK -rubcw 1 605 -f /home/drkp/sandbox/txcache/src/RUBiS-1.4.3/bench/2009-3-19@20:43:9//client1.bin > /home/drkp/sandbox/txcache/src/RUBiS-1.4.3/bench/2009-3-19@20:43:9//client1'
Command is: /usr/bin/scp farm14:/tmp/db_server0 /home/drkp/sandbox/txcache/src/RUBiS-1.4.3/bench/2009-3-19@20:43:9//db_server0.bin
Command is: /usr/bin/ssh -x localhost /bin/bash -c 'LANG=en_GB.UTF-8 /usr/bin/sar -n DEV -n SOCK -rubcw 1 605 -f /home/drkp/sandbox/txcache/src/RUBiS-1.4.3/bench/2009-3-19@20:43:9//db_server0.bin > /home/drkp/sandbox/txcache/src/RUBiS-1.4.3/bench/2009-3-19@20:43:9//db_server0'
Command is: /usr/bin/scp farm12.csail.mit.edu:/tmp/web_server0 /home/drkp/sandbox/txcache/src/RUBiS-1.4.3/bench/2009-3-19@20:43:9//web_server0.bin
Command is: /usr/bin/ssh -x localhost /bin/bash -c 'LANG=en_GB.UTF-8 /usr/bin/sar -n DEV -n SOCK -rubcw 1 605 -f /home/drkp/sandbox/txcache/src/RUBiS-1.4.3/bench/2009-3-19@20:43:9//web_server0.bin > /home/drkp/sandbox/txcache/src/RUBiS-1.4.3/bench/2009-3-19@20:43:9//web_server0'
Command is: /usr/bin/scp farm13.csail.mit.edu:/tmp/web_server1 /home/drkp/sandbox/txcache/src/RUBiS-1.4.3/bench/2009-3-19@20:43:9//web_server1.bin
Command is: /usr/bin/ssh -x localhost /bin/bash -c 'LANG=en_GB.UTF-8 /usr/bin/sar -n DEV -n SOCK -rubcw 1 605 -f /home/drkp/sandbox/txcache/src/RUBiS-1.4.3/bench/2009-3-19@20:43:9//web_server1.bin > /home/drkp/sandbox/txcache/src/RUBiS-1.4.3/bench/2009-3-19@20:43:9//web_server1'
Command is: /usr/bin/scp localhost:/tmp/client0 /home/drkp/sandbox/txcache/src/RUBiS-1.4.3/bench/2009-3-19@20:43:9//client0.bin
Command is: /usr/bin/ssh -x localhost /bin/bash -c 'LANG=en_GB.UTF-8 /usr/bin/sar -n DEV -n SOCK -rubcw 1 605 -f /home/drkp/sandbox/txcache/src/RUBiS-1.4.3/bench/2009-3-19@20:43:9//client0.bin > /home/drkp/sandbox/txcache/src/RUBiS-1.4.3/bench/2009-3-19@20:43:9//client0'
Command is: /usr/bin/scp farm6.csail.mit.edu:/tmp/trace_client1.html /home/drkp/sandbox/txcache/src/RUBiS-1.4.3/bench/2009-3-19@20:43:9//
Command is: /usr/bin/scp farm6.csail.mit.edu:/tmp/stat_client1.html /home/drkp/sandbox/txcache/src/RUBiS-1.4.3/bench/2009-3-19@20:43:9//
|
|
|
|
|
|
 | 
|
 | 
|
 | 
|
 | 
|
 | 
|
 | 
|
 | 
|
 | 
|
 | 
|