Node information
Test timing information
Up ramp statistics
Runtime session statistics
Down ramp statistics
Overall statistics
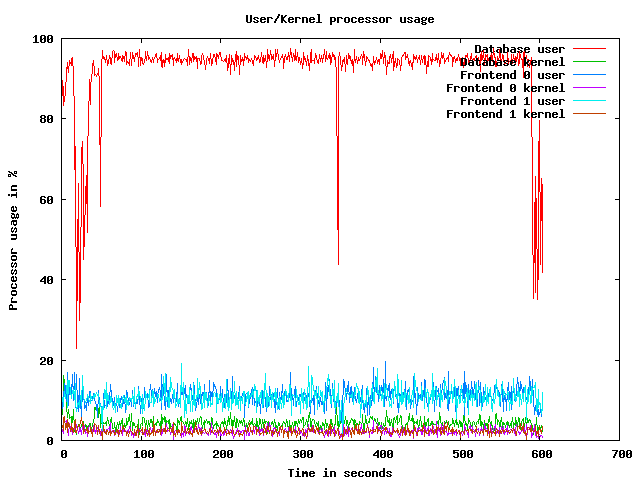
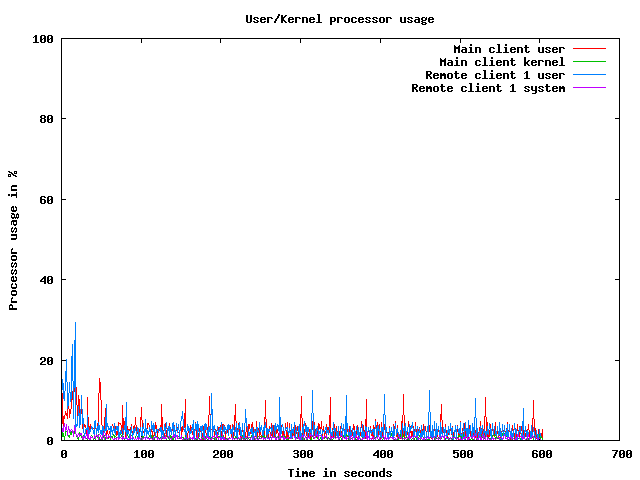
CPU usage graphs
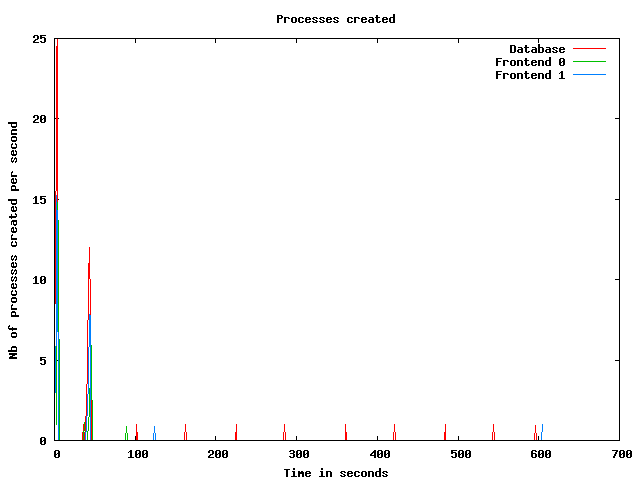
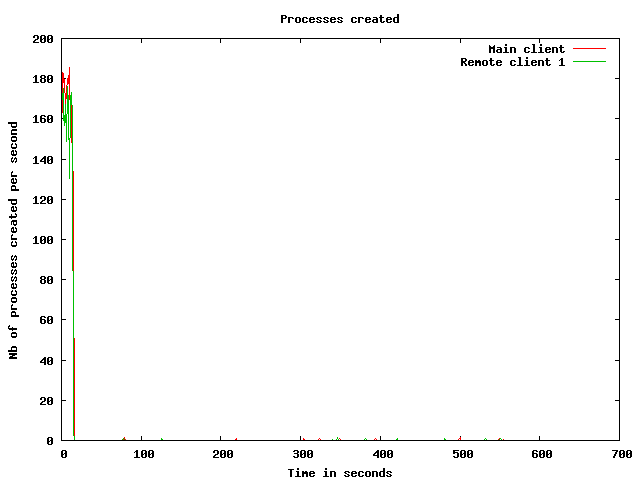
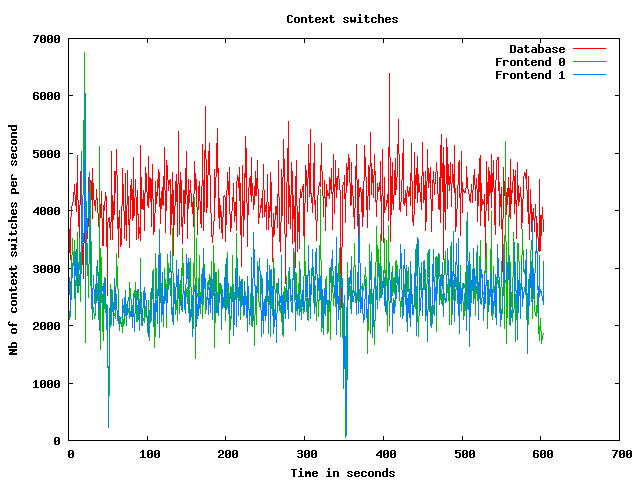
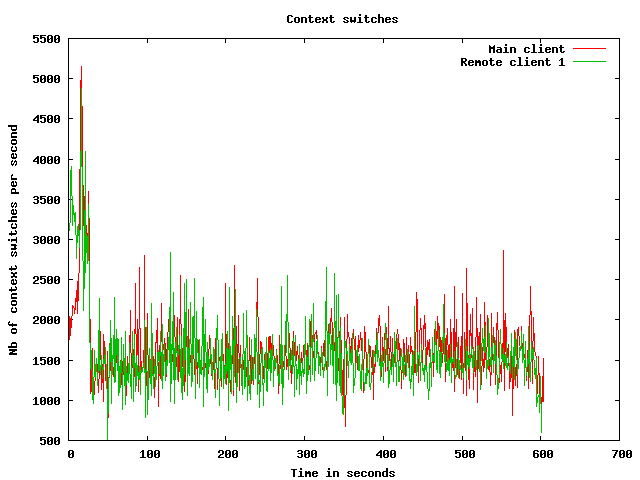
Processes usage graphs
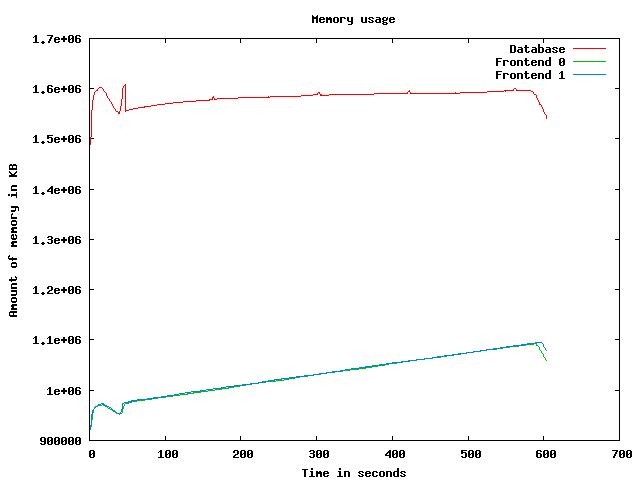
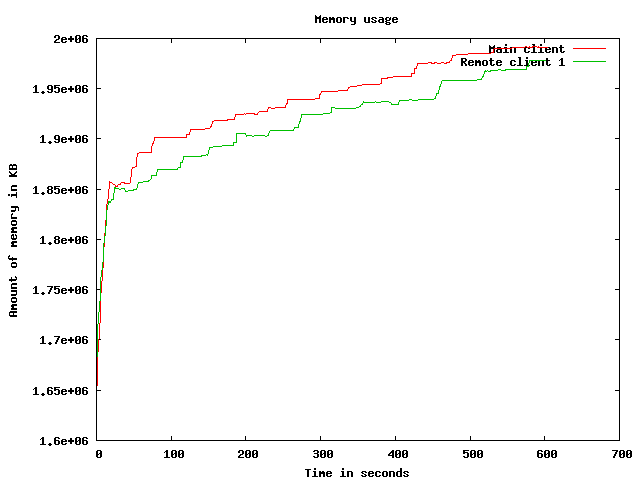
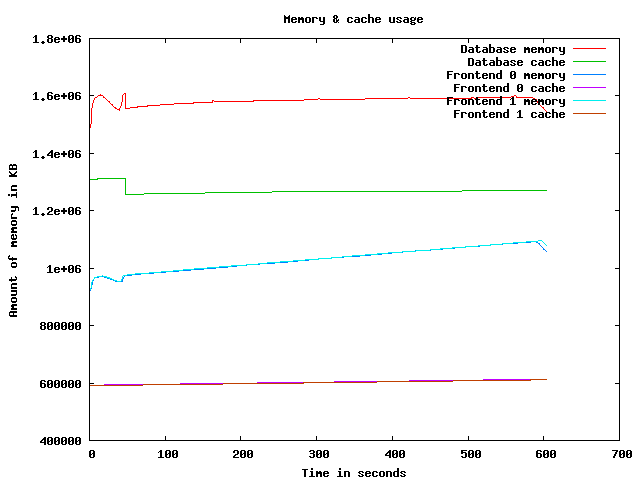
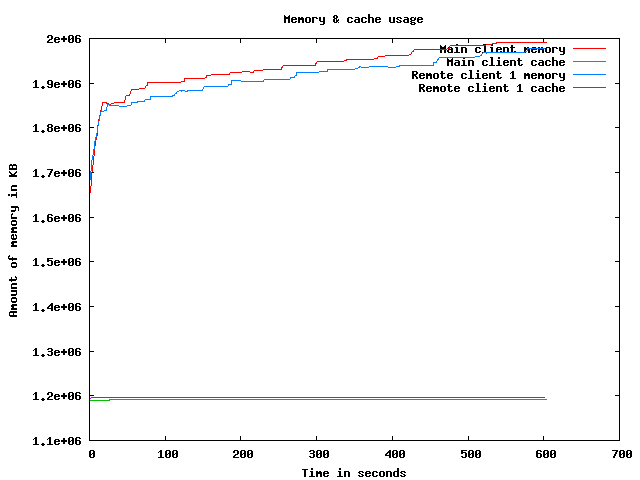
Memory usage graph
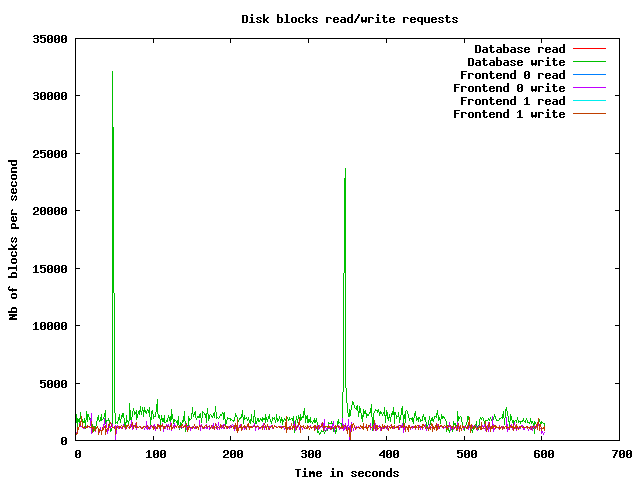
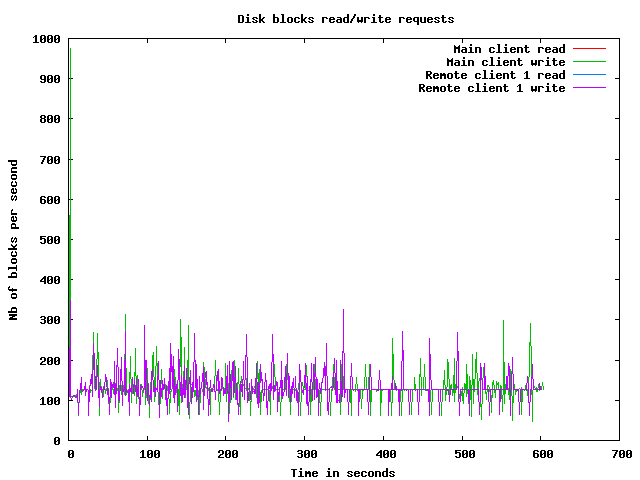
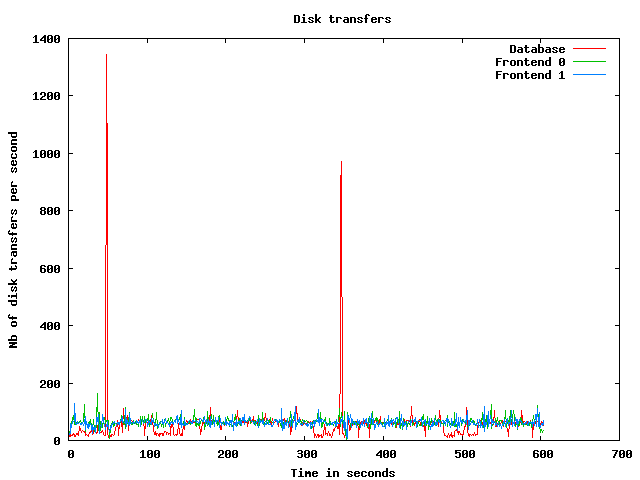
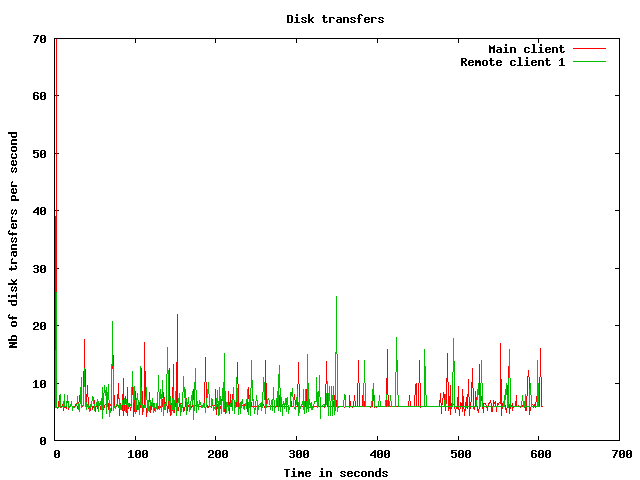
Disk usage graphs
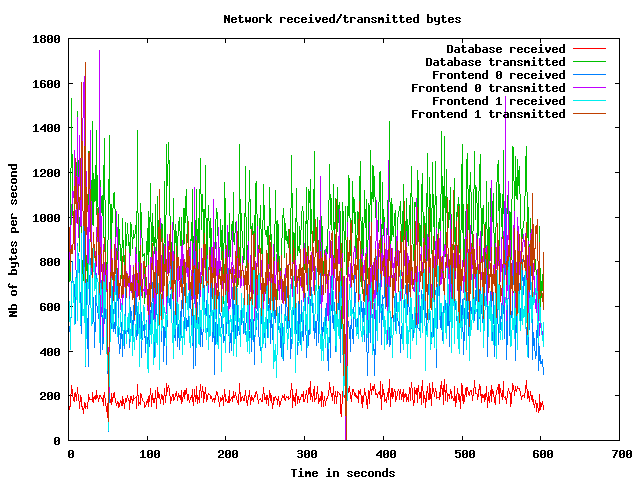
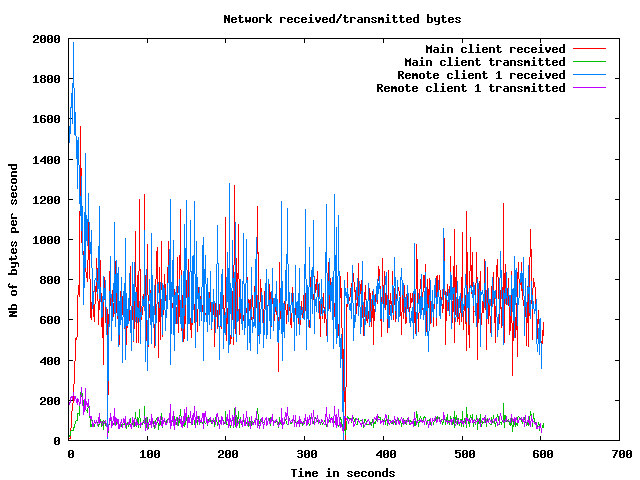
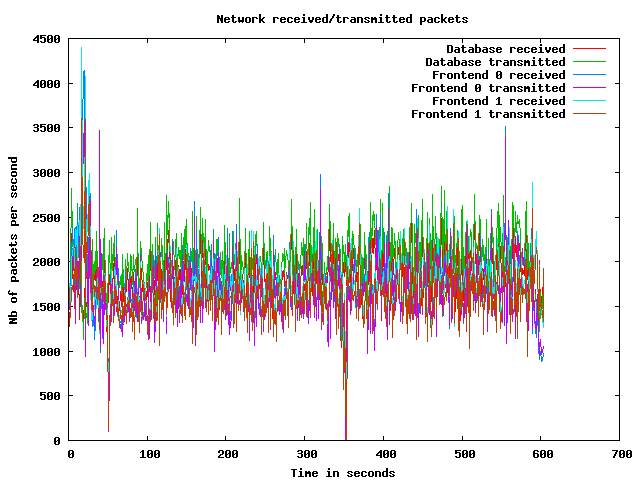
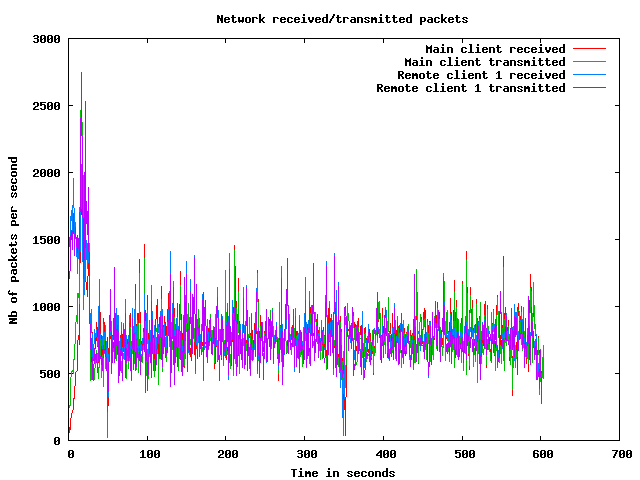
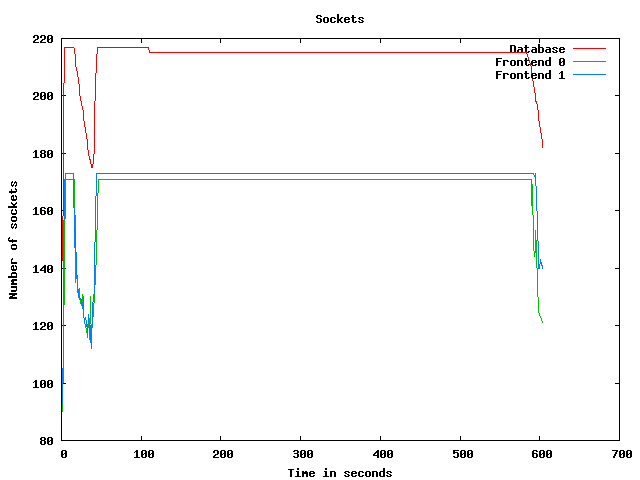
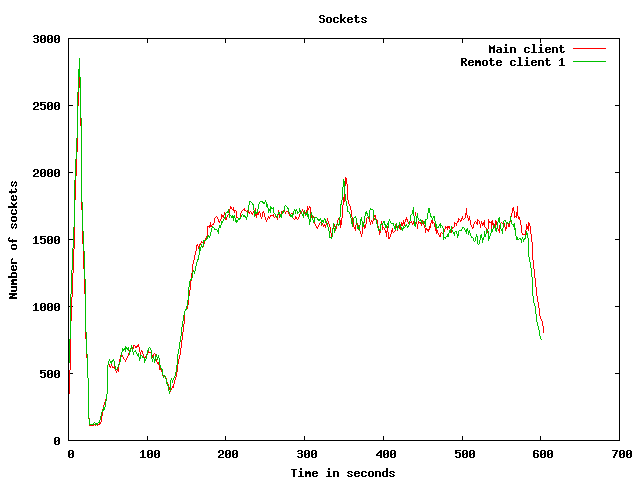
Network usage graphs
| Test start | 2009-3-19 20:56:3 |
| Up ramp start | 2009-3-19 20:56:20 |
| Runtime session start | 2009-3-19 20:58:20 |
| Down ramp start | 2009-3-19 21:5:50 |
| Test end | 2009-3-19 21:8:31 |
| Up ramp length | 2 minutes 1 millisecond (requested 120000 ms) |
| Runtime session length | 7 minutes 30 seconds 0 millisecond (requested 450000 ms) |
| Down ramp length | 30 seconds 0 millisecond (requested 30000 ms) |
| Total test length | 12 minutes 27 seconds 763 milliseconds |
| State name | % of total | Count | Errors | Minimum Time | Maximum Time | Average Time |
|---|---|---|---|---|---|---|
Home | 13 % | 3759 | 0 | 0 ms | 49782 ms | 7735 ms
|
Register | 1 % | 416 | 0 | 0 ms | 49601 ms | 1678 ms
|
RegisterUser | 1 % | 367 | 6 | 6 ms | 27456 ms | 1249 ms
|
Browse | 11 % | 3249 | 0 | 0 ms | 53199 ms | 1435 ms
|
BrowseCategories | 7 % | 2098 | 0 | 3 ms | 55788 ms | 1522 ms
|
SearchItemsInCategory | 14 % | 4068 | 0 | 0 ms | 53971 ms | 2272 ms
|
BrowseRegions | 3 % | 896 | 0 | 4 ms | 51021 ms | 1292 ms
|
BrowseCategoriesInRegion | 2 % | 821 | 0 | 4 ms | 52264 ms | 1337 ms
|
SearchItemsInRegion | 4 % | 1372 | 0 | 0 ms | 50182 ms | 1777 ms
|
ViewItem | 11 % | 3299 | 0 | 4 ms | 52791 ms | 1296 ms
|
ViewUserInfo | 1 % | 528 | 0 | 4 ms | 51870 ms | 1591 ms
|
ViewBidHistory | 0 % | 250 | 0 | 4 ms | 50625 ms | 1345 ms
|
BuyNowAuth | 0 % | 248 | 0 | 2 ms | 49780 ms | 1191 ms
|
BuyNow | 0 % | 211 | 42 | 4 ms | 27588 ms | 993 ms
|
StoreBuyBow | 0 % | 127 | 0 | 6 ms | 13864 ms | 464 ms
|
PutBidAuth | 3 % | 1120 | 0 | 0 ms | 51595 ms | 1115 ms
|
PutBid | 3 % | 985 | 159 | 4 ms | 49273 ms | 1050 ms
|
StoreBid | 1 % | 500 | 0 | 5 ms | 49473 ms | 1646 ms
|
PutCommentAuth | 0 % | 0 | 0 | 0 ms | 0 ms | 0 ms
|
PutComment | 0 % | 69 | 10 | 5 ms | 55801 ms | 1624 ms
|
StoreComment | 0 % | 42 | 0 | 7 ms | 24367 ms | 1292 ms
|
Sell | 0 % | 228 | 0 | 0 ms | 22371 ms | 1220 ms
|
SelectCategoryToSellItem | 0 % | 210 | 0 | 5 ms | 52362 ms | 1415 ms
|
SellItemForm | 0 % | 197 | 0 | 2 ms | 48057 ms | 1291 ms
|
RegisterItem | 0 % | 177 | 0 | 4 ms | 49911 ms | 1375 ms
|
AboutMe (auth form) | 2 % | 709 | 0 | 0 ms | 50856 ms | 1717 ms
|
AboutMe | 3 % | 916 | 0 | 11 ms | 49750 ms | 1285 ms
|
Back probability | 6 % | 1794 | 0 | 0 ms | 0 ms | 0 ms
|
End of Session | 0 % | 256 | 0 | 0 ms | 0 ms | 0 ms
|
Total | 100 % | 28912 | 217 | - | - | 2224 ms
|
Average throughput | 242 req/s
| |||||
Completed sessions | 221
| |||||
Total time | 17391 seconds
| |||||
Average session time | 78 seconds
| |||||
| State name | % of total | Count | Errors | Minimum Time | Maximum Time | Average Time |
|---|---|---|---|---|---|---|
Home | 4 % | 4245 | 0 | 0 ms | 379992 ms | 3221 ms
|
Register | 1 % | 997 | 0 | 0 ms | 382640 ms | 5558 ms
|
RegisterUser | 1 % | 986 | 24 | 5 ms | 286640 ms | 7200 ms
|
Browse | 7 % | 6605 | 0 | 0 ms | 384616 ms | 6540 ms
|
BrowseCategories | 5 % | 4625 | 0 | 3 ms | 380307 ms | 6690 ms
|
SearchItemsInCategory | 15 % | 14579 | 0 | 0 ms | 381465 ms | 8397 ms
|
BrowseRegions | 2 % | 1900 | 0 | 4 ms | 241729 ms | 6112 ms
|
BrowseCategoriesInRegion | 2 % | 1853 | 0 | 3 ms | 286514 ms | 6555 ms
|
SearchItemsInRegion | 4 % | 4568 | 0 | 0 ms | 380070 ms | 8157 ms
|
ViewItem | 14 % | 13038 | 0 | 5 ms | 397951 ms | 7337 ms
|
ViewUserInfo | 3 % | 2840 | 0 | 4 ms | 384650 ms | 6144 ms
|
ViewBidHistory | 1 % | 1531 | 0 | 4 ms | 206328 ms | 6536 ms
|
BuyNowAuth | 1 % | 1156 | 0 | 2 ms | 288145 ms | 6095 ms
|
BuyNow | 1 % | 1134 | 154 | 4 ms | 380040 ms | 6278 ms
|
StoreBuyBow | 1 % | 975 | 0 | 5 ms | 393920 ms | 6616 ms
|
PutBidAuth | 4 % | 4447 | 0 | 0 ms | 384643 ms | 6735 ms
|
PutBid | 5 % | 5059 | 588 | 0 ms | 380148 ms | 7030 ms
|
StoreBid | 3 % | 3290 | 1 | 5 ms | 384694 ms | 7157 ms
|
PutCommentAuth | 0 % | 0 | 0 | 0 ms | 0 ms | 0 ms
|
PutComment | 0 % | 452 | 33 | 5 ms | 194438 ms | 5174 ms
|
StoreComment | 0 % | 401 | 0 | 5 ms | 195493 ms | 7058 ms
|
Sell | 0 % | 569 | 0 | 0 ms | 202330 ms | 6807 ms
|
SelectCategoryToSellItem | 0 % | 567 | 0 | 5 ms | 190152 ms | 6764 ms
|
SellItemForm | 0 % | 552 | 0 | 2 ms | 200800 ms | 6435 ms
|
RegisterItem | 0 % | 537 | 0 | 5 ms | 202406 ms | 5441 ms
|
AboutMe (auth form) | 1 % | 1480 | 0 | 0 ms | 379996 ms | 7004 ms
|
AboutMe | 2 % | 2527 | 0 | 12 ms | 380197 ms | 8649 ms
|
Back probability | 10 % | 9321 | 0 | 0 ms | 0 ms | 0 ms
|
End of Session | 1 % | 1297 | 0 | 0 ms | 0 ms | 0 ms
|
Total | 100 % | 91531 | 800 | - | - | 6154 ms
|
Average throughput | 205 req/s
| |||||
Completed sessions | 1311
| |||||
Total time | 385966 seconds
| |||||
Average session time | 294 seconds
| |||||
| State name | % of total | Count | Errors | Minimum Time | Maximum Time | Average Time |
|---|---|---|---|---|---|---|
Home | 3 % | 191 | 0 | 0 ms | 195877 ms | 9146 ms
|
Register | 1 % | 57 | 0 | 0 ms | 190002 ms | 15492 ms
|
RegisterUser | 1 % | 54 | 0 | 6 ms | 283006 ms | 26758 ms
|
Browse | 7 % | 363 | 0 | 0 ms | 379998 ms | 16391 ms
|
BrowseCategories | 4 % | 245 | 0 | 3 ms | 190056 ms | 16741 ms
|
SearchItemsInCategory | 14 % | 754 | 0 | 1 ms | 380142 ms | 15018 ms
|
BrowseRegions | 2 % | 112 | 0 | 3 ms | 190054 ms | 10266 ms
|
BrowseCategoriesInRegion | 2 % | 129 | 0 | 3 ms | 242523 ms | 18238 ms
|
SearchItemsInRegion | 4 % | 255 | 0 | 0 ms | 196346 ms | 13845 ms
|
ViewItem | 14 % | 750 | 0 | 4 ms | 199329 ms | 14776 ms
|
ViewUserInfo | 3 % | 164 | 0 | 4 ms | 190032 ms | 18207 ms
|
ViewBidHistory | 2 % | 105 | 0 | 4 ms | 199130 ms | 21012 ms
|
BuyNowAuth | 1 % | 73 | 0 | 2 ms | 445096 ms | 19133 ms
|
BuyNow | 1 % | 70 | 8 | 4 ms | 235013 ms | 8346 ms
|
StoreBuyBow | 0 % | 51 | 0 | 4 ms | 210996 ms | 16010 ms
|
PutBidAuth | 5 % | 268 | 0 | 0 ms | 190016 ms | 14003 ms
|
PutBid | 5 % | 284 | 29 | 5 ms | 380079 ms | 16244 ms
|
StoreBid | 3 % | 182 | 0 | 5 ms | 190038 ms | 10890 ms
|
PutCommentAuth | 0 % | 0 | 0 | 0 ms | 0 ms | 0 ms
|
PutComment | 0 % | 24 | 0 | 5 ms | 190058 ms | 42636 ms
|
StoreComment | 0 % | 30 | 0 | 5 ms | 190010 ms | 20381 ms
|
Sell | 0 % | 28 | 0 | 0 ms | 195872 ms | 8924 ms
|
SelectCategoryToSellItem | 0 % | 29 | 0 | 4 ms | 190009 ms | 13870 ms
|
SellItemForm | 0 % | 28 | 0 | 2 ms | 189997 ms | 17048 ms
|
RegisterItem | 0 % | 30 | 0 | 4 ms | 198703 ms | 16035 ms
|
AboutMe (auth form) | 1 % | 77 | 0 | 0 ms | 190004 ms | 12068 ms
|
AboutMe | 2 % | 129 | 0 | 11 ms | 190128 ms | 12871 ms
|
Back probability | 10 % | 557 | 0 | 0 ms | 0 ms | 0 ms
|
End of Session | 1 % | 77 | 0 | 0 ms | 0 ms | 0 ms
|
Total | 100 % | 5116 | 37 | - | - | 13145 ms
|
Average throughput | 171 req/s
| |||||
Completed sessions | 53
| |||||
Total time | 25698 seconds
| |||||
Average session time | 484 seconds
| |||||
| State name | % of total | Count | Errors | Minimum Time | Maximum Time | Average Time |
|---|---|---|---|---|---|---|
Home | 6 % | 8199 | 0 | 0 ms | 379992 ms | 5640 ms
|
Register | 1 % | 1475 | 0 | 0 ms | 382640 ms | 5473 ms
|
RegisterUser | 1 % | 1412 | 30 | 5 ms | 286640 ms | 6576 ms
|
Browse | 8 % | 10252 | 0 | 0 ms | 473019 ms | 6283 ms
|
BrowseCategories | 5 % | 7000 | 0 | 3 ms | 380307 ms | 6137 ms
|
SearchItemsInCategory | 15 % | 19606 | 0 | 0 ms | 381465 ms | 8050 ms
|
BrowseRegions | 2 % | 2929 | 0 | 3 ms | 241729 ms | 5172 ms
|
BrowseCategoriesInRegion | 2 % | 2811 | 0 | 3 ms | 286514 ms | 6195 ms
|
SearchItemsInRegion | 4 % | 6241 | 0 | 0 ms | 380070 ms | 7614 ms
|
ViewItem | 13 % | 17227 | 0 | 4 ms | 473012 ms | 7437 ms
|
ViewUserInfo | 2 % | 3573 | 0 | 4 ms | 384650 ms | 7148 ms
|
ViewBidHistory | 1 % | 1904 | 0 | 4 ms | 206328 ms | 7188 ms
|
BuyNowAuth | 1 % | 1489 | 0 | 2 ms | 445096 ms | 6504 ms
|
BuyNow | 1 % | 1421 | 204 | 4 ms | 380040 ms | 5967 ms
|
StoreBuyBow | 0 % | 1156 | 0 | 4 ms | 393920 ms | 7320 ms
|
PutBidAuth | 4 % | 5863 | 0 | 0 ms | 384643 ms | 6396 ms
|
PutBid | 5 % | 6374 | 779 | 0 ms | 473005 ms | 7229 ms
|
StoreBid | 3 % | 3989 | 1 | 5 ms | 384694 ms | 7317 ms
|
PutCommentAuth | 0 % | 0 | 0 | 0 ms | 0 ms | 0 ms
|
PutComment | 0 % | 546 | 43 | 5 ms | 194438 ms | 7754 ms
|
StoreComment | 0 % | 477 | 0 | 5 ms | 195493 ms | 8126 ms
|
Sell | 0 % | 829 | 0 | 0 ms | 202330 ms | 5651 ms
|
SelectCategoryToSellItem | 0 % | 808 | 0 | 4 ms | 190152 ms | 6083 ms
|
SellItemForm | 0 % | 779 | 0 | 2 ms | 200800 ms | 7077 ms
|
RegisterItem | 0 % | 752 | 0 | 4 ms | 202406 ms | 5983 ms
|
AboutMe (auth form) | 1 % | 2269 | 0 | 0 ms | 379996 ms | 6769 ms
|
AboutMe | 2 % | 3633 | 0 | 11 ms | 380197 ms | 7175 ms
|
Back probability | 9 % | 11750 | 0 | 0 ms | 0 ms | 0 ms
|
End of Session | 1 % | 1637 | 0 | 0 ms | 0 ms | 0 ms
|
Total | 100 % | 126401 | 1057 | - | - | 6157 ms
|
Average throughput | 212 req/s
| |||||
Completed sessions | 1637
| |||||
Total time | 452362 seconds
| |||||
Average session time | 276 seconds
| |||||
An error occured while waiting for remote processes termination (Skipping waits)
Command is: /usr/bin/scp farm6.csail.mit.edu:/tmp/client1 /home/drkp/sandbox/txcache/src/RUBiS-1.4.3/bench/2009-3-19@20:56:3//client1.bin
Command is: /usr/bin/ssh -x localhost /bin/bash -c 'LANG=en_GB.UTF-8 /usr/bin/sar -n DEV -n SOCK -rubcw 1 605 -f /home/drkp/sandbox/txcache/src/RUBiS-1.4.3/bench/2009-3-19@20:56:3//client1.bin > /home/drkp/sandbox/txcache/src/RUBiS-1.4.3/bench/2009-3-19@20:56:3//client1'
Command is: /usr/bin/scp farm14:/tmp/db_server0 /home/drkp/sandbox/txcache/src/RUBiS-1.4.3/bench/2009-3-19@20:56:3//db_server0.bin
Command is: /usr/bin/ssh -x localhost /bin/bash -c 'LANG=en_GB.UTF-8 /usr/bin/sar -n DEV -n SOCK -rubcw 1 605 -f /home/drkp/sandbox/txcache/src/RUBiS-1.4.3/bench/2009-3-19@20:56:3//db_server0.bin > /home/drkp/sandbox/txcache/src/RUBiS-1.4.3/bench/2009-3-19@20:56:3//db_server0'
Command is: /usr/bin/scp farm12.csail.mit.edu:/tmp/web_server0 /home/drkp/sandbox/txcache/src/RUBiS-1.4.3/bench/2009-3-19@20:56:3//web_server0.bin
Command is: /usr/bin/ssh -x localhost /bin/bash -c 'LANG=en_GB.UTF-8 /usr/bin/sar -n DEV -n SOCK -rubcw 1 605 -f /home/drkp/sandbox/txcache/src/RUBiS-1.4.3/bench/2009-3-19@20:56:3//web_server0.bin > /home/drkp/sandbox/txcache/src/RUBiS-1.4.3/bench/2009-3-19@20:56:3//web_server0'
Command is: /usr/bin/scp farm13.csail.mit.edu:/tmp/web_server1 /home/drkp/sandbox/txcache/src/RUBiS-1.4.3/bench/2009-3-19@20:56:3//web_server1.bin
Command is: /usr/bin/ssh -x localhost /bin/bash -c 'LANG=en_GB.UTF-8 /usr/bin/sar -n DEV -n SOCK -rubcw 1 605 -f /home/drkp/sandbox/txcache/src/RUBiS-1.4.3/bench/2009-3-19@20:56:3//web_server1.bin > /home/drkp/sandbox/txcache/src/RUBiS-1.4.3/bench/2009-3-19@20:56:3//web_server1'
Command is: /usr/bin/scp localhost:/tmp/client0 /home/drkp/sandbox/txcache/src/RUBiS-1.4.3/bench/2009-3-19@20:56:3//client0.bin
Command is: /usr/bin/ssh -x localhost /bin/bash -c 'LANG=en_GB.UTF-8 /usr/bin/sar -n DEV -n SOCK -rubcw 1 605 -f /home/drkp/sandbox/txcache/src/RUBiS-1.4.3/bench/2009-3-19@20:56:3//client0.bin > /home/drkp/sandbox/txcache/src/RUBiS-1.4.3/bench/2009-3-19@20:56:3//client0'
Command is: /usr/bin/scp farm6.csail.mit.edu:/tmp/trace_client1.html /home/drkp/sandbox/txcache/src/RUBiS-1.4.3/bench/2009-3-19@20:56:3//
Command is: /usr/bin/scp farm6.csail.mit.edu:/tmp/stat_client1.html /home/drkp/sandbox/txcache/src/RUBiS-1.4.3/bench/2009-3-19@20:56:3//
|
|
|
|
|
|
 | 
|
 | 
|
 | 
|
 | 
|
 | 
|
 | 
|
 | 
|
 | 
|
 | 
|