Node information
Test timing information
Up ramp statistics
Runtime session statistics
Down ramp statistics
Overall statistics
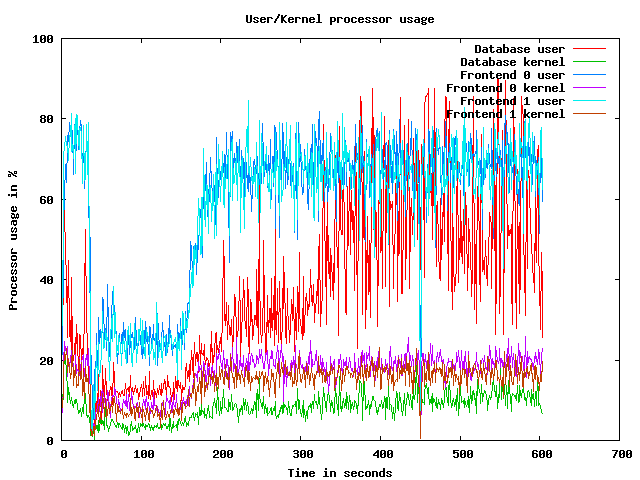
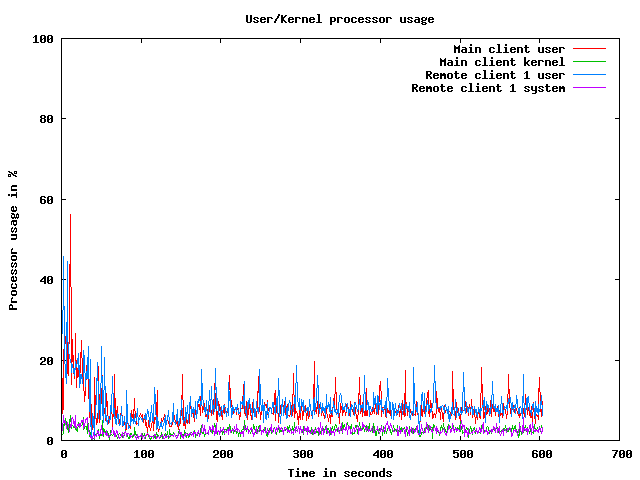
CPU usage graphs
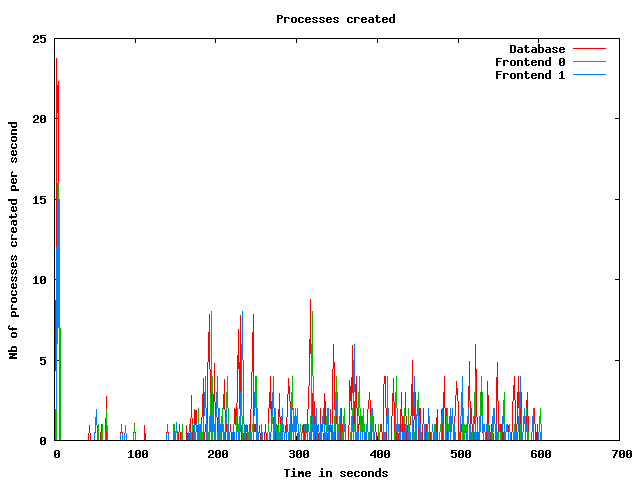
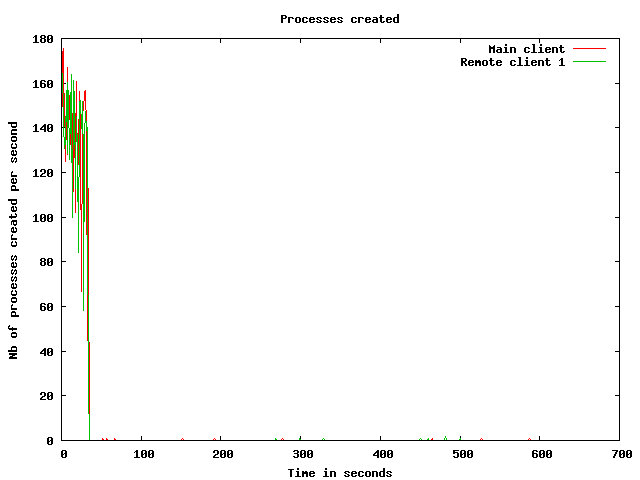
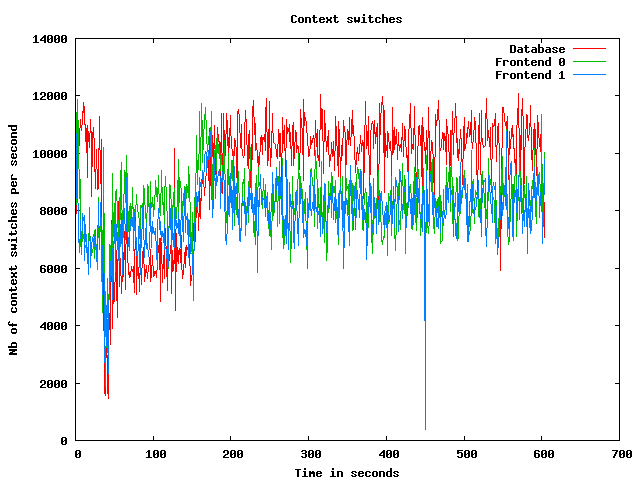
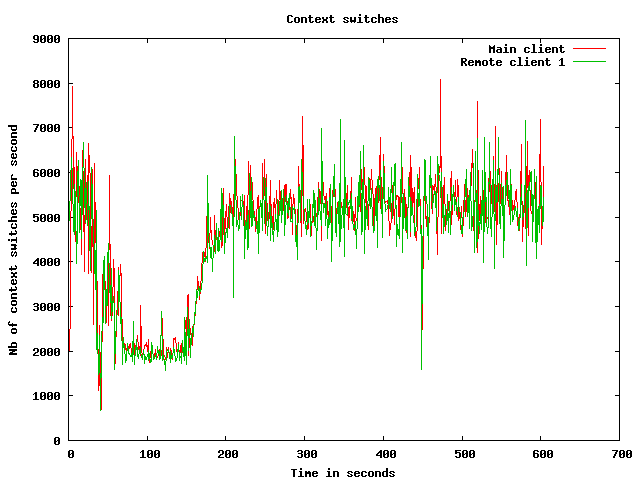
Processes usage graphs
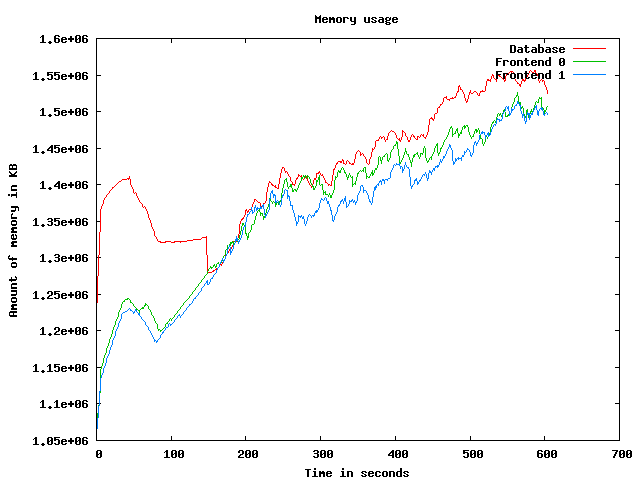
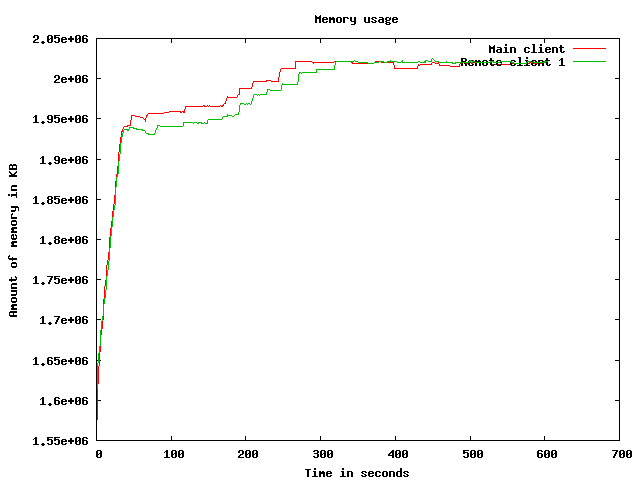
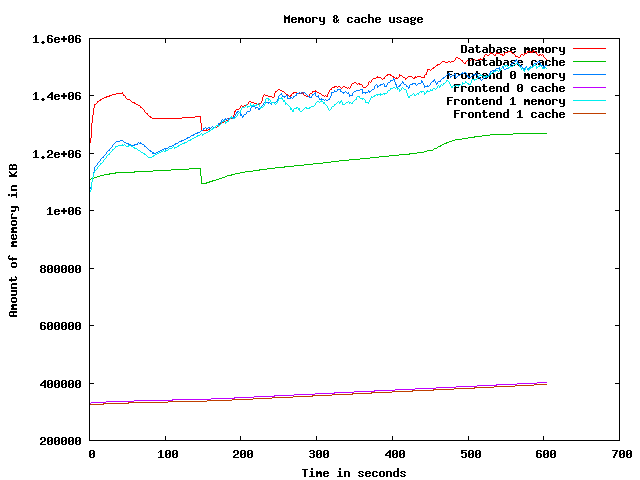
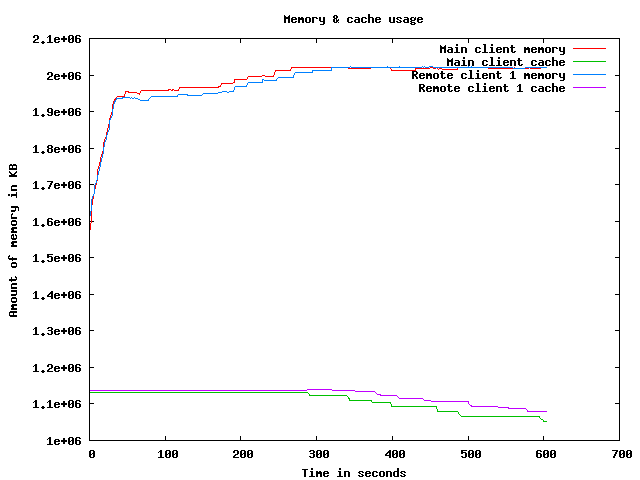
Memory usage graph
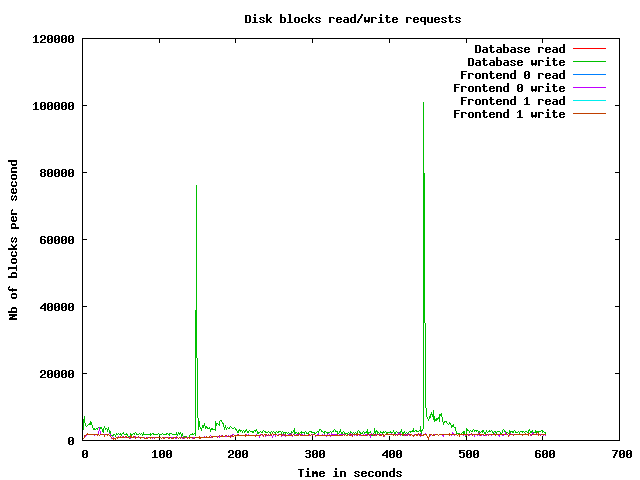
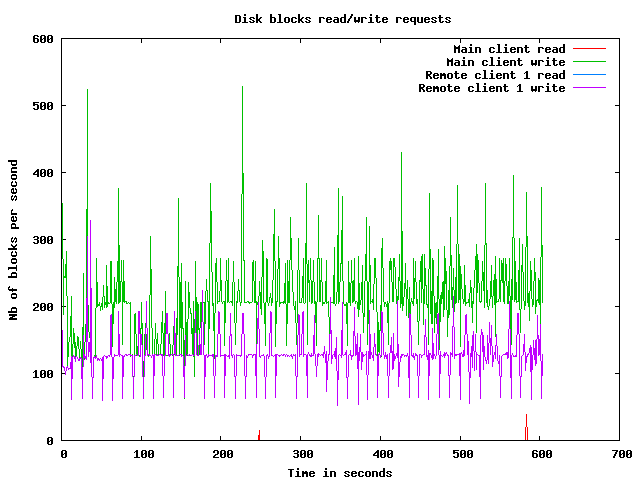
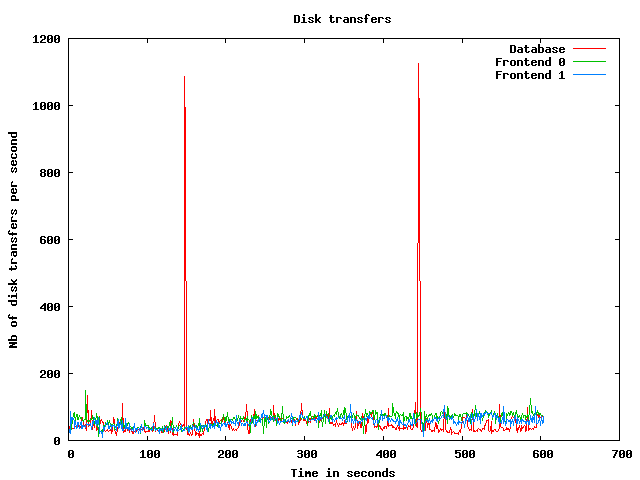
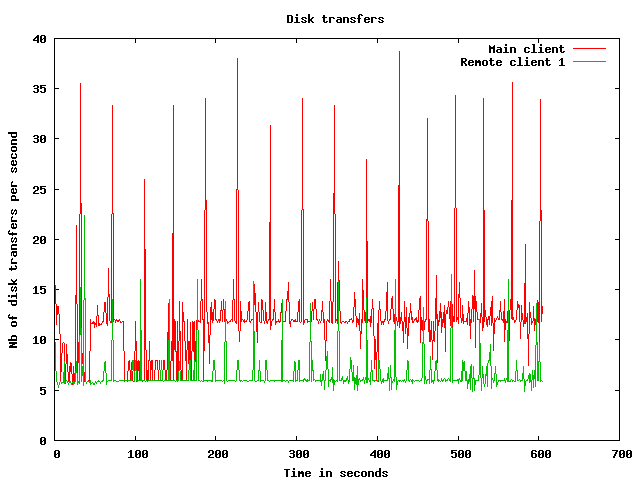
Disk usage graphs
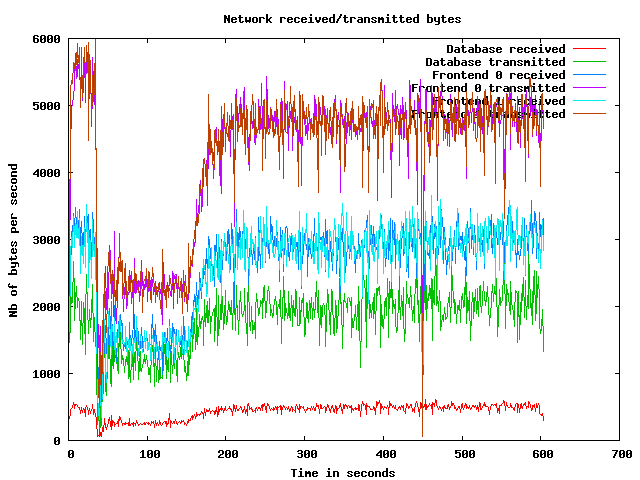
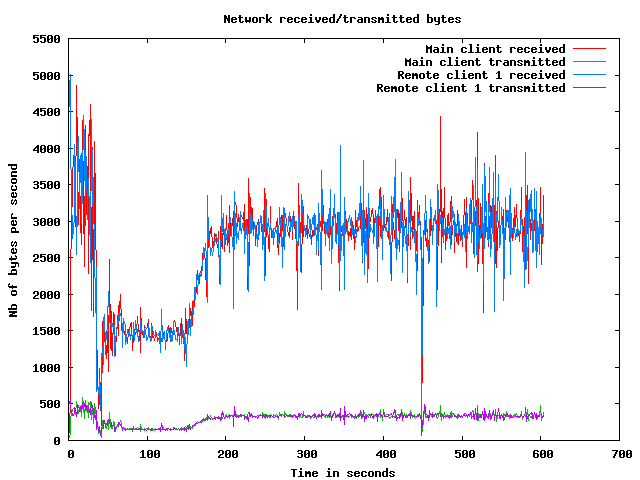
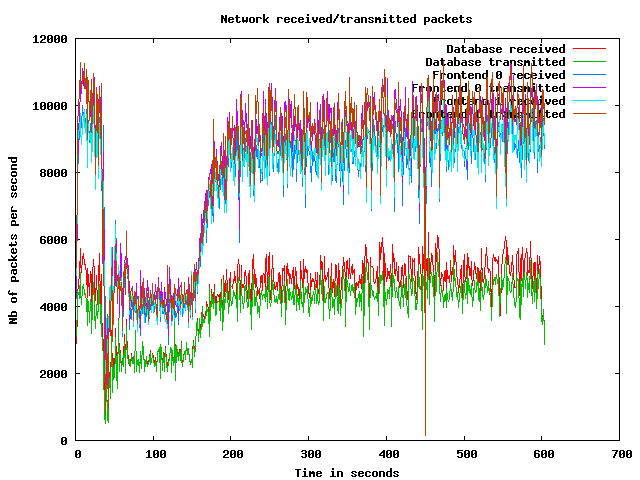
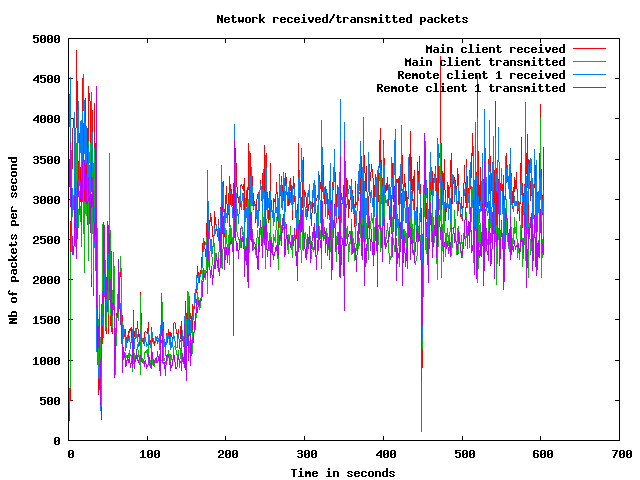
Network usage graphs
| Test start | 2009-3-19 21:36:38 |
| Up ramp start | 2009-3-19 21:37:14 |
| Runtime session start | 2009-3-19 21:39:14 |
| Down ramp start | 2009-3-19 21:46:44 |
| Test end | 2009-3-19 21:49:30 |
| Up ramp length | 2 minutes 1 millisecond (requested 120000 ms) |
| Runtime session length | 7 minutes 30 seconds 13 milliseconds (requested 450000 ms) |
| Down ramp length | 30 seconds 0 millisecond (requested 30000 ms) |
| Total test length | 12 minutes 51 seconds 898 milliseconds |
| State name | % of total | Count | Errors | Minimum Time | Maximum Time | Average Time |
|---|---|---|---|---|---|---|
Home | 9 % | 8021 | 0 | 0 ms | 59100 ms | 5369 ms
|
Register | 1 % | 1121 | 0 | 0 ms | 45519 ms | 1755 ms
|
RegisterUser | 1 % | 1049 | 8 | 5 ms | 45668 ms | 1831 ms
|
Browse | 9 % | 8157 | 0 | 0 ms | 59096 ms | 2551 ms
|
BrowseCategories | 6 % | 5415 | 0 | 3 ms | 65093 ms | 1923 ms
|
SearchItemsInCategory | 14 % | 12577 | 0 | 3 ms | 59102 ms | 1538 ms
|
BrowseRegions | 2 % | 2290 | 0 | 3 ms | 56103 ms | 1973 ms
|
BrowseCategoriesInRegion | 2 % | 2139 | 0 | 3 ms | 59105 ms | 1540 ms
|
SearchItemsInRegion | 5 % | 4335 | 0 | 0 ms | 45465 ms | 1571 ms
|
ViewItem | 12 % | 10939 | 0 | 3 ms | 56100 ms | 1452 ms
|
ViewUserInfo | 2 % | 2071 | 0 | 3 ms | 45760 ms | 1331 ms
|
ViewBidHistory | 1 % | 1080 | 0 | 3 ms | 45187 ms | 953 ms
|
BuyNowAuth | 1 % | 924 | 0 | 2 ms | 56098 ms | 988 ms
|
BuyNow | 0 % | 830 | 121 | 4 ms | 45069 ms | 1516 ms
|
StoreBuyBow | 0 % | 612 | 0 | 4 ms | 45168 ms | 1141 ms
|
PutBidAuth | 4 % | 3725 | 0 | 0 ms | 65102 ms | 1245 ms
|
PutBid | 4 % | 3742 | 499 | 3 ms | 48947 ms | 1318 ms
|
StoreBid | 2 % | 2165 | 1 | 4 ms | 45648 ms | 1461 ms
|
PutCommentAuth | 0 % | 0 | 0 | 0 ms | 0 ms | 0 ms
|
PutComment | 0 % | 292 | 31 | 4 ms | 45656 ms | 1661 ms
|
StoreComment | 0 % | 238 | 0 | 4 ms | 45116 ms | 802 ms
|
Sell | 0 % | 596 | 0 | 0 ms | 45634 ms | 2322 ms
|
SelectCategoryToSellItem | 0 % | 554 | 0 | 3 ms | 45019 ms | 1601 ms
|
SellItemForm | 0 % | 508 | 0 | 2 ms | 45180 ms | 1841 ms
|
RegisterItem | 0 % | 475 | 0 | 4 ms | 45303 ms | 1446 ms
|
AboutMe (auth form) | 2 % | 1843 | 0 | 0 ms | 49120 ms | 2012 ms
|
AboutMe | 3 % | 2635 | 0 | 4 ms | 45795 ms | 1718 ms
|
Back probability | 8 % | 6988 | 0 | 0 ms | 0 ms | 0 ms
|
End of Session | 1 % | 883 | 0 | 0 ms | 0 ms | 0 ms
|
Total | 100 % | 86204 | 660 | - | - | 1844 ms
|
Average throughput | 723 req/s
| |||||
Completed sessions | 801
| |||||
Total time | 43838 seconds
| |||||
Average session time | 54 seconds
| |||||
| State name | % of total | Count | Errors | Minimum Time | Maximum Time | Average Time |
|---|---|---|---|---|---|---|
Home | 4 % | 15668 | 0 | 0 ms | 21537 ms | 26 ms
|
Register | 1 % | 3846 | 0 | 0 ms | 21557 ms | 50 ms
|
RegisterUser | 1 % | 3775 | 73 | 5 ms | 21429 ms | 82 ms
|
Browse | 7 % | 25749 | 0 | 0 ms | 21570 ms | 46 ms
|
BrowseCategories | 4 % | 18044 | 0 | 3 ms | 21680 ms | 76 ms
|
SearchItemsInCategory | 15 % | 57021 | 0 | 1 ms | 21770 ms | 82 ms
|
BrowseRegions | 2 % | 7388 | 0 | 3 ms | 21610 ms | 77 ms
|
BrowseCategoriesInRegion | 1 % | 7268 | 0 | 3 ms | 21664 ms | 72 ms
|
SearchItemsInRegion | 5 % | 18564 | 0 | 0 ms | 21636 ms | 107 ms
|
ViewItem | 14 % | 51939 | 0 | 3 ms | 45078 ms | 90 ms
|
ViewUserInfo | 3 % | 11864 | 0 | 3 ms | 21652 ms | 89 ms
|
ViewBidHistory | 1 % | 6475 | 0 | 3 ms | 22797 ms | 213 ms
|
BuyNowAuth | 1 % | 4992 | 0 | 2 ms | 21008 ms | 53 ms
|
BuyNow | 1 % | 4895 | 686 | 4 ms | 10221 ms | 87 ms
|
StoreBuyBow | 1 % | 4161 | 3 | 5 ms | 21682 ms | 88 ms
|
PutBidAuth | 4 % | 18047 | 0 | 0 ms | 21660 ms | 53 ms
|
PutBid | 5 % | 20856 | 2355 | 2 ms | 21815 ms | 98 ms
|
StoreBid | 3 % | 13627 | 11 | 5 ms | 21615 ms | 82 ms
|
PutCommentAuth | 0 % | 0 | 0 | 0 ms | 0 ms | 0 ms
|
PutComment | 0 % | 1757 | 133 | 5 ms | 9366 ms | 80 ms
|
StoreComment | 0 % | 1580 | 0 | 4 ms | 21536 ms | 107 ms
|
Sell | 0 % | 2096 | 0 | 0 ms | 10176 ms | 51 ms
|
SelectCategoryToSellItem | 0 % | 2059 | 0 | 3 ms | 10371 ms | 78 ms
|
SellItemForm | 0 % | 2027 | 0 | 2 ms | 9925 ms | 48 ms
|
RegisterItem | 0 % | 1987 | 0 | 4 ms | 9229 ms | 62 ms
|
AboutMe (auth form) | 1 % | 5955 | 0 | 0 ms | 21580 ms | 56 ms
|
AboutMe | 2 % | 10201 | 0 | 4 ms | 22081 ms | 174 ms
|
Back probability | 10 % | 38583 | 0 | 0 ms | 0 ms | 0 ms
|
End of Session | 1 % | 5470 | 0 | 0 ms | 0 ms | 0 ms
|
Total | 100 % | 365894 | 3261 | - | - | 72 ms
|
Average throughput | 820 req/s
| |||||
Completed sessions | 5466
| |||||
Total time | 1381348 seconds
| |||||
Average session time | 252 seconds
| |||||
| State name | % of total | Count | Errors | Minimum Time | Maximum Time | Average Time |
|---|---|---|---|---|---|---|
Home | 4 % | 542 | 0 | 0 ms | 84 ms | 1 ms
|
Register | 0 % | 113 | 0 | 0 ms | 46 ms | 2 ms
|
RegisterUser | 1 % | 144 | 3 | 5 ms | 84 ms | 14 ms
|
Browse | 7 % | 882 | 0 | 0 ms | 88 ms | 1 ms
|
BrowseCategories | 4 % | 573 | 0 | 3 ms | 80 ms | 10 ms
|
SearchItemsInCategory | 15 % | 1847 | 0 | 3 ms | 827 ms | 12 ms
|
BrowseRegions | 2 % | 261 | 0 | 3 ms | 180 ms | 10 ms
|
BrowseCategoriesInRegion | 2 % | 263 | 0 | 3 ms | 70 ms | 10 ms
|
SearchItemsInRegion | 5 % | 646 | 0 | 0 ms | 846 ms | 28 ms
|
ViewItem | 13 % | 1712 | 0 | 3 ms | 378 ms | 15 ms
|
ViewUserInfo | 3 % | 395 | 0 | 3 ms | 107 ms | 14 ms
|
ViewBidHistory | 1 % | 218 | 0 | 3 ms | 679 ms | 60 ms
|
BuyNowAuth | 1 % | 161 | 0 | 2 ms | 50 ms | 5 ms
|
BuyNow | 1 % | 168 | 29 | 4 ms | 172 ms | 17 ms
|
StoreBuyBow | 1 % | 142 | 0 | 5 ms | 101 ms | 13 ms
|
PutBidAuth | 4 % | 603 | 0 | 0 ms | 60 ms | 4 ms
|
PutBid | 5 % | 718 | 80 | 3 ms | 176 ms | 19 ms
|
StoreBid | 3 % | 479 | 0 | 4 ms | 88 ms | 14 ms
|
PutCommentAuth | 0 % | 0 | 0 | 0 ms | 0 ms | 0 ms
|
PutComment | 0 % | 67 | 6 | 3 ms | 49 ms | 15 ms
|
StoreComment | 0 % | 66 | 0 | 4 ms | 53 ms | 10 ms
|
Sell | 0 % | 74 | 0 | 0 ms | 69 ms | 2 ms
|
SelectCategoryToSellItem | 0 % | 79 | 0 | 4 ms | 88 ms | 17 ms
|
SellItemForm | 0 % | 91 | 0 | 2 ms | 54 ms | 4 ms
|
RegisterItem | 0 % | 74 | 0 | 4 ms | 52 ms | 10 ms
|
AboutMe (auth form) | 1 % | 209 | 0 | 0 ms | 40 ms | 1 ms
|
AboutMe | 2 % | 317 | 0 | 4 ms | 300 ms | 44 ms
|
Back probability | 10 % | 1264 | 0 | 0 ms | 0 ms | 0 ms
|
End of Session | 1 % | 188 | 0 | 0 ms | 0 ms | 0 ms
|
Total | 100 % | 12296 | 118 | - | - | 12 ms
|
Average throughput | 413 req/s
| |||||
Completed sessions | 183
| |||||
Total time | 59737 seconds
| |||||
Average session time | 326 seconds
| |||||
| State name | % of total | Count | Errors | Minimum Time | Maximum Time | Average Time |
|---|---|---|---|---|---|---|
Home | 5 % | 24231 | 0 | 0 ms | 59100 ms | 1794 ms
|
Register | 1 % | 5080 | 0 | 0 ms | 45519 ms | 425 ms
|
RegisterUser | 1 % | 4968 | 84 | 5 ms | 45668 ms | 449 ms
|
Browse | 7 % | 34788 | 0 | 0 ms | 59096 ms | 632 ms
|
BrowseCategories | 5 % | 24032 | 0 | 3 ms | 65093 ms | 490 ms
|
SearchItemsInCategory | 15 % | 71688 | 0 | 1 ms | 59102 ms | 335 ms
|
BrowseRegions | 2 % | 9939 | 0 | 3 ms | 56103 ms | 512 ms
|
BrowseCategoriesInRegion | 2 % | 9670 | 0 | 3 ms | 59105 ms | 395 ms
|
SearchItemsInRegion | 5 % | 23599 | 0 | 0 ms | 45465 ms | 374 ms
|
ViewItem | 13 % | 64698 | 0 | 3 ms | 56100 ms | 318 ms
|
ViewUserInfo | 3 % | 14378 | 0 | 3 ms | 45760 ms | 265 ms
|
ViewBidHistory | 1 % | 7789 | 0 | 3 ms | 45187 ms | 311 ms
|
BuyNowAuth | 1 % | 6077 | 0 | 2 ms | 56098 ms | 194 ms
|
BuyNow | 1 % | 5893 | 836 | 4 ms | 45069 ms | 286 ms
|
StoreBuyBow | 1 % | 4915 | 3 | 4 ms | 45168 ms | 217 ms
|
PutBidAuth | 4 % | 22376 | 0 | 0 ms | 65102 ms | 250 ms
|
PutBid | 5 % | 25379 | 2934 | 2 ms | 48947 ms | 276 ms
|
StoreBid | 3 % | 16271 | 12 | 4 ms | 45648 ms | 264 ms
|
PutCommentAuth | 0 % | 0 | 0 | 0 ms | 0 ms | 0 ms
|
PutComment | 0 % | 2116 | 170 | 3 ms | 45656 ms | 296 ms
|
StoreComment | 0 % | 1884 | 0 | 4 ms | 45116 ms | 191 ms
|
Sell | 0 % | 2766 | 0 | 0 ms | 45634 ms | 539 ms
|
SelectCategoryToSellItem | 0 % | 2692 | 0 | 3 ms | 45019 ms | 390 ms
|
SellItemForm | 0 % | 2626 | 0 | 2 ms | 45180 ms | 393 ms
|
RegisterItem | 0 % | 2536 | 0 | 4 ms | 45303 ms | 319 ms
|
AboutMe (auth form) | 1 % | 8007 | 0 | 0 ms | 49120 ms | 505 ms
|
AboutMe | 2 % | 13235 | 0 | 4 ms | 45795 ms | 477 ms
|
Back probability | 10 % | 46835 | 0 | 0 ms | 0 ms | 0 ms
|
End of Session | 1 % | 6541 | 0 | 0 ms | 0 ms | 0 ms
|
Total | 100 % | 465009 | 4039 | - | - | 398 ms
|
Average throughput | 781 req/s
| |||||
Completed sessions | 6541
| |||||
Total time | 1517296 seconds
| |||||
Average session time | 231 seconds
| |||||
An error occured while waiting for remote processes termination (Skipping waits)
Command is: /usr/bin/scp farm6.csail.mit.edu:/tmp/client1 /home/drkp/sandbox/txcache/src/RUBiS-1.4.3/bench/2009-3-19@21:36:38//client1.bin
Command is: /usr/bin/ssh -x localhost /bin/bash -c 'LANG=en_GB.UTF-8 /usr/bin/sar -n DEV -n SOCK -rubcw 1 605 -f /home/drkp/sandbox/txcache/src/RUBiS-1.4.3/bench/2009-3-19@21:36:38//client1.bin > /home/drkp/sandbox/txcache/src/RUBiS-1.4.3/bench/2009-3-19@21:36:38//client1'
Command is: /usr/bin/scp farm14:/tmp/db_server0 /home/drkp/sandbox/txcache/src/RUBiS-1.4.3/bench/2009-3-19@21:36:38//db_server0.bin
Command is: /usr/bin/ssh -x localhost /bin/bash -c 'LANG=en_GB.UTF-8 /usr/bin/sar -n DEV -n SOCK -rubcw 1 605 -f /home/drkp/sandbox/txcache/src/RUBiS-1.4.3/bench/2009-3-19@21:36:38//db_server0.bin > /home/drkp/sandbox/txcache/src/RUBiS-1.4.3/bench/2009-3-19@21:36:38//db_server0'
Command is: /usr/bin/scp farm12.csail.mit.edu:/tmp/web_server0 /home/drkp/sandbox/txcache/src/RUBiS-1.4.3/bench/2009-3-19@21:36:38//web_server0.bin
Command is: /usr/bin/ssh -x localhost /bin/bash -c 'LANG=en_GB.UTF-8 /usr/bin/sar -n DEV -n SOCK -rubcw 1 605 -f /home/drkp/sandbox/txcache/src/RUBiS-1.4.3/bench/2009-3-19@21:36:38//web_server0.bin > /home/drkp/sandbox/txcache/src/RUBiS-1.4.3/bench/2009-3-19@21:36:38//web_server0'
Command is: /usr/bin/scp farm13.csail.mit.edu:/tmp/web_server1 /home/drkp/sandbox/txcache/src/RUBiS-1.4.3/bench/2009-3-19@21:36:38//web_server1.bin
Command is: /usr/bin/ssh -x localhost /bin/bash -c 'LANG=en_GB.UTF-8 /usr/bin/sar -n DEV -n SOCK -rubcw 1 605 -f /home/drkp/sandbox/txcache/src/RUBiS-1.4.3/bench/2009-3-19@21:36:38//web_server1.bin > /home/drkp/sandbox/txcache/src/RUBiS-1.4.3/bench/2009-3-19@21:36:38//web_server1'
Command is: /usr/bin/scp localhost:/tmp/client0 /home/drkp/sandbox/txcache/src/RUBiS-1.4.3/bench/2009-3-19@21:36:38//client0.bin
Command is: /usr/bin/ssh -x localhost /bin/bash -c 'LANG=en_GB.UTF-8 /usr/bin/sar -n DEV -n SOCK -rubcw 1 605 -f /home/drkp/sandbox/txcache/src/RUBiS-1.4.3/bench/2009-3-19@21:36:38//client0.bin > /home/drkp/sandbox/txcache/src/RUBiS-1.4.3/bench/2009-3-19@21:36:38//client0'
Command is: /usr/bin/scp farm6.csail.mit.edu:/tmp/trace_client1.html /home/drkp/sandbox/txcache/src/RUBiS-1.4.3/bench/2009-3-19@21:36:38//
Command is: /usr/bin/scp farm6.csail.mit.edu:/tmp/stat_client1.html /home/drkp/sandbox/txcache/src/RUBiS-1.4.3/bench/2009-3-19@21:36:38//
|
|
|
|
|
|
 | 
|
 | 
|
 | 
|
 | 
|
 | 
|
 | 
|
 | 
|
 | 
|
 | 
|