Node information
Test timing information
Up ramp statistics
Runtime session statistics
Down ramp statistics
Overall statistics
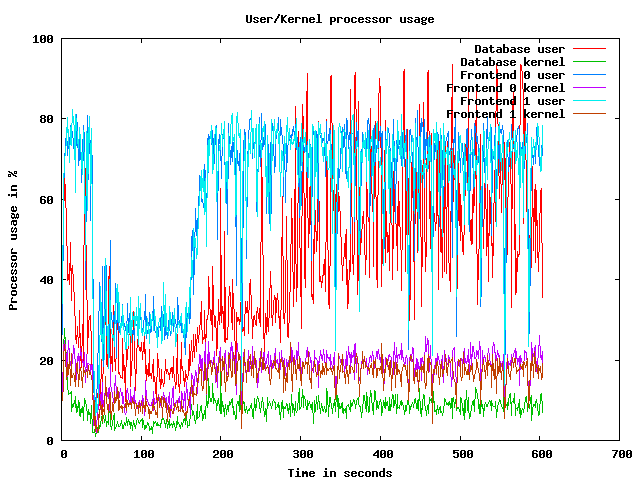
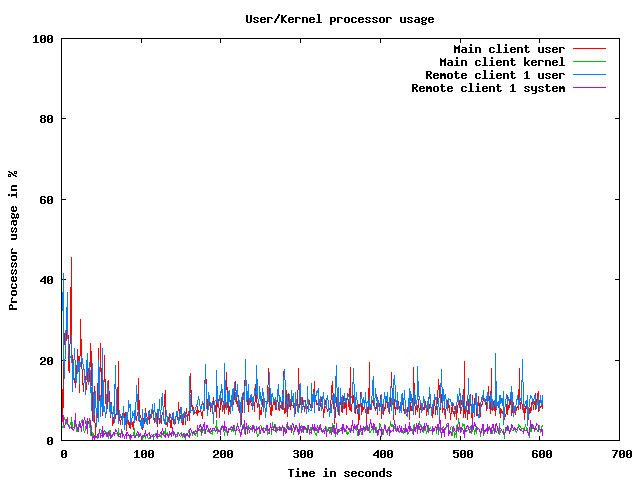
CPU usage graphs
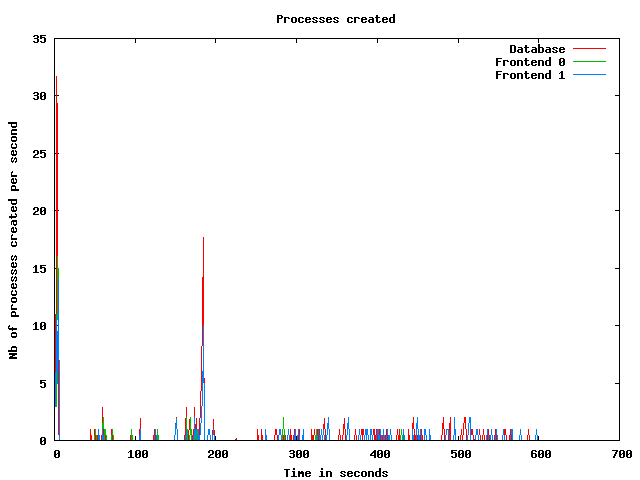
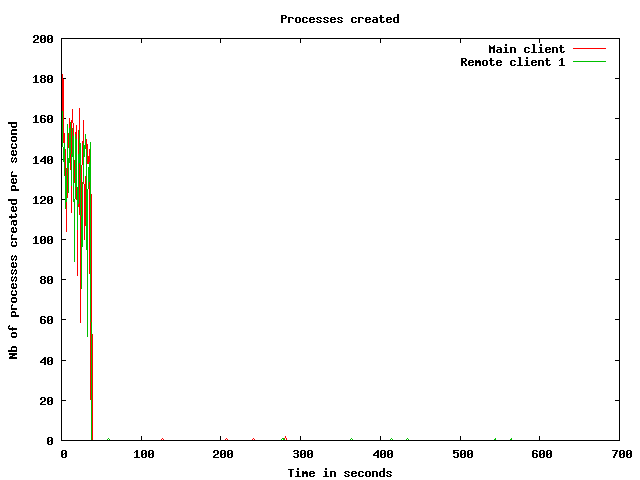
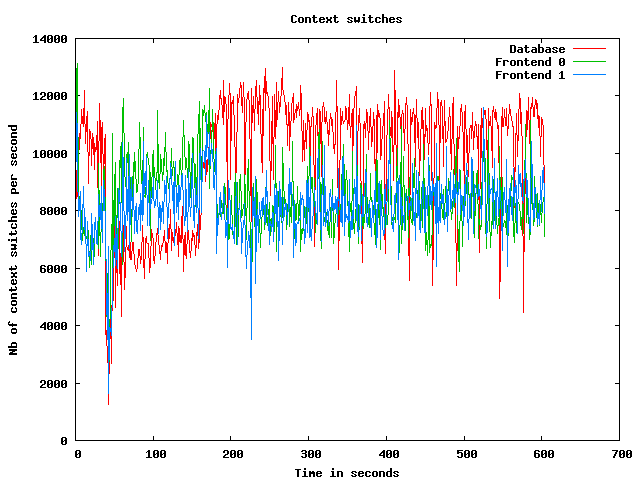
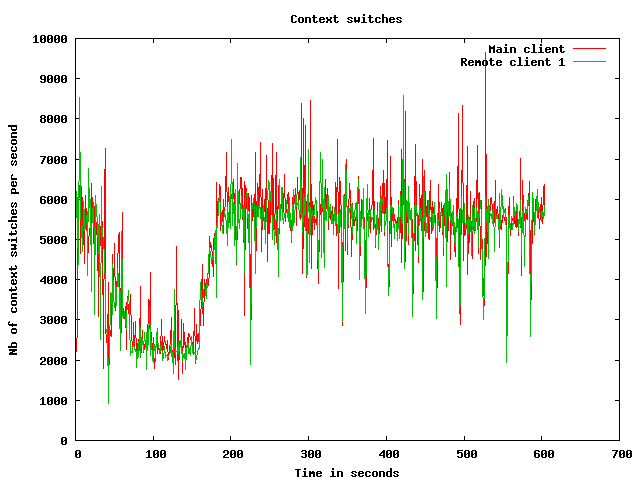
Processes usage graphs
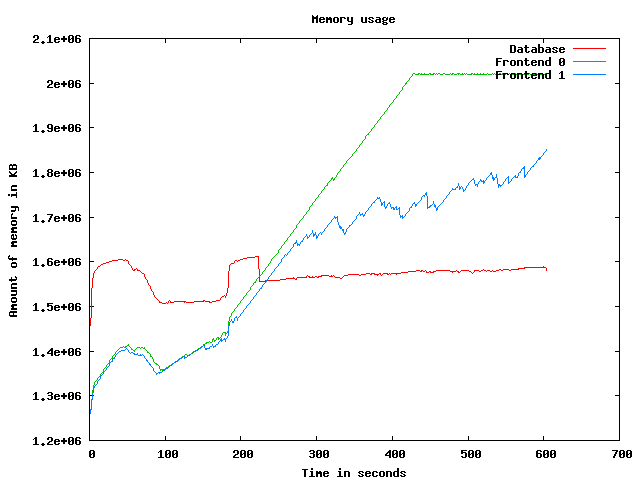
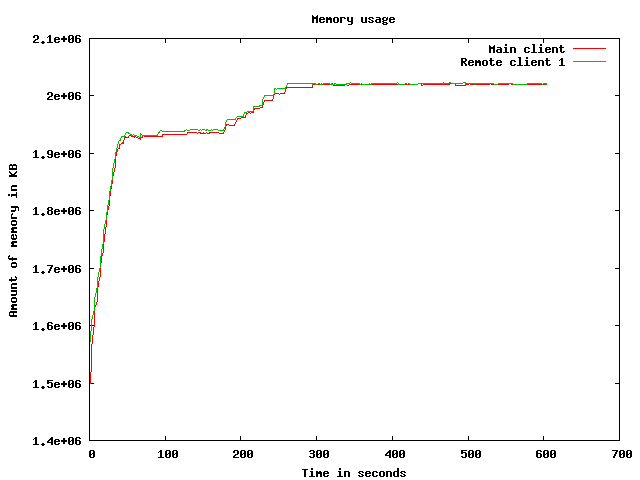
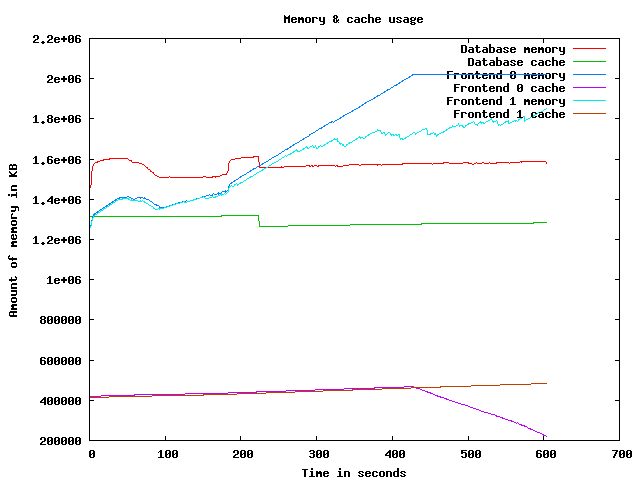
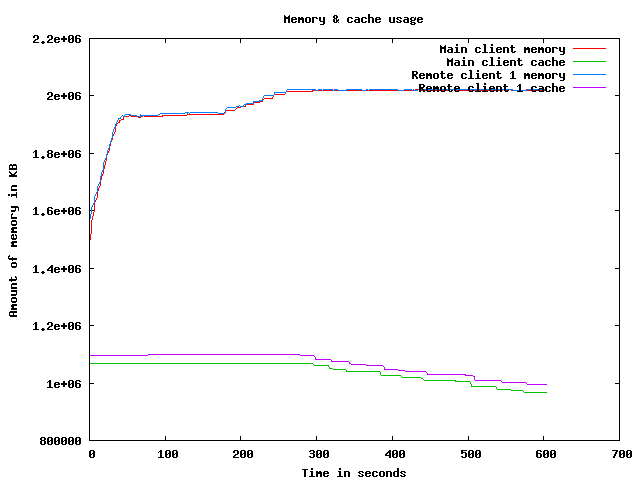
Memory usage graph
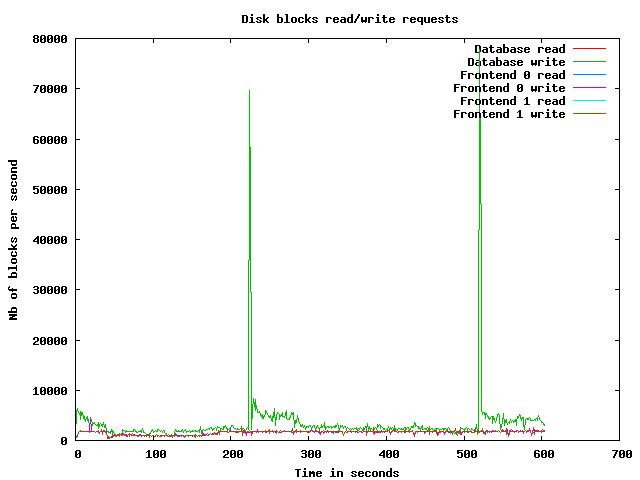
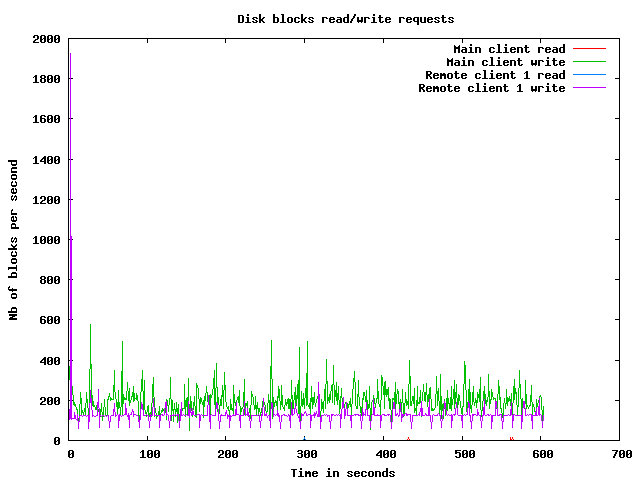
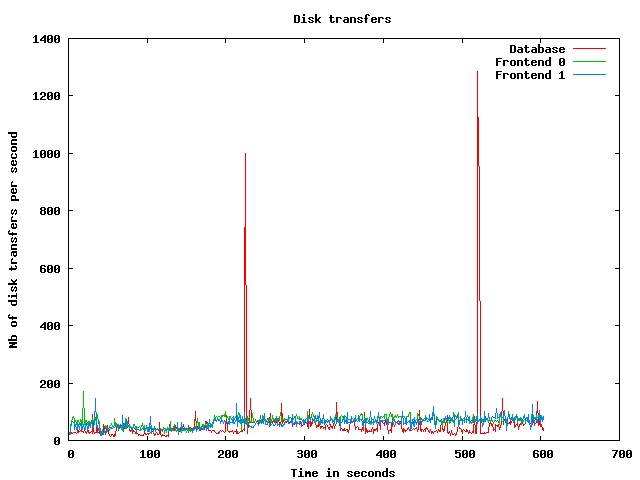
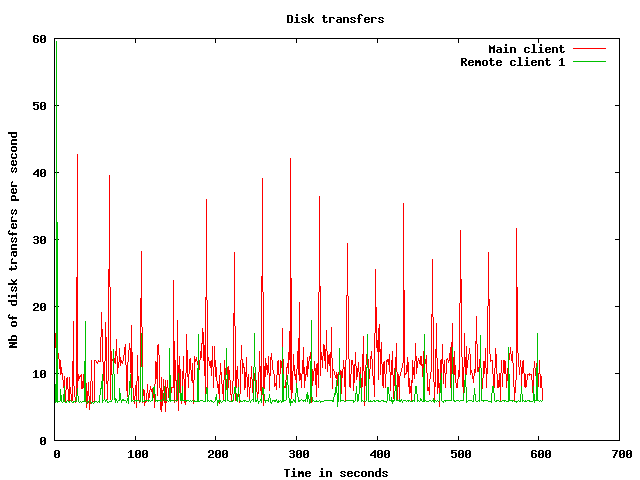
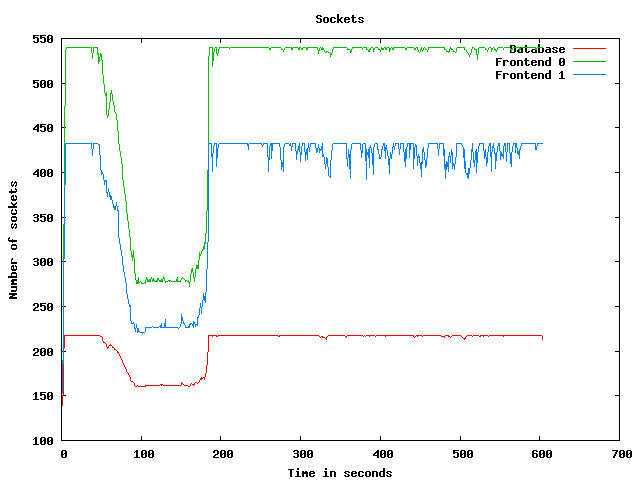
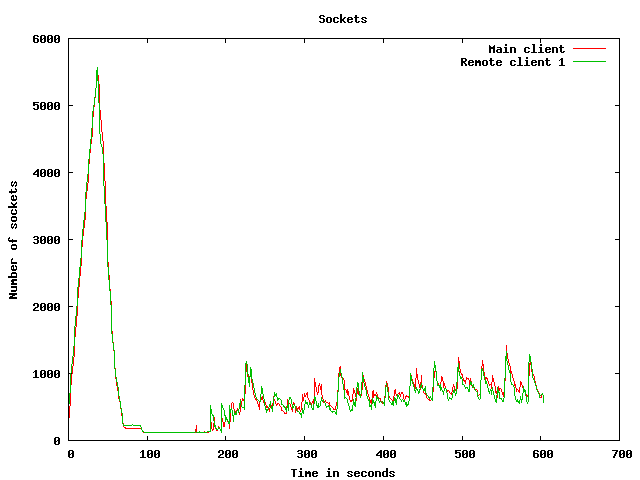
Disk usage graphs
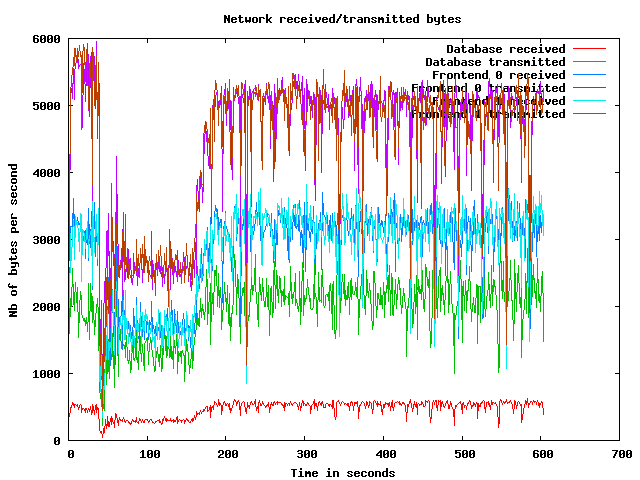
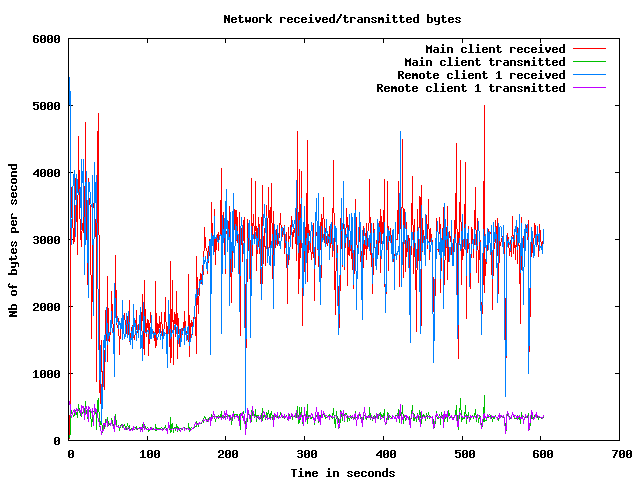
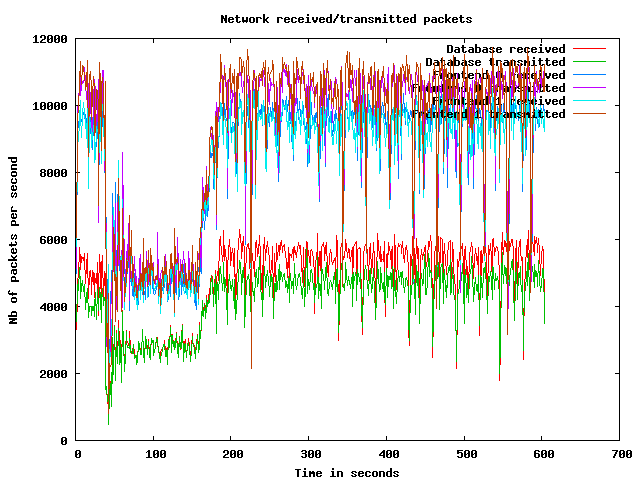
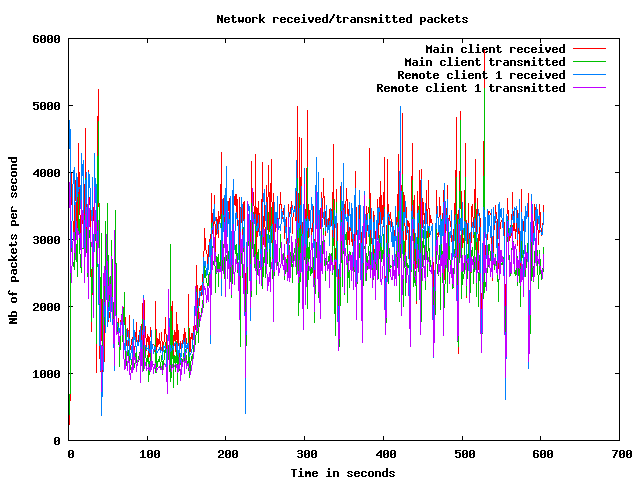
Network usage graphs
| Test start | 2009-3-19 21:50:22 |
| Up ramp start | 2009-3-19 21:51:2 |
| Runtime session start | 2009-3-19 21:53:2 |
| Down ramp start | 2009-3-19 22:0:32 |
| Test end | 2009-3-19 22:3:12 |
| Up ramp length | 2 minutes 1 millisecond (requested 120000 ms) |
| Runtime session length | 7 minutes 30 seconds 0 millisecond (requested 450000 ms) |
| Down ramp length | 30 seconds 1 millisecond (requested 30000 ms) |
| Total test length | 12 minutes 49 seconds 873 milliseconds |
| State name | % of total | Count | Errors | Minimum Time | Maximum Time | Average Time |
|---|---|---|---|---|---|---|
Home | 9 % | 8736 | 0 | 0 ms | 93055 ms | 6090 ms
|
Register | 1 % | 1242 | 0 | 0 ms | 45753 ms | 2152 ms
|
RegisterUser | 1 % | 1156 | 23 | 5 ms | 45835 ms | 2345 ms
|
Browse | 9 % | 9071 | 0 | 0 ms | 92996 ms | 2583 ms
|
BrowseCategories | 6 % | 6094 | 0 | 3 ms | 65096 ms | 1877 ms
|
SearchItemsInCategory | 15 % | 14257 | 0 | 3 ms | 93006 ms | 1541 ms
|
BrowseRegions | 2 % | 2428 | 0 | 3 ms | 65131 ms | 1890 ms
|
BrowseCategoriesInRegion | 2 % | 2249 | 0 | 3 ms | 93006 ms | 1806 ms
|
SearchItemsInRegion | 4 % | 4641 | 0 | 0 ms | 65139 ms | 1462 ms
|
ViewItem | 12 % | 11793 | 0 | 3 ms | 93013 ms | 1505 ms
|
ViewUserInfo | 2 % | 2237 | 0 | 3 ms | 45882 ms | 1431 ms
|
ViewBidHistory | 1 % | 1204 | 0 | 3 ms | 45754 ms | 1269 ms
|
BuyNowAuth | 1 % | 1037 | 0 | 2 ms | 45530 ms | 1725 ms
|
BuyNow | 0 % | 939 | 135 | 3 ms | 59118 ms | 1168 ms
|
StoreBuyBow | 0 % | 708 | 1 | 4 ms | 45475 ms | 1128 ms
|
PutBidAuth | 4 % | 4151 | 0 | 0 ms | 45856 ms | 1269 ms
|
PutBid | 4 % | 4196 | 525 | 4 ms | 45911 ms | 1319 ms
|
StoreBid | 2 % | 2479 | 1 | 4 ms | 45547 ms | 1223 ms
|
PutCommentAuth | 0 % | 0 | 0 | 0 ms | 0 ms | 0 ms
|
PutComment | 0 % | 342 | 30 | 4 ms | 45518 ms | 1693 ms
|
StoreComment | 0 % | 277 | 0 | 5 ms | 45164 ms | 1344 ms
|
Sell | 0 % | 700 | 0 | 0 ms | 59204 ms | 2209 ms
|
SelectCategoryToSellItem | 0 % | 652 | 0 | 4 ms | 45731 ms | 1834 ms
|
SellItemForm | 0 % | 606 | 0 | 2 ms | 65138 ms | 1683 ms
|
RegisterItem | 0 % | 574 | 0 | 4 ms | 45312 ms | 1868 ms
|
AboutMe (auth form) | 2 % | 1952 | 0 | 0 ms | 65364 ms | 1986 ms
|
AboutMe | 2 % | 2682 | 0 | 4 ms | 45784 ms | 1756 ms
|
Back probability | 8 % | 7622 | 0 | 0 ms | 0 ms | 0 ms
|
End of Session | 1 % | 972 | 0 | 0 ms | 0 ms | 0 ms
|
Total | 100 % | 94997 | 715 | - | - | 1935 ms
|
Average throughput | 797 req/s
| |||||
Completed sessions | 887
| |||||
Total time | 50771 seconds
| |||||
Average session time | 57 seconds
| |||||
| State name | % of total | Count | Errors | Minimum Time | Maximum Time | Average Time |
|---|---|---|---|---|---|---|
Home | 4 % | 15425 | 0 | 0 ms | 190842 ms | 274 ms
|
Register | 1 % | 3723 | 0 | 0 ms | 190006 ms | 687 ms
|
RegisterUser | 1 % | 3683 | 98 | 6 ms | 190088 ms | 807 ms
|
Browse | 7 % | 25628 | 0 | 0 ms | 196935 ms | 746 ms
|
BrowseCategories | 4 % | 17857 | 0 | 3 ms | 190865 ms | 730 ms
|
SearchItemsInCategory | 15 % | 56363 | 0 | 3 ms | 199928 ms | 734 ms
|
BrowseRegions | 2 % | 7475 | 0 | 3 ms | 190121 ms | 702 ms
|
BrowseCategoriesInRegion | 2 % | 7373 | 0 | 3 ms | 212528 ms | 716 ms
|
SearchItemsInRegion | 5 % | 18977 | 0 | 0 ms | 212562 ms | 770 ms
|
ViewItem | 14 % | 51950 | 0 | 3 ms | 200584 ms | 703 ms
|
ViewUserInfo | 3 % | 12113 | 0 | 3 ms | 283817 ms | 745 ms
|
ViewBidHistory | 1 % | 6275 | 0 | 3 ms | 191228 ms | 1030 ms
|
BuyNowAuth | 1 % | 4784 | 0 | 2 ms | 191459 ms | 783 ms
|
BuyNow | 1 % | 4700 | 649 | 4 ms | 212589 ms | 902 ms
|
StoreBuyBow | 1 % | 3991 | 5 | 5 ms | 190055 ms | 668 ms
|
PutBidAuth | 5 % | 18336 | 0 | 0 ms | 284289 ms | 621 ms
|
PutBid | 5 % | 21254 | 2372 | 4 ms | 194478 ms | 705 ms
|
StoreBid | 3 % | 14010 | 12 | 4 ms | 194023 ms | 675 ms
|
PutCommentAuth | 0 % | 0 | 0 | 0 ms | 0 ms | 0 ms
|
PutComment | 0 % | 1826 | 137 | 4 ms | 190078 ms | 658 ms
|
StoreComment | 0 % | 1661 | 0 | 5 ms | 47160 ms | 580 ms
|
Sell | 0 % | 1981 | 0 | 0 ms | 94087 ms | 762 ms
|
SelectCategoryToSellItem | 0 % | 1944 | 0 | 3 ms | 46469 ms | 553 ms
|
SellItemForm | 0 % | 1907 | 0 | 2 ms | 94579 ms | 730 ms
|
RegisterItem | 0 % | 1877 | 0 | 5 ms | 190854 ms | 808 ms
|
AboutMe (auth form) | 1 % | 6102 | 0 | 0 ms | 194178 ms | 789 ms
|
AboutMe | 2 % | 10361 | 0 | 5 ms | 190221 ms | 776 ms
|
Back probability | 10 % | 38703 | 0 | 0 ms | 0 ms | 0 ms
|
End of Session | 1 % | 5365 | 0 | 0 ms | 0 ms | 0 ms
|
Total | 100 % | 365644 | 3273 | - | - | 616 ms
|
Average throughput | 819 req/s
| |||||
Completed sessions | 5366
| |||||
Total time | 1394560 seconds
| |||||
Average session time | 259 seconds
| |||||
| State name | % of total | Count | Errors | Minimum Time | Maximum Time | Average Time |
|---|---|---|---|---|---|---|
Home | 4 % | 558 | 0 | 0 ms | 93043 ms | 239 ms
|
Register | 1 % | 159 | 0 | 0 ms | 199055 ms | 1895 ms
|
RegisterUser | 1 % | 140 | 4 | 5 ms | 199057 ms | 5804 ms
|
Browse | 7 % | 965 | 0 | 0 ms | 190024 ms | 1333 ms
|
BrowseCategories | 4 % | 645 | 0 | 3 ms | 199059 ms | 2396 ms
|
SearchItemsInCategory | 15 % | 2090 | 0 | 3 ms | 199063 ms | 1753 ms
|
BrowseRegions | 2 % | 289 | 0 | 3 ms | 45011 ms | 342 ms
|
BrowseCategoriesInRegion | 2 % | 282 | 0 | 3 ms | 190218 ms | 1639 ms
|
SearchItemsInRegion | 4 % | 661 | 0 | 0 ms | 199049 ms | 3059 ms
|
ViewItem | 13 % | 1849 | 0 | 3 ms | 199059 ms | 2302 ms
|
ViewUserInfo | 3 % | 446 | 0 | 3 ms | 190047 ms | 2034 ms
|
ViewBidHistory | 1 % | 216 | 0 | 4 ms | 93102 ms | 1442 ms
|
BuyNowAuth | 1 % | 195 | 0 | 2 ms | 45003 ms | 507 ms
|
BuyNow | 1 % | 201 | 24 | 5 ms | 190047 ms | 2732 ms
|
StoreBuyBow | 1 % | 142 | 0 | 5 ms | 190050 ms | 2964 ms
|
PutBidAuth | 5 % | 680 | 0 | 0 ms | 199058 ms | 1959 ms
|
PutBid | 5 % | 743 | 91 | 4 ms | 190090 ms | 1321 ms
|
StoreBid | 3 % | 519 | 0 | 4 ms | 190057 ms | 1380 ms
|
PutCommentAuth | 0 % | 0 | 0 | 0 ms | 0 ms | 0 ms
|
PutComment | 0 % | 83 | 9 | 4 ms | 3183 ms | 56 ms
|
StoreComment | 0 % | 70 | 0 | 5 ms | 3978 ms | 114 ms
|
Sell | 0 % | 56 | 0 | 0 ms | 3379 ms | 272 ms
|
SelectCategoryToSellItem | 0 % | 65 | 0 | 4 ms | 44999 ms | 1033 ms
|
SellItemForm | 0 % | 72 | 0 | 2 ms | 3396 ms | 115 ms
|
RegisterItem | 0 % | 70 | 0 | 5 ms | 9015 ms | 168 ms
|
AboutMe (auth form) | 1 % | 207 | 0 | 0 ms | 10240 ms | 370 ms
|
AboutMe | 2 % | 384 | 0 | 5 ms | 190126 ms | 1776 ms
|
Back probability | 10 % | 1361 | 0 | 0 ms | 0 ms | 0 ms
|
End of Session | 1 % | 206 | 0 | 0 ms | 0 ms | 0 ms
|
Total | 100 % | 13354 | 128 | - | - | 1541 ms
|
Average throughput | 449 req/s
| |||||
Completed sessions | 183
| |||||
Total time | 66490 seconds
| |||||
Average session time | 363 seconds
| |||||
| State name | % of total | Count | Errors | Minimum Time | Maximum Time | Average Time |
|---|---|---|---|---|---|---|
Home | 5 % | 24720 | 0 | 0 ms | 190842 ms | 2340 ms
|
Register | 1 % | 5124 | 0 | 0 ms | 199055 ms | 1080 ms
|
RegisterUser | 1 % | 4979 | 125 | 5 ms | 199057 ms | 1305 ms
|
Browse | 7 % | 35672 | 0 | 0 ms | 196935 ms | 1255 ms
|
BrowseCategories | 5 % | 24599 | 0 | 3 ms | 199059 ms | 1077 ms
|
SearchItemsInCategory | 15 % | 72973 | 0 | 3 ms | 199928 ms | 928 ms
|
BrowseRegions | 2 % | 10194 | 0 | 3 ms | 190121 ms | 993 ms
|
BrowseCategoriesInRegion | 2 % | 9905 | 0 | 3 ms | 212528 ms | 990 ms
|
SearchItemsInRegion | 5 % | 24345 | 0 | 0 ms | 212562 ms | 985 ms
|
ViewItem | 13 % | 65719 | 0 | 3 ms | 200584 ms | 899 ms
|
ViewUserInfo | 3 % | 14826 | 0 | 3 ms | 283817 ms | 886 ms
|
ViewBidHistory | 1 % | 7709 | 0 | 3 ms | 191228 ms | 1101 ms
|
BuyNowAuth | 1 % | 6017 | 0 | 2 ms | 191459 ms | 936 ms
|
BuyNow | 1 % | 5840 | 808 | 3 ms | 212589 ms | 1007 ms
|
StoreBuyBow | 1 % | 4841 | 6 | 4 ms | 190055 ms | 880 ms
|
PutBidAuth | 4 % | 23168 | 0 | 0 ms | 284289 ms | 796 ms
|
PutBid | 5 % | 26253 | 2989 | 4 ms | 194478 ms | 852 ms
|
StoreBid | 3 % | 17012 | 13 | 4 ms | 194023 ms | 804 ms
|
PutCommentAuth | 0 % | 0 | 0 | 0 ms | 0 ms | 0 ms
|
PutComment | 0 % | 2251 | 176 | 4 ms | 190078 ms | 793 ms
|
StoreComment | 0 % | 2008 | 0 | 5 ms | 47160 ms | 669 ms
|
Sell | 0 % | 2737 | 0 | 0 ms | 189994 ms | 1192 ms
|
SelectCategoryToSellItem | 0 % | 2662 | 0 | 3 ms | 190010 ms | 950 ms
|
SellItemForm | 0 % | 2586 | 0 | 2 ms | 94579 ms | 936 ms
|
RegisterItem | 0 % | 2521 | 0 | 4 ms | 190854 ms | 1068 ms
|
AboutMe (auth form) | 1 % | 8262 | 0 | 0 ms | 194178 ms | 1073 ms
|
AboutMe | 2 % | 13519 | 0 | 4 ms | 190221 ms | 1021 ms
|
Back probability | 10 % | 47690 | 0 | 0 ms | 0 ms | 0 ms
|
End of Session | 1 % | 6543 | 0 | 0 ms | 0 ms | 0 ms
|
Total | 100 % | 474675 | 4117 | - | - | 920 ms
|
Average throughput | 797 req/s
| |||||
Completed sessions | 6543
| |||||
Total time | 1553882 seconds
| |||||
Average session time | 237 seconds
| |||||
An error occured while waiting for remote processes termination (Skipping waits)
Command is: /usr/bin/scp farm6.csail.mit.edu:/tmp/client1 /home/drkp/sandbox/txcache/src/RUBiS-1.4.3/bench/2009-3-19@21:50:22//client1.bin
Command is: /usr/bin/ssh -x localhost /bin/bash -c 'LANG=en_GB.UTF-8 /usr/bin/sar -n DEV -n SOCK -rubcw 1 605 -f /home/drkp/sandbox/txcache/src/RUBiS-1.4.3/bench/2009-3-19@21:50:22//client1.bin > /home/drkp/sandbox/txcache/src/RUBiS-1.4.3/bench/2009-3-19@21:50:22//client1'
Command is: /usr/bin/scp farm14:/tmp/db_server0 /home/drkp/sandbox/txcache/src/RUBiS-1.4.3/bench/2009-3-19@21:50:22//db_server0.bin
Command is: /usr/bin/ssh -x localhost /bin/bash -c 'LANG=en_GB.UTF-8 /usr/bin/sar -n DEV -n SOCK -rubcw 1 605 -f /home/drkp/sandbox/txcache/src/RUBiS-1.4.3/bench/2009-3-19@21:50:22//db_server0.bin > /home/drkp/sandbox/txcache/src/RUBiS-1.4.3/bench/2009-3-19@21:50:22//db_server0'
Command is: /usr/bin/scp farm12.csail.mit.edu:/tmp/web_server0 /home/drkp/sandbox/txcache/src/RUBiS-1.4.3/bench/2009-3-19@21:50:22//web_server0.bin
Command is: /usr/bin/ssh -x localhost /bin/bash -c 'LANG=en_GB.UTF-8 /usr/bin/sar -n DEV -n SOCK -rubcw 1 605 -f /home/drkp/sandbox/txcache/src/RUBiS-1.4.3/bench/2009-3-19@21:50:22//web_server0.bin > /home/drkp/sandbox/txcache/src/RUBiS-1.4.3/bench/2009-3-19@21:50:22//web_server0'
Command is: /usr/bin/scp farm13.csail.mit.edu:/tmp/web_server1 /home/drkp/sandbox/txcache/src/RUBiS-1.4.3/bench/2009-3-19@21:50:22//web_server1.bin
Command is: /usr/bin/ssh -x localhost /bin/bash -c 'LANG=en_GB.UTF-8 /usr/bin/sar -n DEV -n SOCK -rubcw 1 605 -f /home/drkp/sandbox/txcache/src/RUBiS-1.4.3/bench/2009-3-19@21:50:22//web_server1.bin > /home/drkp/sandbox/txcache/src/RUBiS-1.4.3/bench/2009-3-19@21:50:22//web_server1'
Command is: /usr/bin/scp localhost:/tmp/client0 /home/drkp/sandbox/txcache/src/RUBiS-1.4.3/bench/2009-3-19@21:50:22//client0.bin
Command is: /usr/bin/ssh -x localhost /bin/bash -c 'LANG=en_GB.UTF-8 /usr/bin/sar -n DEV -n SOCK -rubcw 1 605 -f /home/drkp/sandbox/txcache/src/RUBiS-1.4.3/bench/2009-3-19@21:50:22//client0.bin > /home/drkp/sandbox/txcache/src/RUBiS-1.4.3/bench/2009-3-19@21:50:22//client0'
Command is: /usr/bin/scp farm6.csail.mit.edu:/tmp/trace_client1.html /home/drkp/sandbox/txcache/src/RUBiS-1.4.3/bench/2009-3-19@21:50:22//
Command is: /usr/bin/scp farm6.csail.mit.edu:/tmp/stat_client1.html /home/drkp/sandbox/txcache/src/RUBiS-1.4.3/bench/2009-3-19@21:50:22//
|
|
|
|
|
|
 | 
|
 | 
|
 | 
|
 | 
|
 | 
|
 | 
|
 | 
|
 | 
|
 | 
|