Node information
Test timing information
Up ramp statistics
Runtime session statistics
Down ramp statistics
Overall statistics
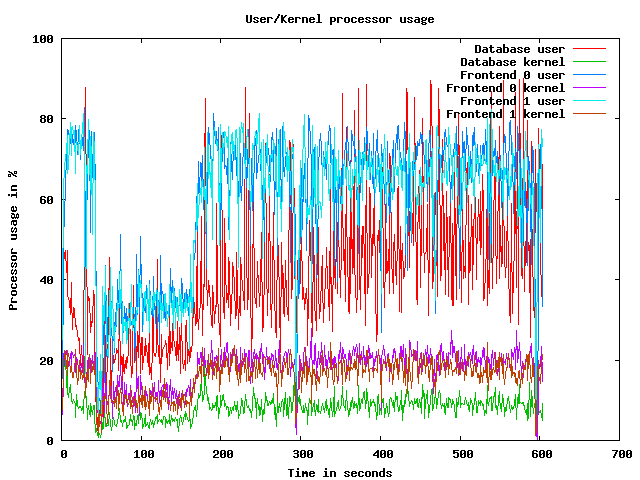
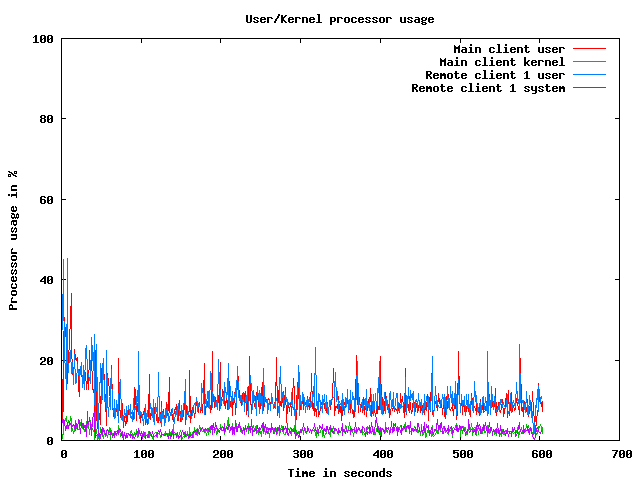
CPU usage graphs
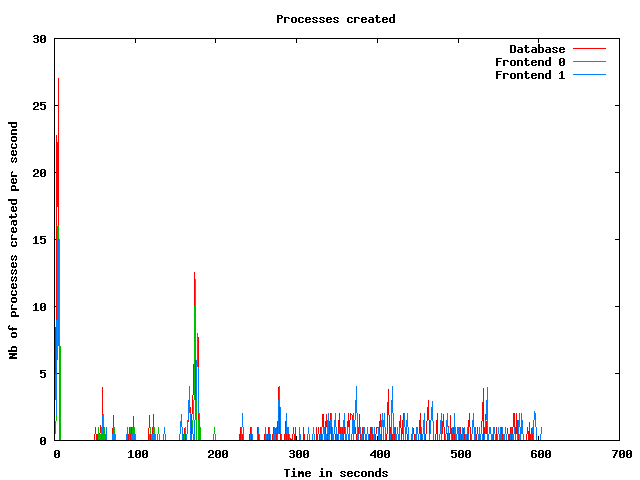
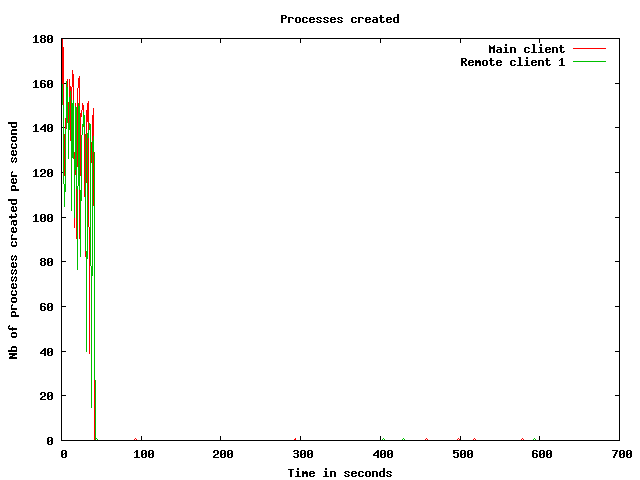
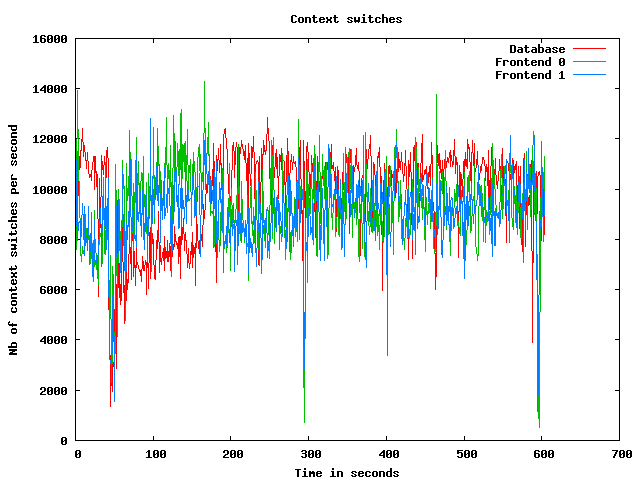
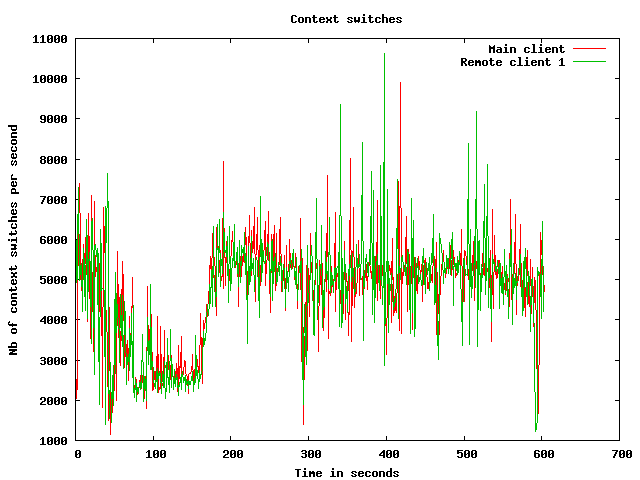
Processes usage graphs
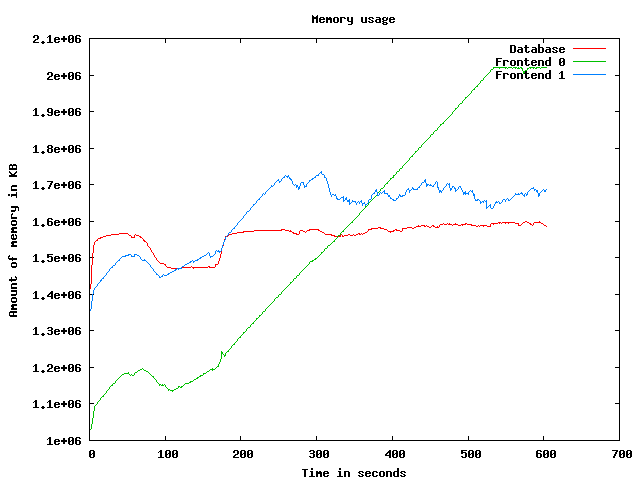
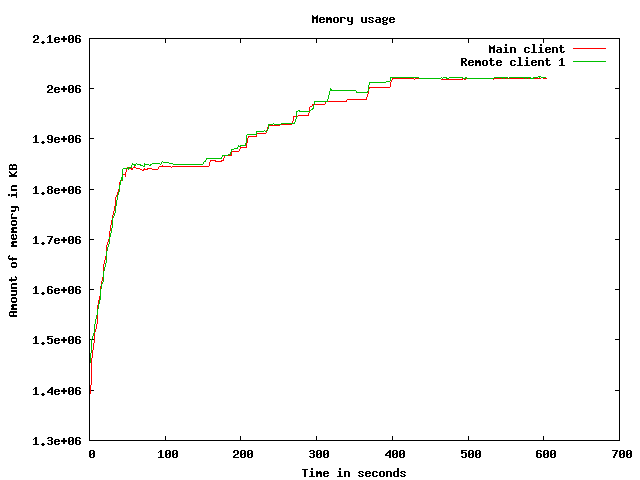
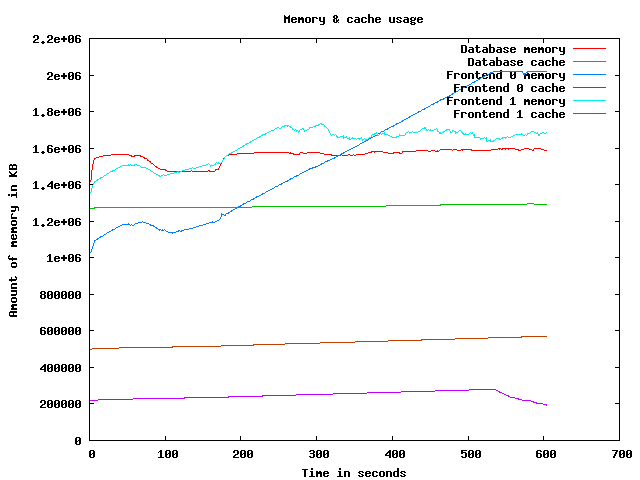
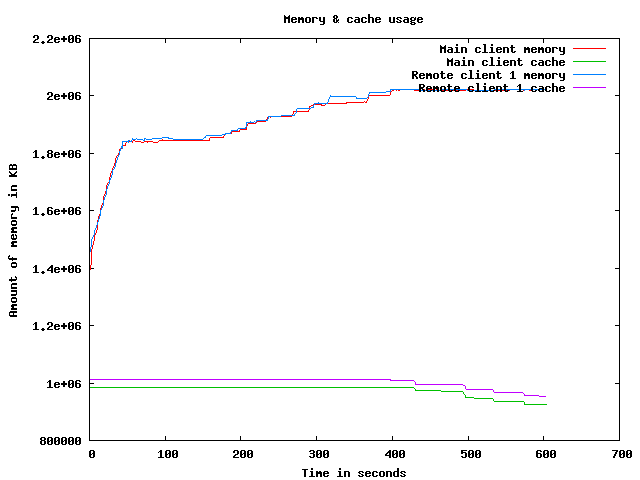
Memory usage graph
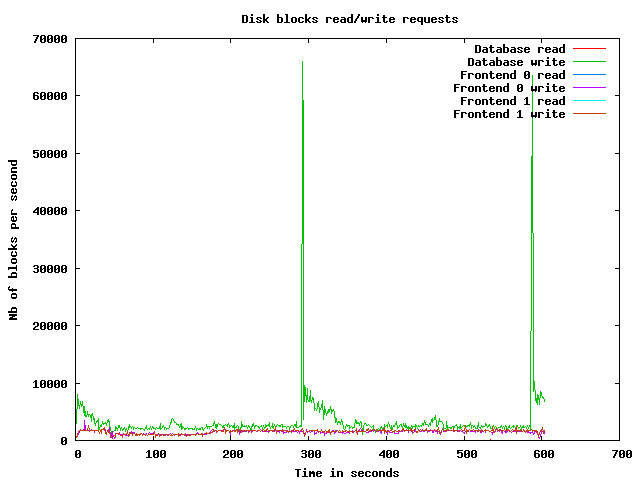
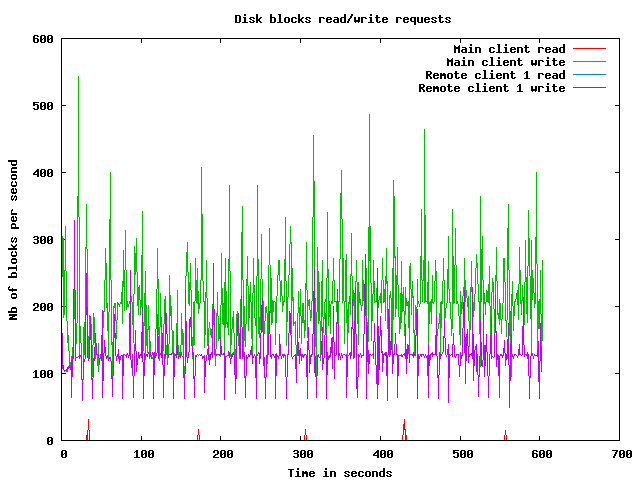
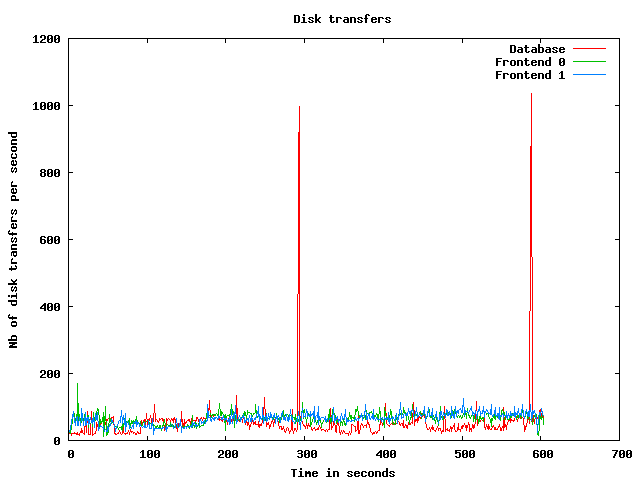
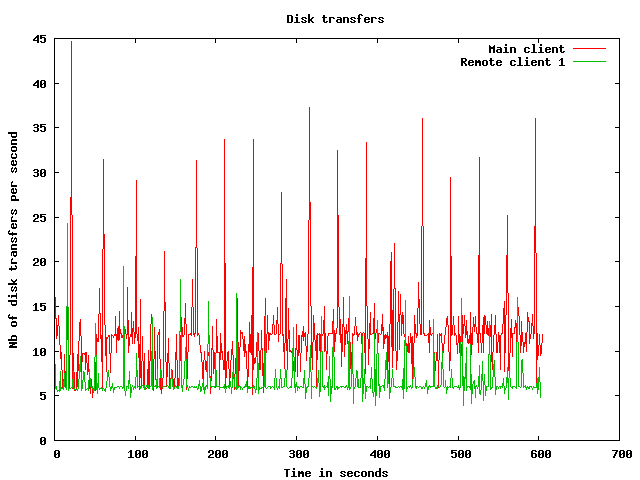
Disk usage graphs
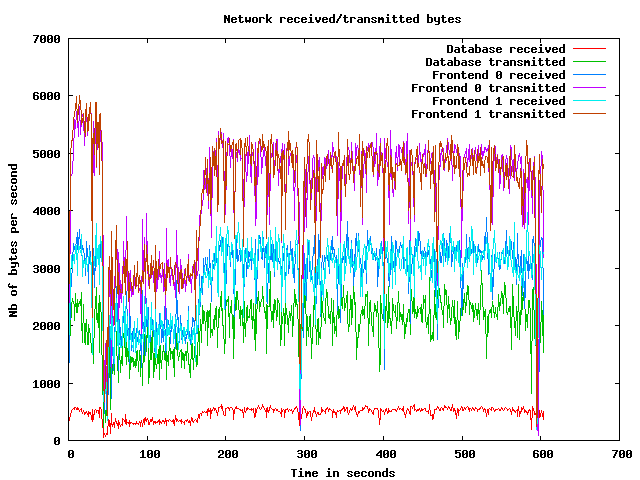
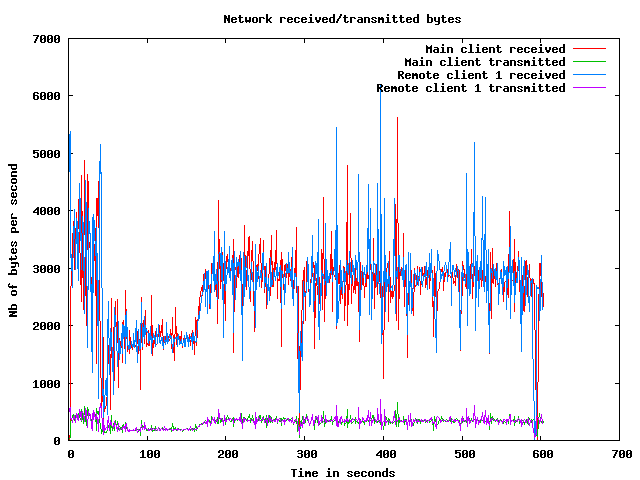
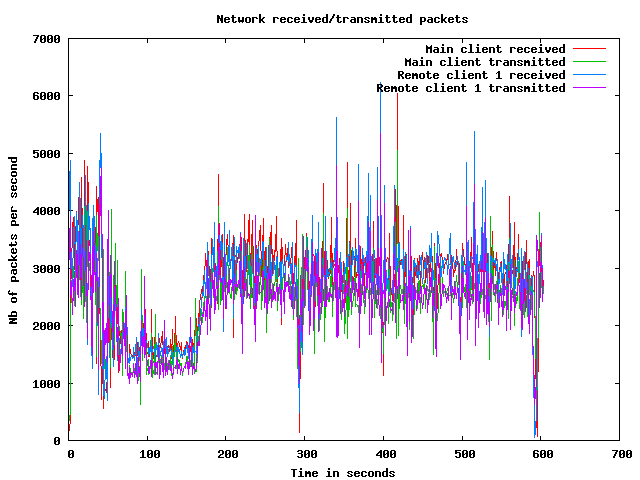
Network usage graphs
| Test start | 2009-3-19 22:4:14 |
| Up ramp start | 2009-3-19 22:4:57 |
| Runtime session start | 2009-3-19 22:6:57 |
| Down ramp start | 2009-3-19 22:14:27 |
| Test end | 2009-3-19 22:17:18 |
| Up ramp length | 2 minutes 0 millisecond (requested 120000 ms) |
| Runtime session length | 7 minutes 30 seconds 0 millisecond (requested 450000 ms) |
| Down ramp length | 30 seconds 1 millisecond (requested 30000 ms) |
| Total test length | 13 minutes 4 seconds 123 milliseconds |
| State name | % of total | Count | Errors | Minimum Time | Maximum Time | Average Time |
|---|---|---|---|---|---|---|
Home | 9 % | 9164 | 0 | 0 ms | 93130 ms | 7795 ms
|
Register | 1 % | 1351 | 0 | 0 ms | 93035 ms | 2920 ms
|
RegisterUser | 1 % | 1280 | 48 | 5 ms | 93125 ms | 2160 ms
|
Browse | 9 % | 9556 | 0 | 0 ms | 93122 ms | 3170 ms
|
BrowseCategories | 6 % | 6287 | 0 | 3 ms | 93116 ms | 2213 ms
|
SearchItemsInCategory | 14 % | 14563 | 0 | 3 ms | 93363 ms | 1947 ms
|
BrowseRegions | 2 % | 2703 | 0 | 3 ms | 93009 ms | 2292 ms
|
BrowseCategoriesInRegion | 2 % | 2518 | 0 | 3 ms | 93069 ms | 2195 ms
|
SearchItemsInRegion | 5 % | 5010 | 0 | 0 ms | 93359 ms | 2038 ms
|
ViewItem | 12 % | 12406 | 0 | 3 ms | 93131 ms | 1578 ms
|
ViewUserInfo | 2 % | 2405 | 0 | 3 ms | 93022 ms | 1548 ms
|
ViewBidHistory | 1 % | 1293 | 0 | 3 ms | 93290 ms | 1582 ms
|
BuyNowAuth | 1 % | 1098 | 0 | 2 ms | 93152 ms | 1359 ms
|
BuyNow | 0 % | 979 | 118 | 4 ms | 93114 ms | 1396 ms
|
StoreBuyBow | 0 % | 740 | 0 | 4 ms | 93030 ms | 1474 ms
|
PutBidAuth | 4 % | 4310 | 0 | 0 ms | 93027 ms | 1606 ms
|
PutBid | 4 % | 4326 | 486 | 4 ms | 93139 ms | 1629 ms
|
StoreBid | 2 % | 2560 | 1 | 5 ms | 93065 ms | 1510 ms
|
PutCommentAuth | 0 % | 0 | 0 | 0 ms | 0 ms | 0 ms
|
PutComment | 0 % | 348 | 26 | 4 ms | 59104 ms | 1931 ms
|
StoreComment | 0 % | 288 | 0 | 5 ms | 46523 ms | 852 ms
|
Sell | 0 % | 702 | 0 | 0 ms | 92996 ms | 2308 ms
|
SelectCategoryToSellItem | 0 % | 636 | 0 | 4 ms | 93019 ms | 1622 ms
|
SellItemForm | 0 % | 587 | 0 | 2 ms | 92998 ms | 1747 ms
|
RegisterItem | 0 % | 546 | 0 | 4 ms | 46449 ms | 2050 ms
|
AboutMe (auth form) | 2 % | 2116 | 0 | 0 ms | 93291 ms | 2734 ms
|
AboutMe | 2 % | 2909 | 0 | 4 ms | 93137 ms | 2456 ms
|
Back probability | 7 % | 7942 | 0 | 0 ms | 0 ms | 0 ms
|
End of Session | 1 % | 1044 | 0 | 0 ms | 0 ms | 0 ms
|
Total | 100 % | 99667 | 679 | - | - | 2376 ms
|
Average throughput | 836 req/s
| |||||
Completed sessions | 931
| |||||
Total time | 53420 seconds
| |||||
Average session time | 57 seconds
| |||||
| State name | % of total | Count | Errors | Minimum Time | Maximum Time | Average Time |
|---|---|---|---|---|---|---|
Home | 4 % | 14454 | 0 | 0 ms | 249126 ms | 704 ms
|
Register | 1 % | 3604 | 0 | 0 ms | 217829 ms | 1925 ms
|
RegisterUser | 1 % | 3510 | 125 | 4 ms | 236689 ms | 1694 ms
|
Browse | 7 % | 24142 | 0 | 0 ms | 322927 ms | 1611 ms
|
BrowseCategories | 4 % | 16653 | 0 | 3 ms | 311047 ms | 1610 ms
|
SearchItemsInCategory | 15 % | 52818 | 0 | 3 ms | 380060 ms | 1581 ms
|
BrowseRegions | 2 % | 7201 | 0 | 3 ms | 312302 ms | 1639 ms
|
BrowseCategoriesInRegion | 2 % | 7087 | 0 | 3 ms | 289905 ms | 1918 ms
|
SearchItemsInRegion | 5 % | 18288 | 0 | 0 ms | 347439 ms | 1523 ms
|
ViewItem | 14 % | 48876 | 0 | 3 ms | 399029 ms | 1650 ms
|
ViewUserInfo | 3 % | 11399 | 0 | 3 ms | 312344 ms | 1516 ms
|
ViewBidHistory | 1 % | 6068 | 0 | 4 ms | 312426 ms | 2189 ms
|
BuyNowAuth | 1 % | 4594 | 0 | 2 ms | 215390 ms | 1351 ms
|
BuyNow | 1 % | 4532 | 607 | 5 ms | 267154 ms | 2077 ms
|
StoreBuyBow | 1 % | 3844 | 4 | 5 ms | 348193 ms | 1659 ms
|
PutBidAuth | 4 % | 17139 | 0 | 0 ms | 395481 ms | 1694 ms
|
PutBid | 5 % | 19966 | 2117 | 4 ms | 237953 ms | 1696 ms
|
StoreBid | 3 % | 13127 | 18 | 5 ms | 249129 ms | 1515 ms
|
PutCommentAuth | 0 % | 0 | 0 | 0 ms | 0 ms | 0 ms
|
PutComment | 0 % | 1725 | 119 | 4 ms | 190046 ms | 1190 ms
|
StoreComment | 0 % | 1583 | 0 | 5 ms | 190096 ms | 1356 ms
|
Sell | 0 % | 1836 | 0 | 0 ms | 284116 ms | 2132 ms
|
SelectCategoryToSellItem | 0 % | 1820 | 0 | 4 ms | 190073 ms | 1330 ms
|
SellItemForm | 0 % | 1776 | 0 | 2 ms | 212305 ms | 1579 ms
|
RegisterItem | 0 % | 1734 | 0 | 5 ms | 236196 ms | 1685 ms
|
AboutMe (auth form) | 1 % | 5722 | 0 | 0 ms | 236130 ms | 1429 ms
|
AboutMe | 2 % | 9624 | 0 | 4 ms | 335379 ms | 1639 ms
|
Back probability | 10 % | 36529 | 0 | 0 ms | 0 ms | 0 ms
|
End of Session | 1 % | 5132 | 0 | 0 ms | 0 ms | 0 ms
|
Total | 100 % | 344783 | 2990 | - | - | 1385 ms
|
Average throughput | 772 req/s
| |||||
Completed sessions | 5167
| |||||
Total time | 1390920 seconds
| |||||
Average session time | 269 seconds
| |||||
| State name | % of total | Count | Errors | Minimum Time | Maximum Time | Average Time |
|---|---|---|---|---|---|---|
Home | 4 % | 509 | 0 | 0 ms | 93020 ms | 1721 ms
|
Register | 0 % | 118 | 0 | 0 ms | 190584 ms | 7722 ms
|
RegisterUser | 0 % | 120 | 4 | 5 ms | 46154 ms | 3963 ms
|
Browse | 7 % | 878 | 0 | 0 ms | 380050 ms | 6907 ms
|
BrowseCategories | 4 % | 612 | 0 | 3 ms | 211629 ms | 4557 ms
|
SearchItemsInCategory | 15 % | 1877 | 0 | 3 ms | 311486 ms | 5417 ms
|
BrowseRegions | 2 % | 256 | 0 | 3 ms | 190020 ms | 4543 ms
|
BrowseCategoriesInRegion | 2 % | 250 | 0 | 3 ms | 190039 ms | 4193 ms
|
SearchItemsInRegion | 4 % | 620 | 0 | 0 ms | 311466 ms | 5929 ms
|
ViewItem | 14 % | 1778 | 0 | 3 ms | 417723 ms | 5962 ms
|
ViewUserInfo | 3 % | 417 | 0 | 3 ms | 190076 ms | 4180 ms
|
ViewBidHistory | 1 % | 209 | 0 | 3 ms | 380079 ms | 4825 ms
|
BuyNowAuth | 1 % | 179 | 0 | 2 ms | 190053 ms | 4335 ms
|
BuyNow | 1 % | 172 | 22 | 5 ms | 190054 ms | 6650 ms
|
StoreBuyBow | 1 % | 155 | 0 | 5 ms | 211617 ms | 7676 ms
|
PutBidAuth | 5 % | 626 | 0 | 0 ms | 190016 ms | 3094 ms
|
PutBid | 5 % | 724 | 85 | 4 ms | 379999 ms | 5125 ms
|
StoreBid | 3 % | 472 | 0 | 5 ms | 417720 ms | 5468 ms
|
PutCommentAuth | 0 % | 0 | 0 | 0 ms | 0 ms | 0 ms
|
PutComment | 0 % | 82 | 8 | 4 ms | 311485 ms | 7813 ms
|
StoreComment | 0 % | 62 | 0 | 4 ms | 190009 ms | 4160 ms
|
Sell | 0 % | 53 | 0 | 0 ms | 190022 ms | 11317 ms
|
SelectCategoryToSellItem | 0 % | 53 | 0 | 3 ms | 190627 ms | 10216 ms
|
SellItemForm | 0 % | 61 | 0 | 2 ms | 190007 ms | 7067 ms
|
RegisterItem | 0 % | 61 | 0 | 4 ms | 211263 ms | 7308 ms
|
AboutMe (auth form) | 1 % | 217 | 0 | 0 ms | 190040 ms | 4068 ms
|
AboutMe | 2 % | 352 | 0 | 4 ms | 190050 ms | 3725 ms
|
Back probability | 10 % | 1339 | 0 | 0 ms | 0 ms | 0 ms
|
End of Session | 1 % | 163 | 0 | 0 ms | 0 ms | 0 ms
|
Total | 100 % | 12415 | 119 | - | - | 4545 ms
|
Average throughput | 417 req/s
| |||||
Completed sessions | 162
| |||||
Total time | 59348 seconds
| |||||
Average session time | 366 seconds
| |||||
| State name | % of total | Count | Errors | Minimum Time | Maximum Time | Average Time |
|---|---|---|---|---|---|---|
Home | 5 % | 24136 | 0 | 0 ms | 283357 ms | 3491 ms
|
Register | 1 % | 5087 | 0 | 0 ms | 283340 ms | 2527 ms
|
RegisterUser | 1 % | 4920 | 179 | 4 ms | 283334 ms | 2128 ms
|
Browse | 7 % | 34632 | 0 | 0 ms | 380050 ms | 2431 ms
|
BrowseCategories | 5 % | 23601 | 0 | 3 ms | 460088 ms | 2141 ms
|
SearchItemsInCategory | 15 % | 69653 | 0 | 3 ms | 389460 ms | 2033 ms
|
BrowseRegions | 2 % | 10176 | 0 | 3 ms | 312302 ms | 2104 ms
|
BrowseCategoriesInRegion | 2 % | 9870 | 0 | 3 ms | 289905 ms | 2330 ms
|
SearchItemsInRegion | 5 % | 24039 | 0 | 0 ms | 389529 ms | 2066 ms
|
ViewItem | 13 % | 63329 | 0 | 3 ms | 488481 ms | 2022 ms
|
ViewUserInfo | 3 % | 14288 | 0 | 3 ms | 380033 ms | 1958 ms
|
ViewBidHistory | 1 % | 7608 | 0 | 3 ms | 380079 ms | 2297 ms
|
BuyNowAuth | 1 % | 5888 | 0 | 2 ms | 215390 ms | 1611 ms
|
BuyNow | 1 % | 5693 | 747 | 4 ms | 267154 ms | 2263 ms
|
StoreBuyBow | 1 % | 4750 | 4 | 4 ms | 348193 ms | 2160 ms
|
PutBidAuth | 4 % | 22126 | 0 | 0 ms | 395481 ms | 2016 ms
|
PutBid | 5 % | 25139 | 2695 | 4 ms | 379999 ms | 2143 ms
|
StoreBid | 3 % | 16201 | 19 | 5 ms | 417720 ms | 1941 ms
|
PutCommentAuth | 0 % | 0 | 0 | 0 ms | 0 ms | 0 ms
|
PutComment | 0 % | 2163 | 153 | 4 ms | 311485 ms | 1776 ms
|
StoreComment | 0 % | 1937 | 0 | 4 ms | 190096 ms | 1514 ms
|
Sell | 0 % | 2594 | 0 | 0 ms | 284116 ms | 2784 ms
|
SelectCategoryToSellItem | 0 % | 2517 | 0 | 3 ms | 190627 ms | 1866 ms
|
SellItemForm | 0 % | 2431 | 0 | 2 ms | 212305 ms | 2180 ms
|
RegisterItem | 0 % | 2348 | 0 | 4 ms | 236196 ms | 2231 ms
|
AboutMe (auth form) | 1 % | 8067 | 0 | 0 ms | 236130 ms | 2116 ms
|
AboutMe | 2 % | 12991 | 0 | 4 ms | 389612 ms | 2184 ms
|
Back probability | 10 % | 45900 | 0 | 0 ms | 0 ms | 0 ms
|
End of Session | 1 % | 6350 | 0 | 0 ms | 0 ms | 0 ms
|
Total | 100 % | 458434 | 3797 | - | - | 1923 ms
|
Average throughput | 770 req/s
| |||||
Completed sessions | 6350
| |||||
Total time | 1544056 seconds
| |||||
Average session time | 243 seconds
| |||||
An error occured while waiting for remote processes termination (Skipping waits)
Command is: /usr/bin/scp farm6.csail.mit.edu:/tmp/client1 /home/drkp/sandbox/txcache/src/RUBiS-1.4.3/bench/2009-3-19@22:4:14//client1.bin
Command is: /usr/bin/ssh -x localhost /bin/bash -c 'LANG=en_GB.UTF-8 /usr/bin/sar -n DEV -n SOCK -rubcw 1 605 -f /home/drkp/sandbox/txcache/src/RUBiS-1.4.3/bench/2009-3-19@22:4:14//client1.bin > /home/drkp/sandbox/txcache/src/RUBiS-1.4.3/bench/2009-3-19@22:4:14//client1'
Command is: /usr/bin/scp farm14:/tmp/db_server0 /home/drkp/sandbox/txcache/src/RUBiS-1.4.3/bench/2009-3-19@22:4:14//db_server0.bin
Command is: /usr/bin/ssh -x localhost /bin/bash -c 'LANG=en_GB.UTF-8 /usr/bin/sar -n DEV -n SOCK -rubcw 1 605 -f /home/drkp/sandbox/txcache/src/RUBiS-1.4.3/bench/2009-3-19@22:4:14//db_server0.bin > /home/drkp/sandbox/txcache/src/RUBiS-1.4.3/bench/2009-3-19@22:4:14//db_server0'
Command is: /usr/bin/scp farm12.csail.mit.edu:/tmp/web_server0 /home/drkp/sandbox/txcache/src/RUBiS-1.4.3/bench/2009-3-19@22:4:14//web_server0.bin
Command is: /usr/bin/ssh -x localhost /bin/bash -c 'LANG=en_GB.UTF-8 /usr/bin/sar -n DEV -n SOCK -rubcw 1 605 -f /home/drkp/sandbox/txcache/src/RUBiS-1.4.3/bench/2009-3-19@22:4:14//web_server0.bin > /home/drkp/sandbox/txcache/src/RUBiS-1.4.3/bench/2009-3-19@22:4:14//web_server0'
Command is: /usr/bin/scp farm13.csail.mit.edu:/tmp/web_server1 /home/drkp/sandbox/txcache/src/RUBiS-1.4.3/bench/2009-3-19@22:4:14//web_server1.bin
Command is: /usr/bin/ssh -x localhost /bin/bash -c 'LANG=en_GB.UTF-8 /usr/bin/sar -n DEV -n SOCK -rubcw 1 605 -f /home/drkp/sandbox/txcache/src/RUBiS-1.4.3/bench/2009-3-19@22:4:14//web_server1.bin > /home/drkp/sandbox/txcache/src/RUBiS-1.4.3/bench/2009-3-19@22:4:14//web_server1'
Command is: /usr/bin/scp localhost:/tmp/client0 /home/drkp/sandbox/txcache/src/RUBiS-1.4.3/bench/2009-3-19@22:4:14//client0.bin
Command is: /usr/bin/ssh -x localhost /bin/bash -c 'LANG=en_GB.UTF-8 /usr/bin/sar -n DEV -n SOCK -rubcw 1 605 -f /home/drkp/sandbox/txcache/src/RUBiS-1.4.3/bench/2009-3-19@22:4:14//client0.bin > /home/drkp/sandbox/txcache/src/RUBiS-1.4.3/bench/2009-3-19@22:4:14//client0'
Command is: /usr/bin/scp farm6.csail.mit.edu:/tmp/trace_client1.html /home/drkp/sandbox/txcache/src/RUBiS-1.4.3/bench/2009-3-19@22:4:14//
Command is: /usr/bin/scp farm6.csail.mit.edu:/tmp/stat_client1.html /home/drkp/sandbox/txcache/src/RUBiS-1.4.3/bench/2009-3-19@22:4:14//
|
|
|
|
|
|
 | 
|
 | 
|
 | 
|
 | 
|
 | 
|
 | 
|
 | 
|
 | 
|
 | 
|