Node information
Test timing information
Up ramp statistics
Runtime session statistics
Down ramp statistics
Overall statistics
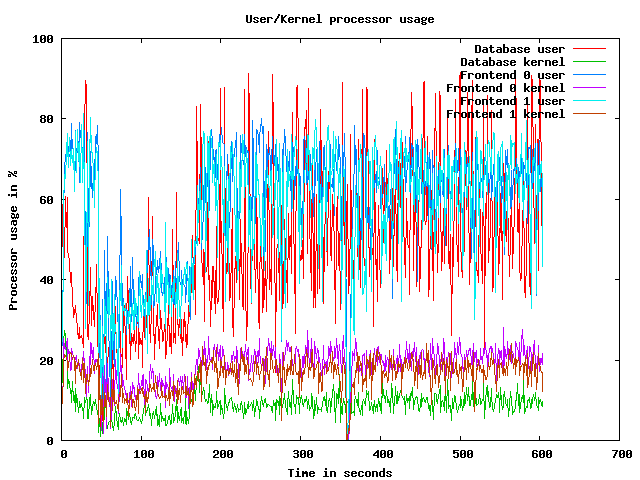
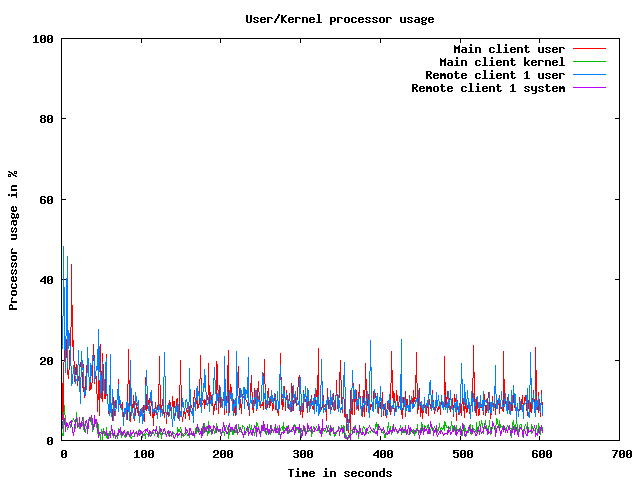
CPU usage graphs
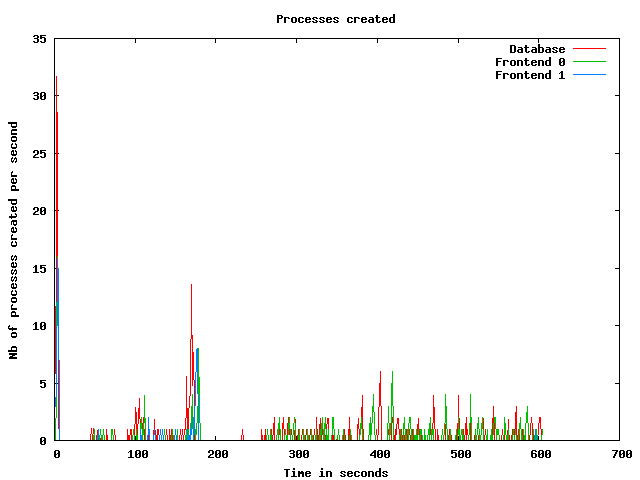
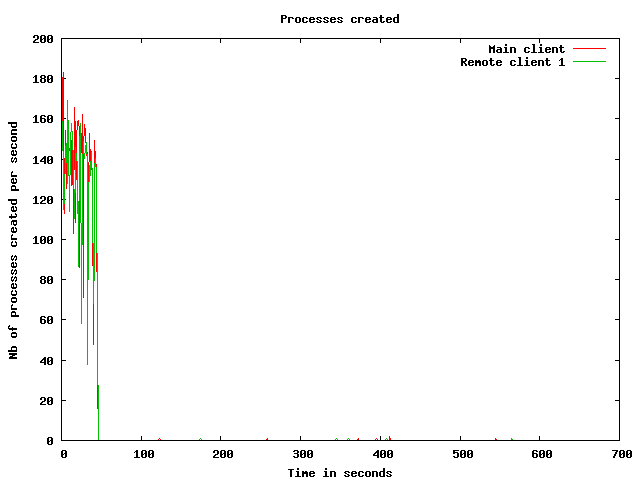
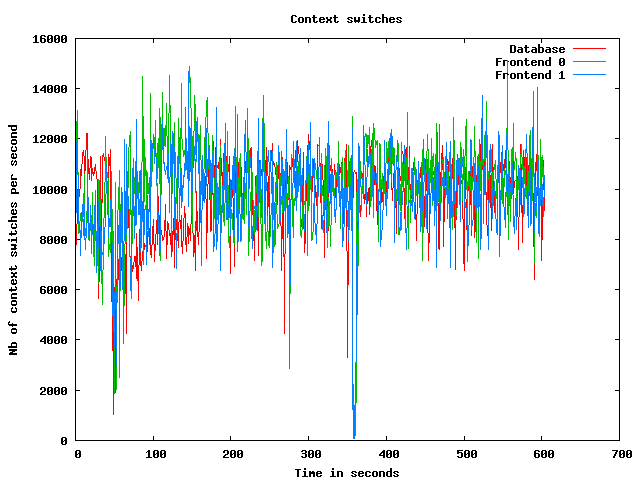
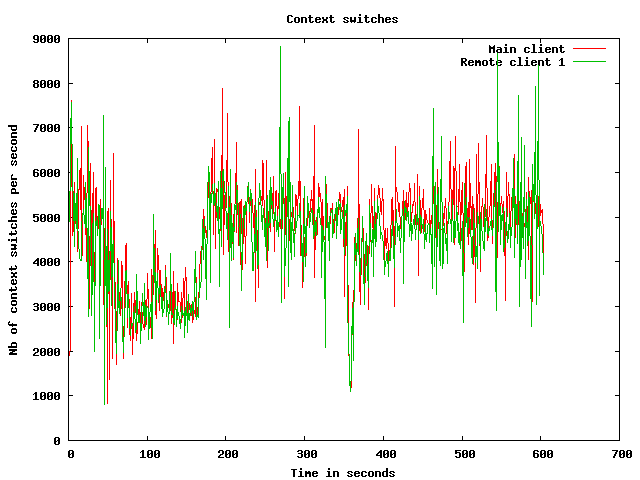
Processes usage graphs
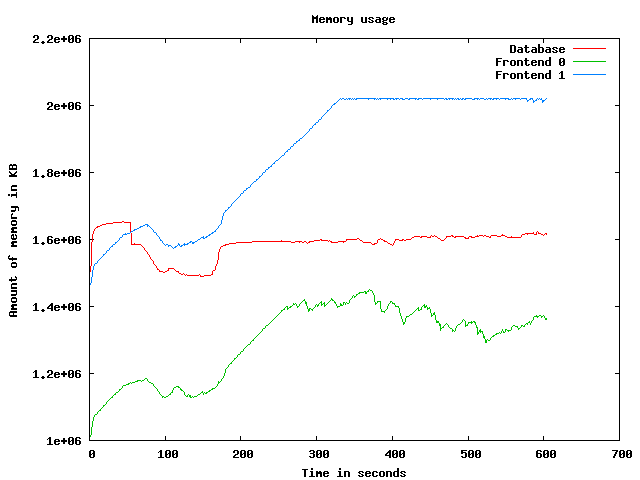
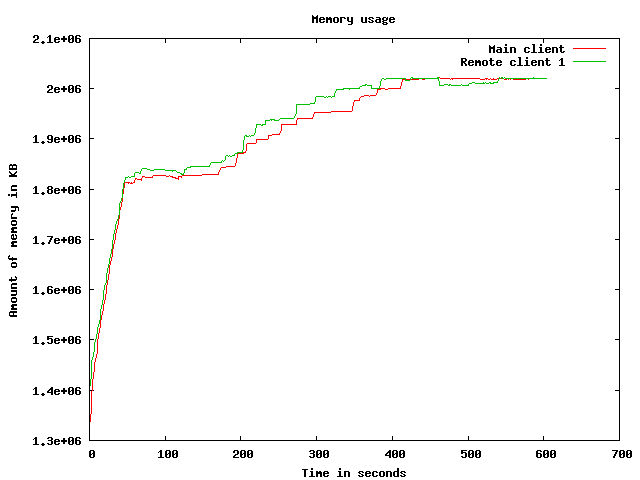
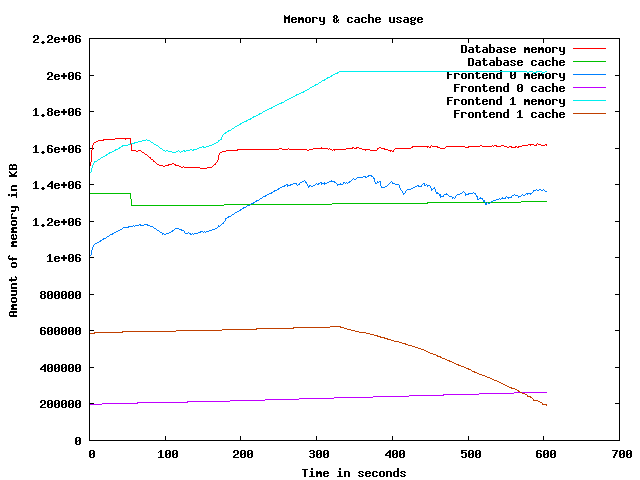
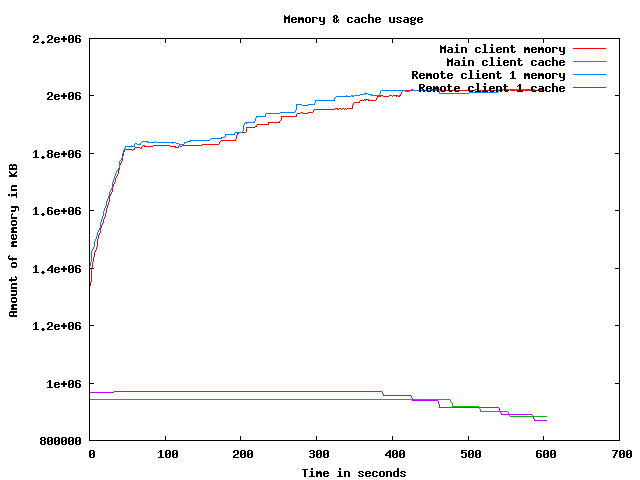
Memory usage graph
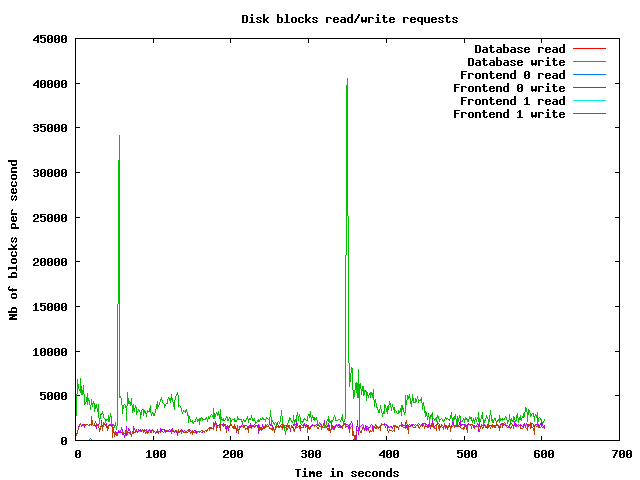
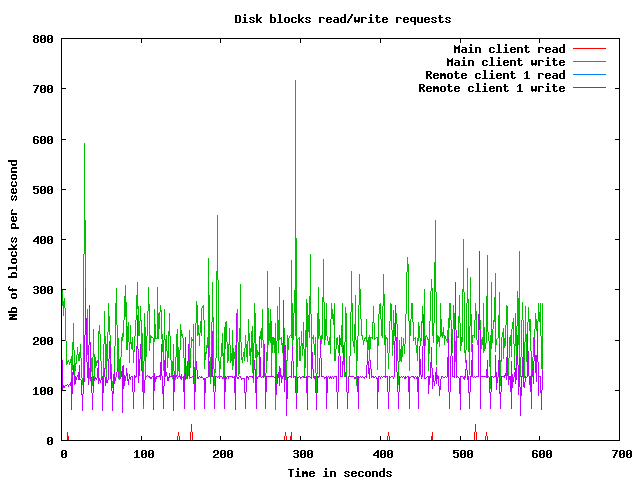
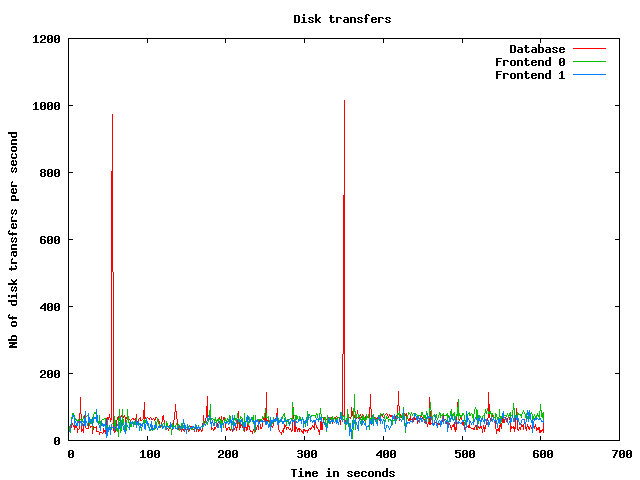
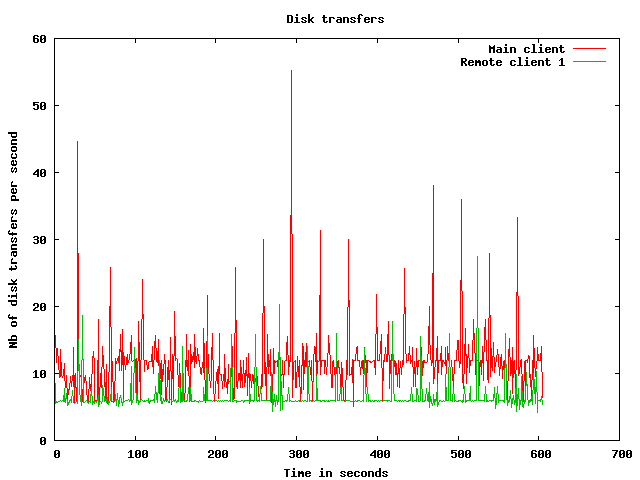
Disk usage graphs
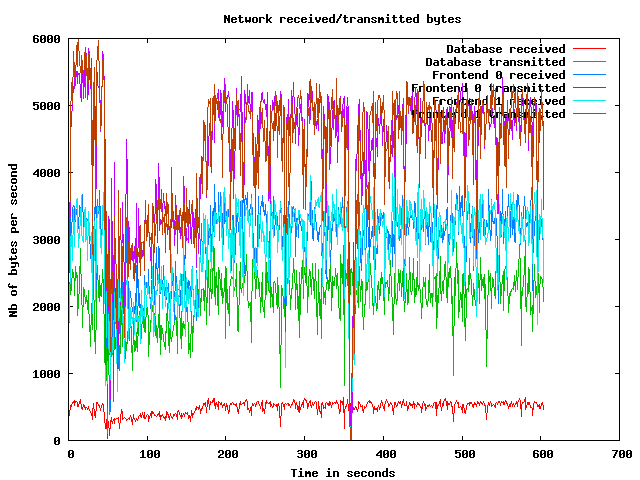
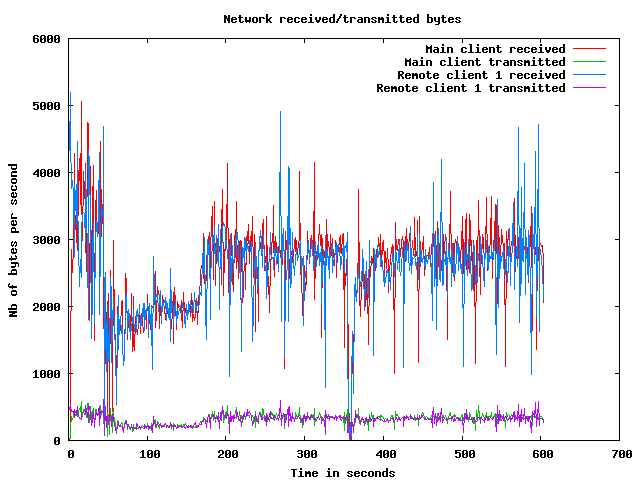
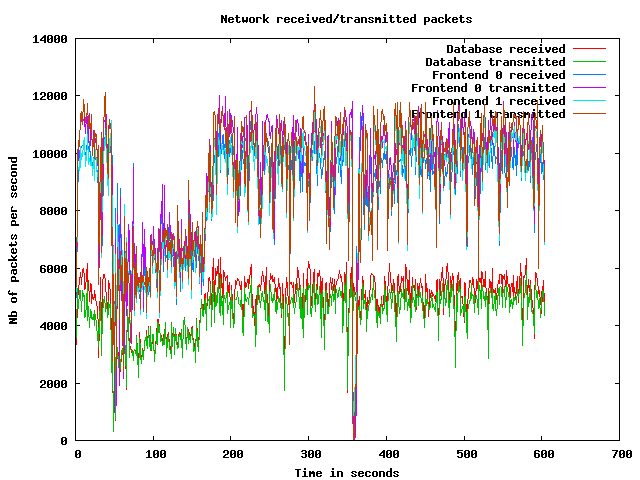
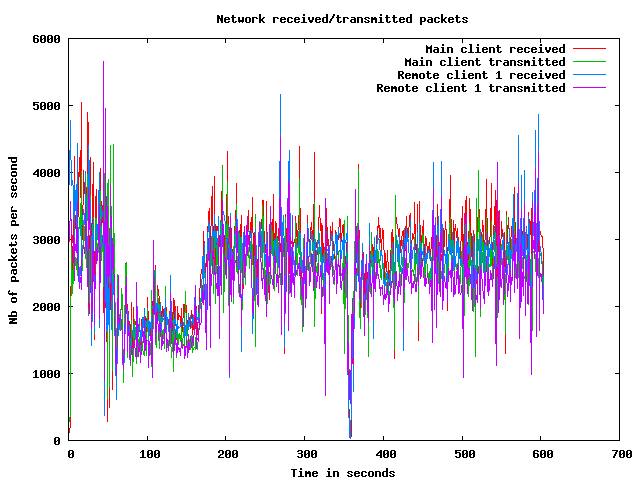
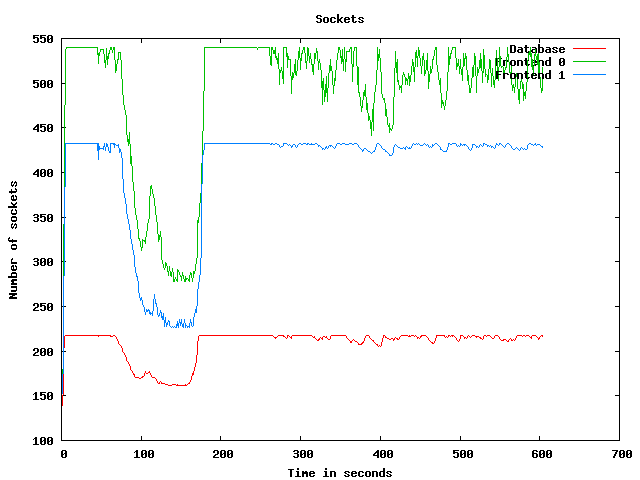
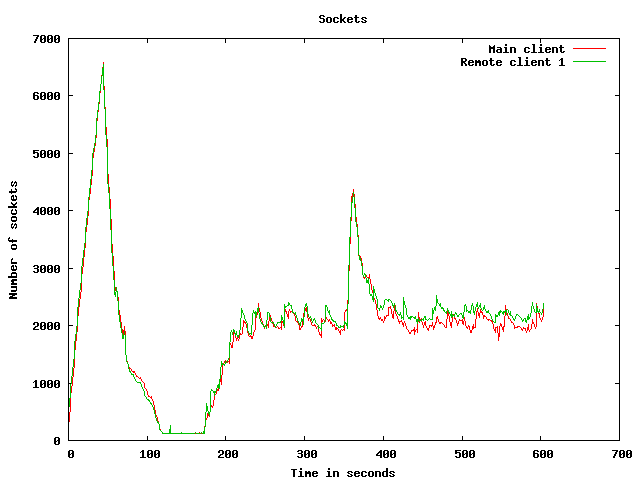
Network usage graphs
| Test start | 2009-3-19 22:18:10 |
| Up ramp start | 2009-3-19 22:18:57 |
| Runtime session start | 2009-3-19 22:20:57 |
| Down ramp start | 2009-3-19 22:28:27 |
| Test end | 2009-3-19 22:31:15 |
| Up ramp length | 2 minutes 0 millisecond (requested 120000 ms) |
| Runtime session length | 7 minutes 30 seconds 1 millisecond (requested 450000 ms) |
| Down ramp length | 30 seconds 0 millisecond (requested 30000 ms) |
| Total test length | 13 minutes 4 seconds 568 milliseconds |
| State name | % of total | Count | Errors | Minimum Time | Maximum Time | Average Time |
|---|---|---|---|---|---|---|
Home | 9 % | 9961 | 0 | 0 ms | 115463 ms | 7628 ms
|
Register | 1 % | 1402 | 0 | 0 ms | 93174 ms | 2633 ms
|
RegisterUser | 1 % | 1298 | 47 | 5 ms | 93072 ms | 2095 ms
|
Browse | 9 % | 10216 | 0 | 0 ms | 112421 ms | 3362 ms
|
BrowseCategories | 6 % | 6736 | 0 | 3 ms | 93142 ms | 2447 ms
|
SearchItemsInCategory | 14 % | 15736 | 0 | 3 ms | 93156 ms | 2252 ms
|
BrowseRegions | 2 % | 2848 | 0 | 3 ms | 115427 ms | 2519 ms
|
BrowseCategoriesInRegion | 2 % | 2644 | 0 | 3 ms | 93100 ms | 2763 ms
|
SearchItemsInRegion | 5 % | 5460 | 0 | 0 ms | 93217 ms | 2168 ms
|
ViewItem | 12 % | 13410 | 0 | 3 ms | 93219 ms | 2020 ms
|
ViewUserInfo | 2 % | 2396 | 0 | 3 ms | 93086 ms | 1717 ms
|
ViewBidHistory | 1 % | 1273 | 0 | 3 ms | 115445 ms | 1660 ms
|
BuyNowAuth | 1 % | 1143 | 0 | 2 ms | 93139 ms | 2320 ms
|
BuyNow | 0 % | 1039 | 138 | 5 ms | 93069 ms | 1668 ms
|
StoreBuyBow | 0 % | 782 | 2 | 5 ms | 93102 ms | 1751 ms
|
PutBidAuth | 4 % | 4540 | 0 | 0 ms | 93214 ms | 1844 ms
|
PutBid | 4 % | 4556 | 540 | 1 ms | 93092 ms | 1671 ms
|
StoreBid | 2 % | 2704 | 0 | 5 ms | 93145 ms | 1686 ms
|
PutCommentAuth | 0 % | 0 | 0 | 0 ms | 0 ms | 0 ms
|
PutComment | 0 % | 440 | 35 | 4 ms | 93030 ms | 1955 ms
|
StoreComment | 0 % | 364 | 0 | 5 ms | 93112 ms | 1204 ms
|
Sell | 0 % | 737 | 0 | 0 ms | 93162 ms | 3864 ms
|
SelectCategoryToSellItem | 0 % | 681 | 0 | 3 ms | 93048 ms | 2142 ms
|
SellItemForm | 0 % | 640 | 0 | 2 ms | 93046 ms | 2102 ms
|
RegisterItem | 0 % | 581 | 0 | 4 ms | 93043 ms | 2720 ms
|
AboutMe (auth form) | 2 % | 2348 | 0 | 0 ms | 93171 ms | 3696 ms
|
AboutMe | 3 % | 3311 | 0 | 4 ms | 93259 ms | 2396 ms
|
Back probability | 7 % | 8553 | 0 | 0 ms | 0 ms | 0 ms
|
End of Session | 1 % | 1131 | 0 | 0 ms | 0 ms | 0 ms
|
Total | 100 % | 106930 | 762 | - | - | 2597 ms
|
Average throughput | 897 req/s
| |||||
Completed sessions | 1021
| |||||
Total time | 59151 seconds
| |||||
Average session time | 57 seconds
| |||||
| State name | % of total | Count | Errors | Minimum Time | Maximum Time | Average Time |
|---|---|---|---|---|---|---|
Home | 3 % | 13232 | 0 | 0 ms | 343963 ms | 1181 ms
|
Register | 1 % | 3489 | 0 | 0 ms | 236510 ms | 2552 ms
|
RegisterUser | 1 % | 3436 | 160 | 5 ms | 249904 ms | 2400 ms
|
Browse | 7 % | 23408 | 0 | 0 ms | 284118 ms | 2482 ms
|
BrowseCategories | 4 % | 16447 | 0 | 3 ms | 343987 ms | 2418 ms
|
SearchItemsInCategory | 15 % | 52476 | 0 | 3 ms | 307310 ms | 2529 ms
|
BrowseRegions | 2 % | 6730 | 0 | 3 ms | 238459 ms | 2525 ms
|
BrowseCategoriesInRegion | 1 % | 6607 | 0 | 3 ms | 231957 ms | 2554 ms
|
SearchItemsInRegion | 5 % | 17326 | 0 | 0 ms | 284171 ms | 2415 ms
|
ViewItem | 14 % | 47480 | 0 | 3 ms | 344175 ms | 2446 ms
|
ViewUserInfo | 3 % | 11011 | 0 | 3 ms | 396449 ms | 2610 ms
|
ViewBidHistory | 1 % | 5915 | 0 | 4 ms | 285332 ms | 2974 ms
|
BuyNowAuth | 1 % | 4525 | 0 | 2 ms | 284016 ms | 2417 ms
|
BuyNow | 1 % | 4463 | 533 | 4 ms | 238740 ms | 2417 ms
|
StoreBuyBow | 1 % | 3874 | 3 | 5 ms | 284022 ms | 2943 ms
|
PutBidAuth | 4 % | 16573 | 0 | 0 ms | 344495 ms | 2445 ms
|
PutBid | 5 % | 19256 | 1834 | 4 ms | 284178 ms | 2408 ms
|
StoreBid | 3 % | 12772 | 15 | 5 ms | 343949 ms | 2507 ms
|
PutCommentAuth | 0 % | 0 | 0 | 0 ms | 0 ms | 0 ms
|
PutComment | 0 % | 1669 | 112 | 4 ms | 212721 ms | 2062 ms
|
StoreComment | 0 % | 1531 | 0 | 5 ms | 256509 ms | 2151 ms
|
Sell | 0 % | 1802 | 0 | 0 ms | 212177 ms | 2909 ms
|
SelectCategoryToSellItem | 0 % | 1779 | 0 | 3 ms | 212352 ms | 2480 ms
|
SellItemForm | 0 % | 1736 | 0 | 2 ms | 212819 ms | 2208 ms
|
RegisterItem | 0 % | 1725 | 0 | 5 ms | 200887 ms | 1993 ms
|
AboutMe (auth form) | 1 % | 5432 | 0 | 0 ms | 284028 ms | 2892 ms
|
AboutMe | 2 % | 9267 | 0 | 5 ms | 247133 ms | 2613 ms
|
Back probability | 10 % | 35540 | 0 | 0 ms | 0 ms | 0 ms
|
End of Session | 1 % | 4869 | 0 | 0 ms | 0 ms | 0 ms
|
Total | 100 % | 334370 | 2657 | - | - | 2128 ms
|
Average throughput | 748 req/s
| |||||
Completed sessions | 4902
| |||||
Total time | 1368638 seconds
| |||||
Average session time | 279 seconds
| |||||
| State name | % of total | Count | Errors | Minimum Time | Maximum Time | Average Time |
|---|---|---|---|---|---|---|
Home | 3 % | 523 | 0 | 0 ms | 199501 ms | 1772 ms
|
Register | 1 % | 156 | 0 | 0 ms | 159102 ms | 4552 ms
|
RegisterUser | 1 % | 151 | 7 | 4 ms | 284270 ms | 10120 ms
|
Browse | 6 % | 962 | 0 | 0 ms | 284028 ms | 7950 ms
|
BrowseCategories | 4 % | 662 | 0 | 3 ms | 284295 ms | 7941 ms
|
SearchItemsInCategory | 14 % | 1993 | 0 | 3 ms | 283198 ms | 7237 ms
|
BrowseRegions | 1 % | 264 | 0 | 3 ms | 283008 ms | 9222 ms
|
BrowseCategoriesInRegion | 2 % | 291 | 0 | 3 ms | 283079 ms | 8629 ms
|
SearchItemsInRegion | 5 % | 731 | 0 | 0 ms | 283117 ms | 7117 ms
|
ViewItem | 14 % | 2005 | 0 | 3 ms | 380026 ms | 7338 ms
|
ViewUserInfo | 3 % | 480 | 0 | 3 ms | 284295 ms | 6625 ms
|
ViewBidHistory | 2 % | 278 | 0 | 4 ms | 284670 ms | 6789 ms
|
BuyNowAuth | 1 % | 163 | 0 | 2 ms | 190003 ms | 7386 ms
|
BuyNow | 1 % | 158 | 16 | 5 ms | 211004 ms | 8289 ms
|
StoreBuyBow | 1 % | 161 | 0 | 5 ms | 283014 ms | 5609 ms
|
PutBidAuth | 4 % | 657 | 0 | 0 ms | 283186 ms | 9619 ms
|
PutBid | 5 % | 790 | 82 | 4 ms | 380057 ms | 9312 ms
|
StoreBid | 3 % | 550 | 0 | 5 ms | 284078 ms | 7946 ms
|
PutCommentAuth | 0 % | 0 | 0 | 0 ms | 0 ms | 0 ms
|
PutComment | 0 % | 70 | 6 | 4 ms | 190029 ms | 4488 ms
|
StoreComment | 0 % | 61 | 0 | 5 ms | 190053 ms | 4359 ms
|
Sell | 0 % | 75 | 0 | 0 ms | 282996 ms | 9315 ms
|
SelectCategoryToSellItem | 0 % | 57 | 0 | 3 ms | 120695 ms | 6159 ms
|
SellItemForm | 0 % | 73 | 0 | 2 ms | 58923 ms | 1845 ms
|
RegisterItem | 0 % | 65 | 0 | 5 ms | 190001 ms | 3569 ms
|
AboutMe (auth form) | 1 % | 242 | 0 | 0 ms | 283004 ms | 6880 ms
|
AboutMe | 2 % | 367 | 0 | 5 ms | 190090 ms | 8575 ms
|
Back probability | 11 % | 1580 | 0 | 0 ms | 0 ms | 0 ms
|
End of Session | 1 % | 211 | 0 | 0 ms | 0 ms | 0 ms
|
Total | 100 % | 13776 | 111 | - | - | 6387 ms
|
Average throughput | 462 req/s
| |||||
Completed sessions | 178
| |||||
Total time | 70342 seconds
| |||||
Average session time | 395 seconds
| |||||
| State name | % of total | Count | Errors | Minimum Time | Maximum Time | Average Time |
|---|---|---|---|---|---|---|
Home | 5 % | 23723 | 0 | 0 ms | 343963 ms | 3978 ms
|
Register | 1 % | 5051 | 0 | 0 ms | 380423 ms | 3029 ms
|
RegisterUser | 1 % | 4893 | 214 | 4 ms | 284270 ms | 2786 ms
|
Browse | 7 % | 34627 | 0 | 0 ms | 445126 ms | 3118 ms
|
BrowseCategories | 5 % | 23879 | 0 | 3 ms | 380533 ms | 2853 ms
|
SearchItemsInCategory | 15 % | 70636 | 0 | 3 ms | 380434 ms | 2868 ms
|
BrowseRegions | 2 % | 9853 | 0 | 3 ms | 380423 ms | 3026 ms
|
BrowseCategoriesInRegion | 2 % | 9558 | 0 | 3 ms | 380155 ms | 3060 ms
|
SearchItemsInRegion | 5 % | 23635 | 0 | 0 ms | 457589 ms | 2861 ms
|
ViewItem | 13 % | 63156 | 0 | 3 ms | 380418 ms | 2757 ms
|
ViewUserInfo | 3 % | 13955 | 0 | 3 ms | 396449 ms | 2890 ms
|
ViewBidHistory | 1 % | 7506 | 0 | 3 ms | 380117 ms | 3103 ms
|
BuyNowAuth | 1 % | 5836 | 0 | 2 ms | 380139 ms | 2698 ms
|
BuyNow | 1 % | 5663 | 688 | 4 ms | 380007 ms | 2827 ms
|
StoreBuyBow | 1 % | 4828 | 5 | 5 ms | 384187 ms | 3383 ms
|
PutBidAuth | 4 % | 21807 | 0 | 0 ms | 380006 ms | 2722 ms
|
PutBid | 5 % | 24717 | 2461 | 1 ms | 445126 ms | 2808 ms
|
StoreBid | 3 % | 16052 | 15 | 5 ms | 380505 ms | 2816 ms
|
PutCommentAuth | 0 % | 0 | 0 | 0 ms | 0 ms | 0 ms
|
PutComment | 0 % | 2183 | 154 | 4 ms | 212721 ms | 2374 ms
|
StoreComment | 0 % | 1959 | 0 | 5 ms | 256509 ms | 2185 ms
|
Sell | 0 % | 2617 | 0 | 0 ms | 282996 ms | 3497 ms
|
SelectCategoryToSellItem | 0 % | 2520 | 0 | 3 ms | 380430 ms | 2695 ms
|
SellItemForm | 0 % | 2451 | 0 | 2 ms | 212819 ms | 2186 ms
|
RegisterItem | 0 % | 2372 | 0 | 4 ms | 380511 ms | 2630 ms
|
AboutMe (auth form) | 1 % | 8035 | 0 | 0 ms | 380417 ms | 3499 ms
|
AboutMe | 2 % | 13059 | 0 | 4 ms | 380479 ms | 2900 ms
|
Back probability | 10 % | 45752 | 0 | 0 ms | 0 ms | 0 ms
|
End of Session | 1 % | 6223 | 0 | 0 ms | 0 ms | 0 ms
|
Total | 100 % | 456546 | 3537 | - | - | 2590 ms
|
Average throughput | 766 req/s
| |||||
Completed sessions | 6222
| |||||
Total time | 1549215 seconds
| |||||
Average session time | 248 seconds
| |||||
An error occured while waiting for remote processes termination (Skipping waits)
Command is: /usr/bin/scp farm6.csail.mit.edu:/tmp/client1 /home/drkp/sandbox/txcache/src/RUBiS-1.4.3/bench/2009-3-19@22:18:10//client1.bin
Command is: /usr/bin/ssh -x localhost /bin/bash -c 'LANG=en_GB.UTF-8 /usr/bin/sar -n DEV -n SOCK -rubcw 1 605 -f /home/drkp/sandbox/txcache/src/RUBiS-1.4.3/bench/2009-3-19@22:18:10//client1.bin > /home/drkp/sandbox/txcache/src/RUBiS-1.4.3/bench/2009-3-19@22:18:10//client1'
Command is: /usr/bin/scp farm14:/tmp/db_server0 /home/drkp/sandbox/txcache/src/RUBiS-1.4.3/bench/2009-3-19@22:18:10//db_server0.bin
Command is: /usr/bin/ssh -x localhost /bin/bash -c 'LANG=en_GB.UTF-8 /usr/bin/sar -n DEV -n SOCK -rubcw 1 605 -f /home/drkp/sandbox/txcache/src/RUBiS-1.4.3/bench/2009-3-19@22:18:10//db_server0.bin > /home/drkp/sandbox/txcache/src/RUBiS-1.4.3/bench/2009-3-19@22:18:10//db_server0'
Command is: /usr/bin/scp farm12.csail.mit.edu:/tmp/web_server0 /home/drkp/sandbox/txcache/src/RUBiS-1.4.3/bench/2009-3-19@22:18:10//web_server0.bin
Command is: /usr/bin/ssh -x localhost /bin/bash -c 'LANG=en_GB.UTF-8 /usr/bin/sar -n DEV -n SOCK -rubcw 1 605 -f /home/drkp/sandbox/txcache/src/RUBiS-1.4.3/bench/2009-3-19@22:18:10//web_server0.bin > /home/drkp/sandbox/txcache/src/RUBiS-1.4.3/bench/2009-3-19@22:18:10//web_server0'
Command is: /usr/bin/scp farm13.csail.mit.edu:/tmp/web_server1 /home/drkp/sandbox/txcache/src/RUBiS-1.4.3/bench/2009-3-19@22:18:10//web_server1.bin
Command is: /usr/bin/ssh -x localhost /bin/bash -c 'LANG=en_GB.UTF-8 /usr/bin/sar -n DEV -n SOCK -rubcw 1 605 -f /home/drkp/sandbox/txcache/src/RUBiS-1.4.3/bench/2009-3-19@22:18:10//web_server1.bin > /home/drkp/sandbox/txcache/src/RUBiS-1.4.3/bench/2009-3-19@22:18:10//web_server1'
Command is: /usr/bin/scp localhost:/tmp/client0 /home/drkp/sandbox/txcache/src/RUBiS-1.4.3/bench/2009-3-19@22:18:10//client0.bin
Command is: /usr/bin/ssh -x localhost /bin/bash -c 'LANG=en_GB.UTF-8 /usr/bin/sar -n DEV -n SOCK -rubcw 1 605 -f /home/drkp/sandbox/txcache/src/RUBiS-1.4.3/bench/2009-3-19@22:18:10//client0.bin > /home/drkp/sandbox/txcache/src/RUBiS-1.4.3/bench/2009-3-19@22:18:10//client0'
Command is: /usr/bin/scp farm6.csail.mit.edu:/tmp/trace_client1.html /home/drkp/sandbox/txcache/src/RUBiS-1.4.3/bench/2009-3-19@22:18:10//
Command is: /usr/bin/scp farm6.csail.mit.edu:/tmp/stat_client1.html /home/drkp/sandbox/txcache/src/RUBiS-1.4.3/bench/2009-3-19@22:18:10//
|
|
|
|
|
|
 | 
|
 | 
|
 | 
|
 | 
|
 | 
|
 | 
|
 | 
|
 | 
|
 | 
|