Node information
Test timing information
Up ramp statistics
Runtime session statistics
Down ramp statistics
Overall statistics
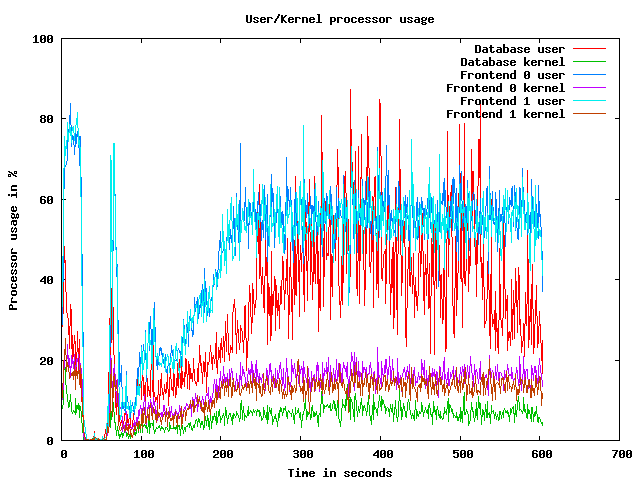
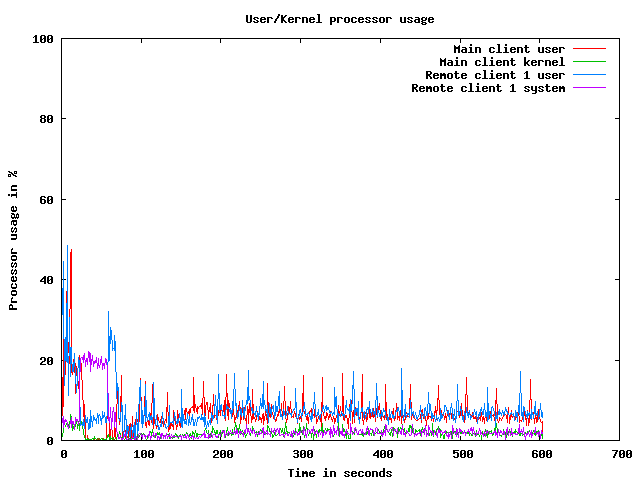
CPU usage graphs
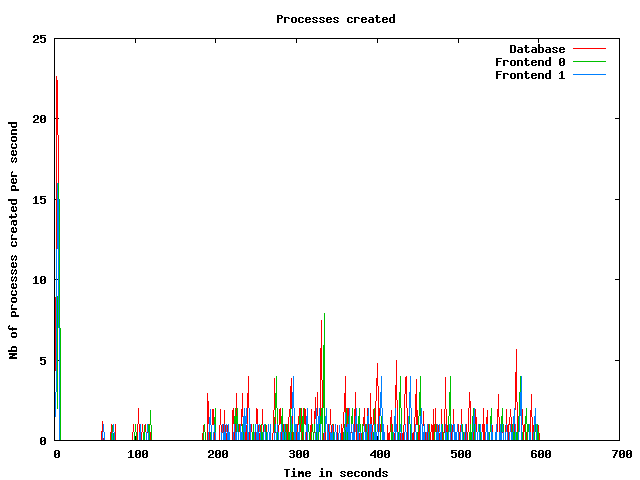
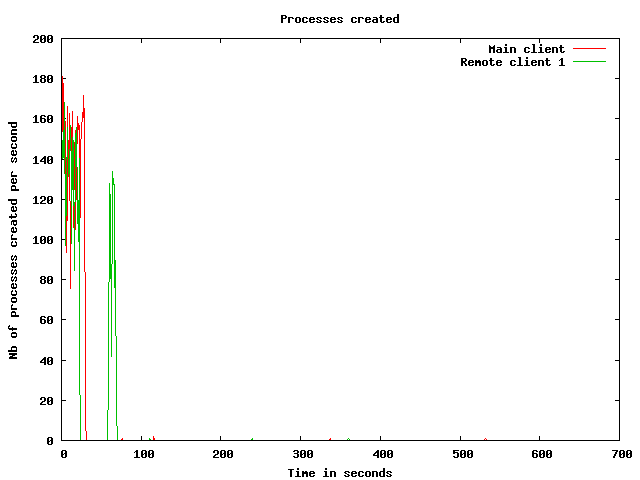
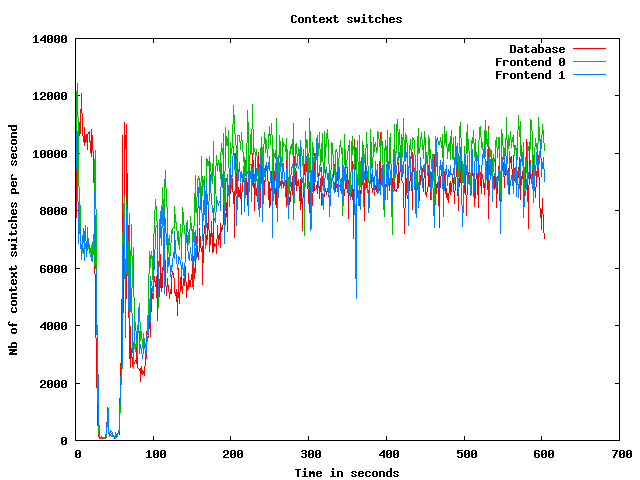
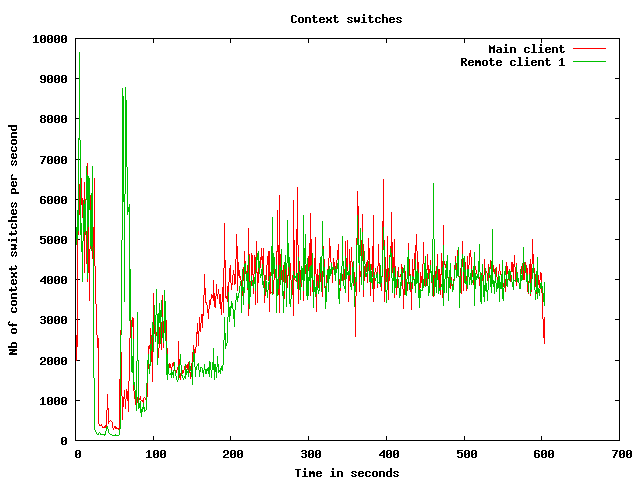
Processes usage graphs
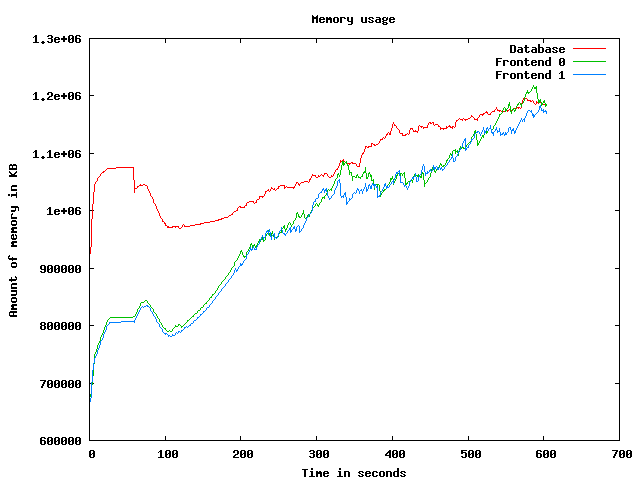
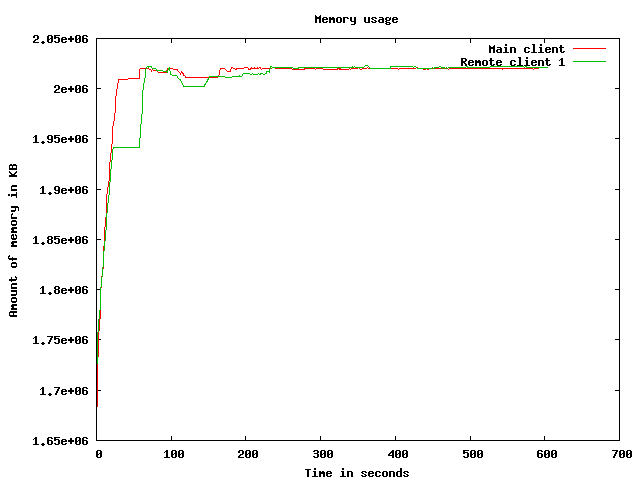
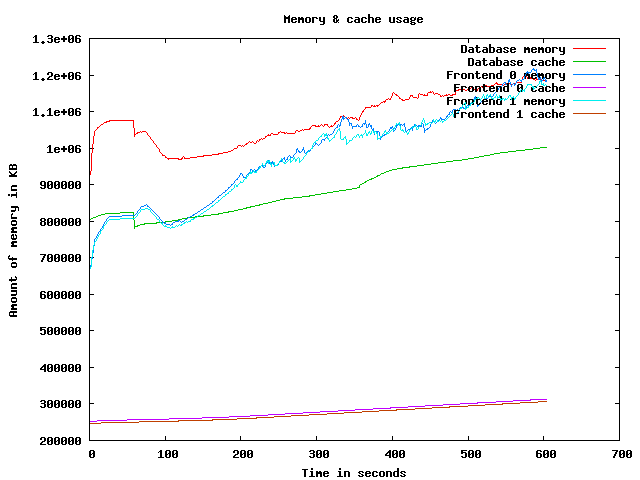
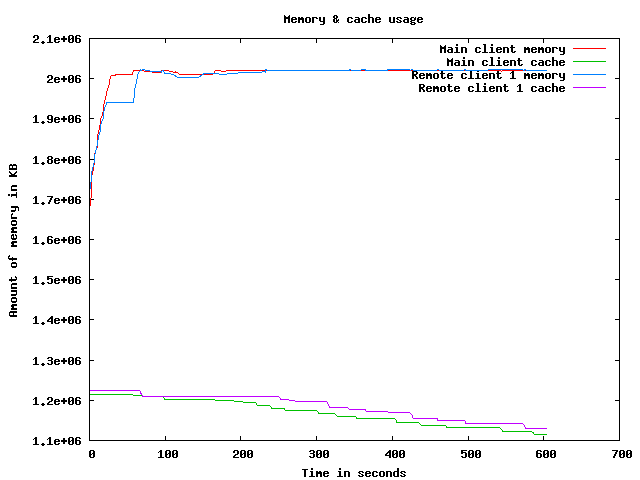
Memory usage graph
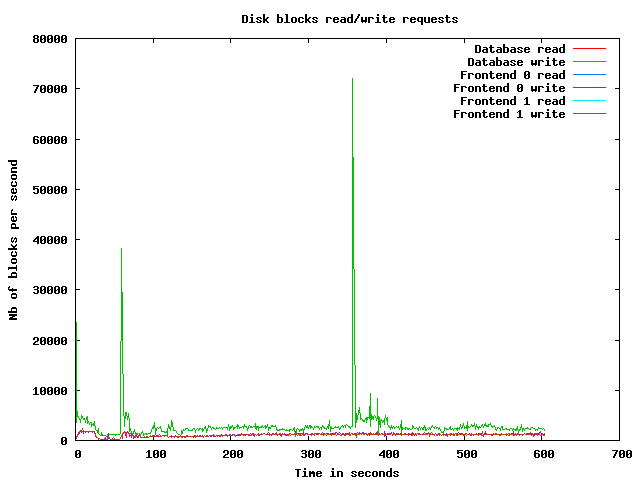
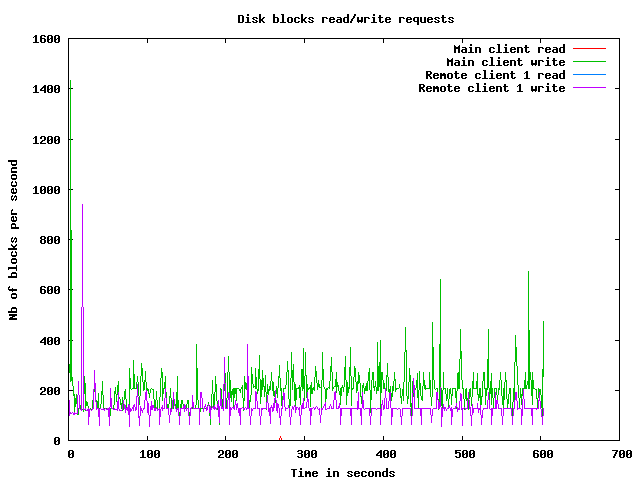
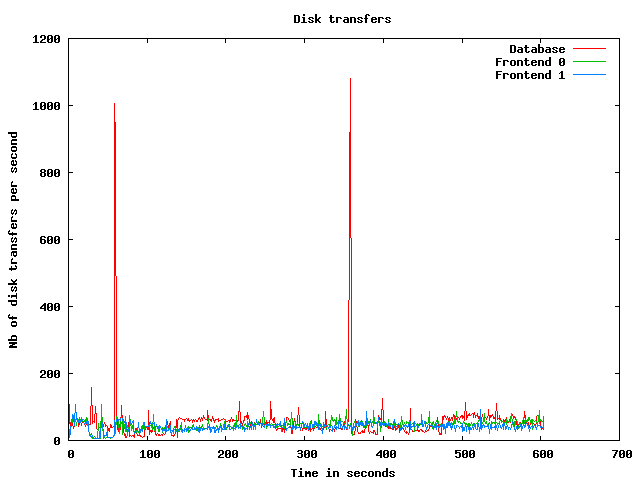
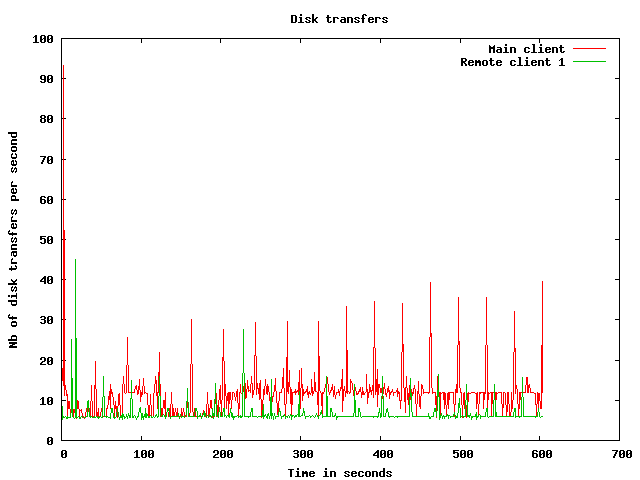
Disk usage graphs
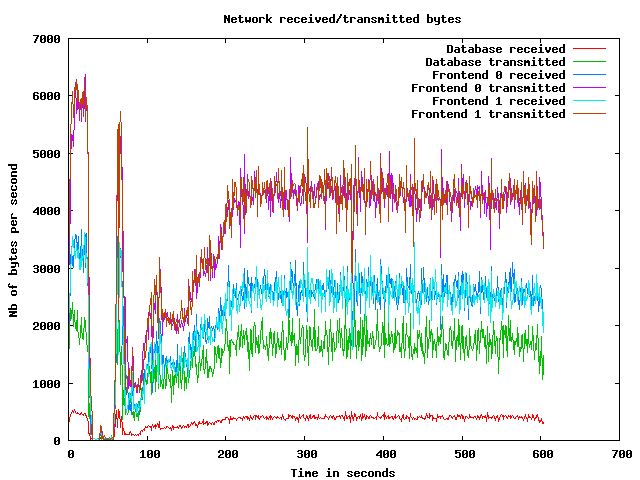
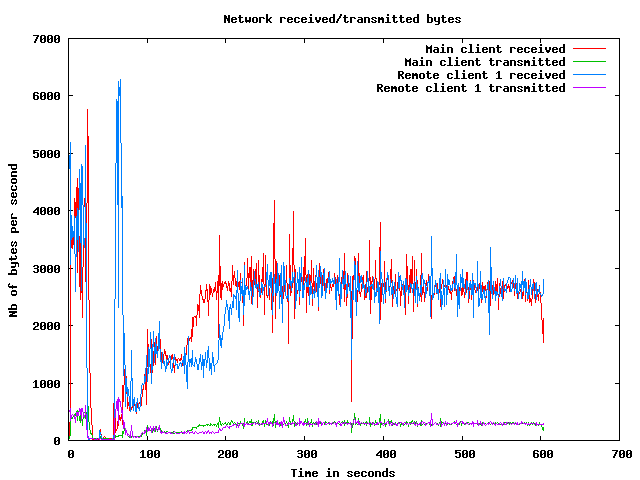
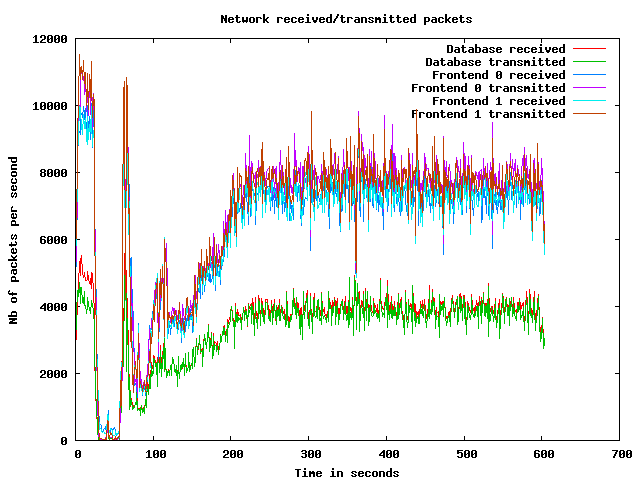
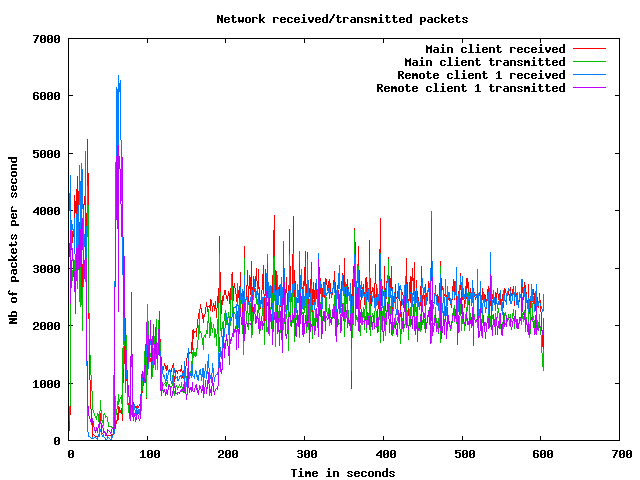
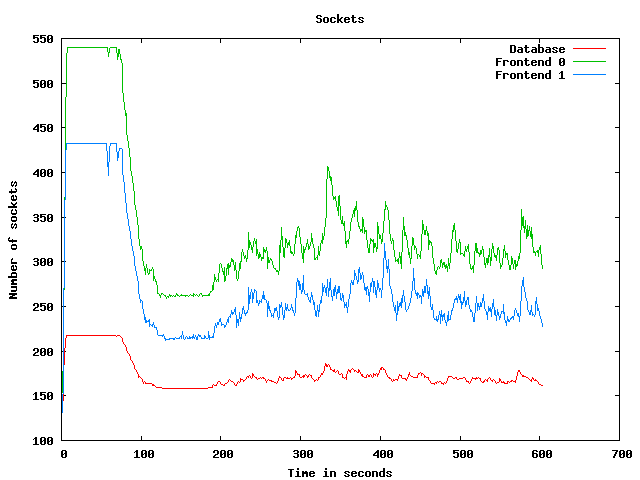
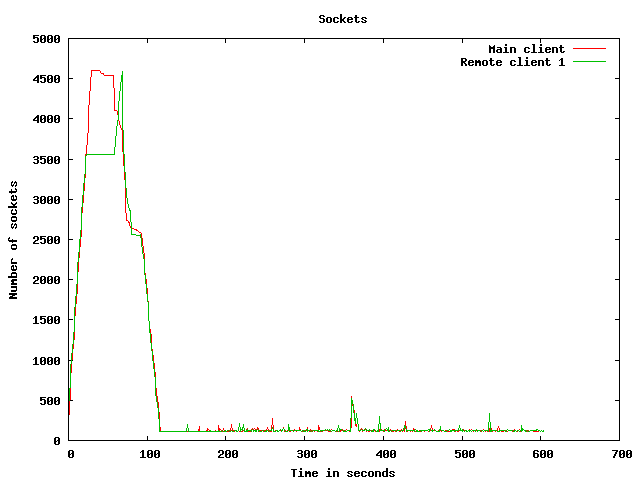
Network usage graphs
| Test start | 2009-3-19 21:23:7 |
| Up ramp start | 2009-3-19 21:23:39 |
| Runtime session start | 2009-3-19 21:25:39 |
| Down ramp start | 2009-3-19 21:33:9 |
| Test end | 2009-3-19 21:35:50 |
| Up ramp length | 2 minutes 1 millisecond (requested 120000 ms) |
| Runtime session length | 7 minutes 30 seconds 0 millisecond (requested 450000 ms) |
| Down ramp length | 30 seconds 0 millisecond (requested 30000 ms) |
| Total test length | 12 minutes 43 seconds 123 milliseconds |
| State name | % of total | Count | Errors | Minimum Time | Maximum Time | Average Time |
|---|---|---|---|---|---|---|
Home | 11 % | 6470 | 0 | 0 ms | 93942 ms | 14365 ms
|
Register | 1 % | 856 | 0 | 0 ms | 93390 ms | 5941 ms
|
RegisterUser | 1 % | 786 | 1 | 5 ms | 93114 ms | 4200 ms
|
Browse | 10 % | 6102 | 0 | 0 ms | 93581 ms | 6568 ms
|
BrowseCategories | 6 % | 3994 | 0 | 3 ms | 93540 ms | 5227 ms
|
SearchItemsInCategory | 14 % | 8288 | 0 | 0 ms | 93553 ms | 4989 ms
|
BrowseRegions | 2 % | 1690 | 0 | 3 ms | 93626 ms | 4468 ms
|
BrowseCategoriesInRegion | 2 % | 1520 | 0 | 3 ms | 93451 ms | 4932 ms
|
SearchItemsInRegion | 4 % | 2794 | 0 | 0 ms | 93584 ms | 4016 ms
|
ViewItem | 12 % | 7037 | 0 | 3 ms | 93575 ms | 4327 ms
|
ViewUserInfo | 1 % | 1155 | 0 | 3 ms | 93296 ms | 4972 ms
|
ViewBidHistory | 1 % | 650 | 0 | 3 ms | 93519 ms | 5743 ms
|
BuyNowAuth | 0 % | 556 | 0 | 2 ms | 93572 ms | 3773 ms
|
BuyNow | 0 % | 485 | 84 | 4 ms | 93055 ms | 3294 ms
|
StoreBuyBow | 0 % | 346 | 0 | 4 ms | 93422 ms | 5971 ms
|
PutBidAuth | 3 % | 2334 | 0 | 0 ms | 93467 ms | 4519 ms
|
PutBid | 3 % | 2221 | 305 | 1 ms | 93638 ms | 4214 ms
|
StoreBid | 2 % | 1230 | 1 | 4 ms | 93450 ms | 3964 ms
|
PutCommentAuth | 0 % | 0 | 0 | 0 ms | 0 ms | 0 ms
|
PutComment | 0 % | 179 | 17 | 4 ms | 93520 ms | 5003 ms
|
StoreComment | 0 % | 144 | 0 | 5 ms | 93282 ms | 5449 ms
|
Sell | 0 % | 440 | 0 | 0 ms | 93421 ms | 7819 ms
|
SelectCategoryToSellItem | 0 % | 411 | 0 | 3 ms | 93063 ms | 6094 ms
|
SellItemForm | 0 % | 375 | 0 | 2 ms | 93122 ms | 3292 ms
|
RegisterItem | 0 % | 339 | 0 | 4 ms | 93199 ms | 5194 ms
|
AboutMe (auth form) | 2 % | 1331 | 0 | 0 ms | 93547 ms | 6918 ms
|
AboutMe | 3 % | 1836 | 0 | 4 ms | 93642 ms | 5746 ms
|
Back probability | 7 % | 4233 | 0 | 0 ms | 0 ms | 0 ms
|
End of Session | 0 % | 564 | 0 | 0 ms | 0 ms | 0 ms
|
Total | 100 % | 58366 | 408 | - | - | 5628 ms
|
Average throughput | 489 req/s
| |||||
Completed sessions | 511
| |||||
Total time | 26222 seconds
| |||||
Average session time | 51 seconds
| |||||
| State name | % of total | Count | Errors | Minimum Time | Maximum Time | Average Time |
|---|---|---|---|---|---|---|
Home | 4 % | 14615 | 0 | 0 ms | 3929 ms | 4 ms
|
Register | 1 % | 3461 | 0 | 0 ms | 3003 ms | 8 ms
|
RegisterUser | 1 % | 3395 | 30 | 5 ms | 3398 ms | 30 ms
|
Browse | 7 % | 23580 | 0 | 0 ms | 9099 ms | 15 ms
|
BrowseCategories | 4 % | 16462 | 0 | 3 ms | 9126 ms | 25 ms
|
SearchItemsInCategory | 15 % | 52439 | 0 | 0 ms | 9127 ms | 25 ms
|
BrowseRegions | 2 % | 6821 | 0 | 3 ms | 9125 ms | 26 ms
|
BrowseCategoriesInRegion | 2 % | 6750 | 0 | 3 ms | 3634 ms | 22 ms
|
SearchItemsInRegion | 5 % | 16851 | 0 | 0 ms | 9262 ms | 42 ms
|
ViewItem | 14 % | 47355 | 0 | 3 ms | 9189 ms | 33 ms
|
ViewUserInfo | 3 % | 10836 | 0 | 3 ms | 9093 ms | 30 ms
|
ViewBidHistory | 1 % | 5619 | 0 | 3 ms | 9067 ms | 57 ms
|
BuyNowAuth | 1 % | 4419 | 0 | 2 ms | 9138 ms | 18 ms
|
BuyNow | 1 % | 4331 | 643 | 3 ms | 9089 ms | 33 ms
|
StoreBuyBow | 1 % | 3598 | 3 | 4 ms | 3154 ms | 24 ms
|
PutBidAuth | 4 % | 16463 | 0 | 0 ms | 9175 ms | 17 ms
|
PutBid | 5 % | 18864 | 2227 | 3 ms | 9032 ms | 32 ms
|
StoreBid | 3 % | 12280 | 6 | 4 ms | 9133 ms | 30 ms
|
PutCommentAuth | 0 % | 0 | 0 | 0 ms | 0 ms | 0 ms
|
PutComment | 0 % | 1603 | 123 | 4 ms | 9058 ms | 31 ms
|
StoreComment | 0 % | 1441 | 0 | 4 ms | 3005 ms | 25 ms
|
Sell | 0 % | 1775 | 0 | 0 ms | 2994 ms | 7 ms
|
SelectCategoryToSellItem | 0 % | 1737 | 0 | 3 ms | 4090 ms | 26 ms
|
SellItemForm | 0 % | 1720 | 0 | 2 ms | 3893 ms | 22 ms
|
RegisterItem | 0 % | 1702 | 0 | 4 ms | 9143 ms | 35 ms
|
AboutMe (auth form) | 1 % | 5377 | 0 | 0 ms | 9110 ms | 14 ms
|
AboutMe | 2 % | 9281 | 0 | 4 ms | 4287 ms | 61 ms
|
Back probability | 10 % | 34926 | 0 | 0 ms | 0 ms | 0 ms
|
End of Session | 1 % | 4779 | 0 | 0 ms | 0 ms | 0 ms
|
Total | 100 % | 332480 | 3032 | - | - | 24 ms
|
Average throughput | 745 req/s
| |||||
Completed sessions | 4761
| |||||
Total time | 1210112 seconds
| |||||
Average session time | 254 seconds
| |||||
| State name | % of total | Count | Errors | Minimum Time | Maximum Time | Average Time |
|---|---|---|---|---|---|---|
Home | 4 % | 501 | 0 | 0 ms | 26 ms | 0 ms
|
Register | 0 % | 102 | 0 | 0 ms | 15 ms | 1 ms
|
RegisterUser | 0 % | 108 | 2 | 6 ms | 46 ms | 15 ms
|
Browse | 7 % | 794 | 0 | 0 ms | 285 ms | 2 ms
|
BrowseCategories | 5 % | 597 | 0 | 3 ms | 255 ms | 9 ms
|
SearchItemsInCategory | 15 % | 1666 | 0 | 3 ms | 178 ms | 10 ms
|
BrowseRegions | 2 % | 225 | 0 | 3 ms | 67 ms | 9 ms
|
BrowseCategoriesInRegion | 2 % | 231 | 0 | 3 ms | 84 ms | 8 ms
|
SearchItemsInRegion | 5 % | 614 | 0 | 0 ms | 294 ms | 20 ms
|
ViewItem | 14 % | 1550 | 0 | 3 ms | 300 ms | 13 ms
|
ViewUserInfo | 3 % | 336 | 0 | 3 ms | 76 ms | 13 ms
|
ViewBidHistory | 1 % | 182 | 0 | 3 ms | 175 ms | 34 ms
|
BuyNowAuth | 1 % | 129 | 0 | 2 ms | 70 ms | 5 ms
|
BuyNow | 1 % | 130 | 13 | 4 ms | 45 ms | 15 ms
|
StoreBuyBow | 1 % | 120 | 0 | 5 ms | 51 ms | 13 ms
|
PutBidAuth | 5 % | 570 | 0 | 0 ms | 244 ms | 5 ms
|
PutBid | 5 % | 643 | 93 | 4 ms | 62 ms | 15 ms
|
StoreBid | 3 % | 400 | 0 | 5 ms | 85 ms | 13 ms
|
PutCommentAuth | 0 % | 0 | 0 | 0 ms | 0 ms | 0 ms
|
PutComment | 0 % | 62 | 3 | 3 ms | 44 ms | 12 ms
|
StoreComment | 0 % | 57 | 0 | 5 ms | 42 ms | 13 ms
|
Sell | 0 % | 53 | 0 | 0 ms | 67 ms | 2 ms
|
SelectCategoryToSellItem | 0 % | 52 | 0 | 4 ms | 62 ms | 9 ms
|
SellItemForm | 0 % | 44 | 0 | 2 ms | 22 ms | 5 ms
|
RegisterItem | 0 % | 52 | 0 | 5 ms | 50 ms | 11 ms
|
AboutMe (auth form) | 1 % | 186 | 0 | 0 ms | 7 ms | 0 ms
|
AboutMe | 2 % | 280 | 0 | 4 ms | 140 ms | 36 ms
|
Back probability | 10 % | 1187 | 0 | 0 ms | 0 ms | 0 ms
|
End of Session | 1 % | 163 | 0 | 0 ms | 0 ms | 0 ms
|
Total | 100 % | 11034 | 111 | - | - | 9 ms
|
Average throughput | 371 req/s
| |||||
Completed sessions | 157
| |||||
Total time | 57819 seconds
| |||||
Average session time | 368 seconds
| |||||
| State name | % of total | Count | Errors | Minimum Time | Maximum Time | Average Time |
|---|---|---|---|---|---|---|
Home | 5 % | 21586 | 0 | 0 ms | 93942 ms | 4309 ms
|
Register | 1 % | 4419 | 0 | 0 ms | 93390 ms | 1157 ms
|
RegisterUser | 1 % | 4289 | 33 | 5 ms | 93114 ms | 794 ms
|
Browse | 7 % | 30476 | 0 | 0 ms | 93581 ms | 1327 ms
|
BrowseCategories | 5 % | 21053 | 0 | 3 ms | 93540 ms | 1011 ms
|
SearchItemsInCategory | 15 % | 62649 | 0 | 0 ms | 93553 ms | 682 ms
|
BrowseRegions | 2 % | 8736 | 0 | 3 ms | 93626 ms | 885 ms
|
BrowseCategoriesInRegion | 2 % | 8501 | 0 | 3 ms | 93451 ms | 899 ms
|
SearchItemsInRegion | 5 % | 20313 | 0 | 0 ms | 93584 ms | 588 ms
|
ViewItem | 13 % | 56045 | 0 | 3 ms | 93575 ms | 571 ms
|
ViewUserInfo | 3 % | 12353 | 0 | 3 ms | 93296 ms | 492 ms
|
ViewBidHistory | 1 % | 6471 | 0 | 3 ms | 93519 ms | 628 ms
|
BuyNowAuth | 1 % | 5104 | 0 | 2 ms | 93572 ms | 426 ms
|
BuyNow | 1 % | 4946 | 740 | 3 ms | 93055 ms | 352 ms
|
StoreBuyBow | 1 % | 4064 | 3 | 4 ms | 93422 ms | 530 ms
|
PutBidAuth | 4 % | 19368 | 0 | 0 ms | 93467 ms | 559 ms
|
PutBid | 5 % | 21778 | 2625 | 1 ms | 93638 ms | 458 ms
|
StoreBid | 3 % | 13910 | 7 | 4 ms | 93450 ms | 378 ms
|
PutCommentAuth | 0 % | 0 | 0 | 0 ms | 0 ms | 0 ms
|
PutComment | 0 % | 1844 | 143 | 3 ms | 93520 ms | 513 ms
|
StoreComment | 0 % | 1642 | 0 | 4 ms | 93282 ms | 501 ms
|
Sell | 0 % | 2268 | 0 | 0 ms | 93421 ms | 1522 ms
|
SelectCategoryToSellItem | 0 % | 2200 | 0 | 3 ms | 93063 ms | 1160 ms
|
SellItemForm | 0 % | 2139 | 0 | 2 ms | 93122 ms | 595 ms
|
RegisterItem | 0 % | 2093 | 0 | 4 ms | 93199 ms | 870 ms
|
AboutMe (auth form) | 1 % | 6894 | 0 | 0 ms | 93547 ms | 1346 ms
|
AboutMe | 2 % | 11448 | 0 | 4 ms | 93642 ms | 972 ms
|
Back probability | 10 % | 40346 | 0 | 0 ms | 0 ms | 0 ms
|
End of Session | 1 % | 5506 | 0 | 0 ms | 0 ms | 0 ms
|
Total | 100 % | 402441 | 3551 | - | - | 834 ms
|
Average throughput | 676 req/s
| |||||
Completed sessions | 5506
| |||||
Total time | 1323714 seconds
| |||||
Average session time | 240 seconds
| |||||
An error occured while waiting for remote processes termination (Skipping waits)
Command is: /usr/bin/scp farm6.csail.mit.edu:/tmp/client1 /home/drkp/sandbox/txcache/src/RUBiS-1.4.3/bench/2009-3-19@21:23:7//client1.bin
Command is: /usr/bin/ssh -x localhost /bin/bash -c 'LANG=en_GB.UTF-8 /usr/bin/sar -n DEV -n SOCK -rubcw 1 605 -f /home/drkp/sandbox/txcache/src/RUBiS-1.4.3/bench/2009-3-19@21:23:7//client1.bin > /home/drkp/sandbox/txcache/src/RUBiS-1.4.3/bench/2009-3-19@21:23:7//client1'
Command is: /usr/bin/scp farm14:/tmp/db_server0 /home/drkp/sandbox/txcache/src/RUBiS-1.4.3/bench/2009-3-19@21:23:7//db_server0.bin
Command is: /usr/bin/ssh -x localhost /bin/bash -c 'LANG=en_GB.UTF-8 /usr/bin/sar -n DEV -n SOCK -rubcw 1 605 -f /home/drkp/sandbox/txcache/src/RUBiS-1.4.3/bench/2009-3-19@21:23:7//db_server0.bin > /home/drkp/sandbox/txcache/src/RUBiS-1.4.3/bench/2009-3-19@21:23:7//db_server0'
Command is: /usr/bin/scp farm12.csail.mit.edu:/tmp/web_server0 /home/drkp/sandbox/txcache/src/RUBiS-1.4.3/bench/2009-3-19@21:23:7//web_server0.bin
Command is: /usr/bin/ssh -x localhost /bin/bash -c 'LANG=en_GB.UTF-8 /usr/bin/sar -n DEV -n SOCK -rubcw 1 605 -f /home/drkp/sandbox/txcache/src/RUBiS-1.4.3/bench/2009-3-19@21:23:7//web_server0.bin > /home/drkp/sandbox/txcache/src/RUBiS-1.4.3/bench/2009-3-19@21:23:7//web_server0'
Command is: /usr/bin/scp farm13.csail.mit.edu:/tmp/web_server1 /home/drkp/sandbox/txcache/src/RUBiS-1.4.3/bench/2009-3-19@21:23:7//web_server1.bin
Command is: /usr/bin/ssh -x localhost /bin/bash -c 'LANG=en_GB.UTF-8 /usr/bin/sar -n DEV -n SOCK -rubcw 1 605 -f /home/drkp/sandbox/txcache/src/RUBiS-1.4.3/bench/2009-3-19@21:23:7//web_server1.bin > /home/drkp/sandbox/txcache/src/RUBiS-1.4.3/bench/2009-3-19@21:23:7//web_server1'
Command is: /usr/bin/scp localhost:/tmp/client0 /home/drkp/sandbox/txcache/src/RUBiS-1.4.3/bench/2009-3-19@21:23:7//client0.bin
Command is: /usr/bin/ssh -x localhost /bin/bash -c 'LANG=en_GB.UTF-8 /usr/bin/sar -n DEV -n SOCK -rubcw 1 605 -f /home/drkp/sandbox/txcache/src/RUBiS-1.4.3/bench/2009-3-19@21:23:7//client0.bin > /home/drkp/sandbox/txcache/src/RUBiS-1.4.3/bench/2009-3-19@21:23:7//client0'
Command is: /usr/bin/scp farm6.csail.mit.edu:/tmp/trace_client1.html /home/drkp/sandbox/txcache/src/RUBiS-1.4.3/bench/2009-3-19@21:23:7//
Command is: /usr/bin/scp farm6.csail.mit.edu:/tmp/stat_client1.html /home/drkp/sandbox/txcache/src/RUBiS-1.4.3/bench/2009-3-19@21:23:7//
|
|
|
|
|
|
 | 
|
 | 
|
 | 
|
 | 
|
 | 
|
 | 
|
 | 
|
 | 
|
 | 
|