Node information
Test timing information
Up ramp statistics
Runtime session statistics
Down ramp statistics
Overall statistics
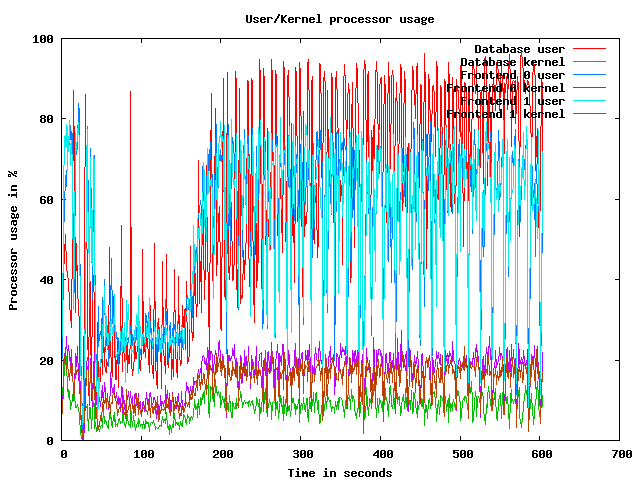
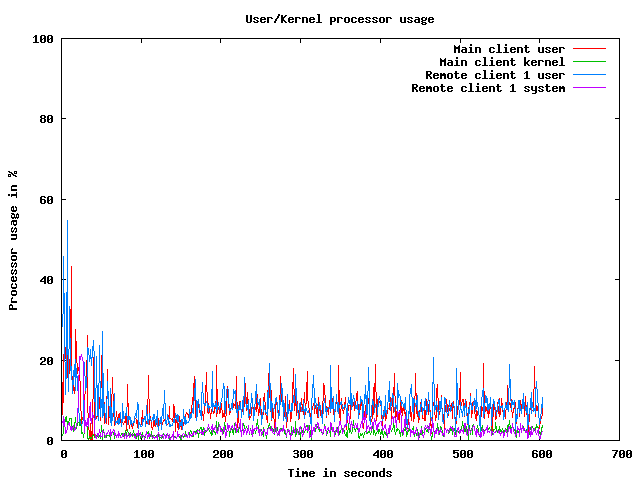
CPU usage graphs
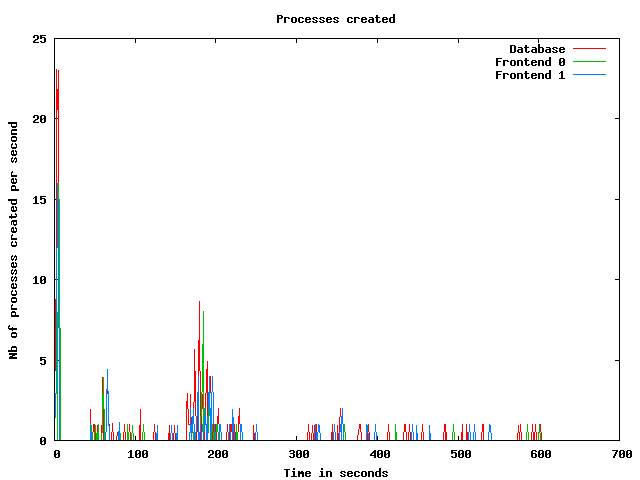
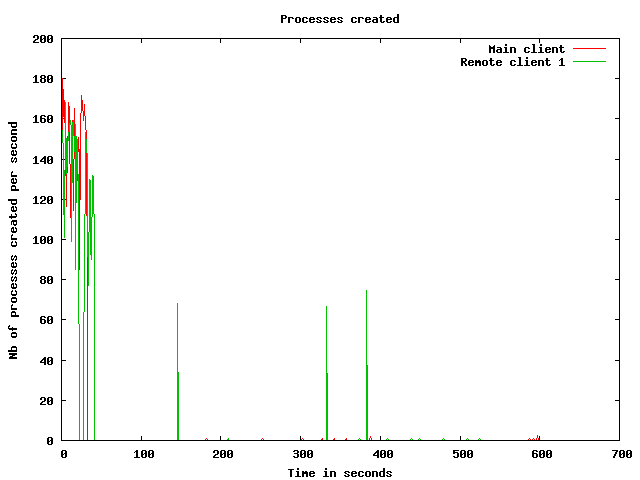
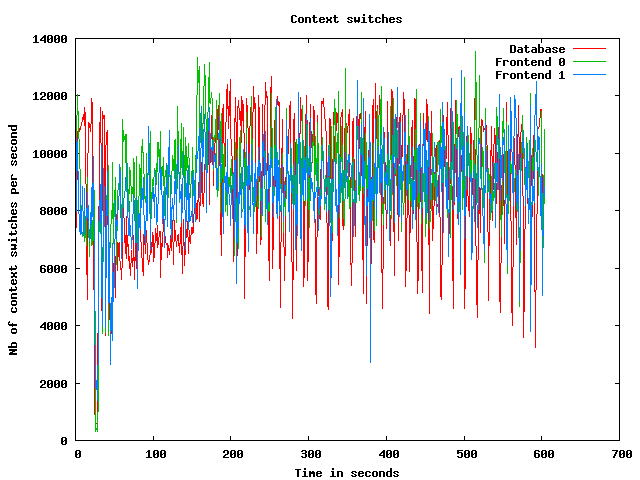
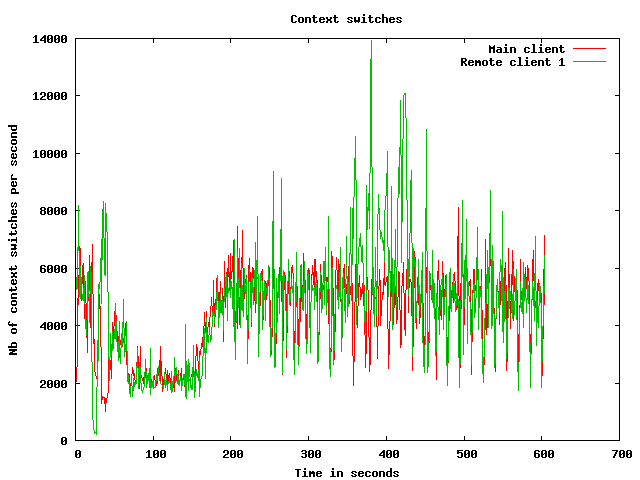
Processes usage graphs
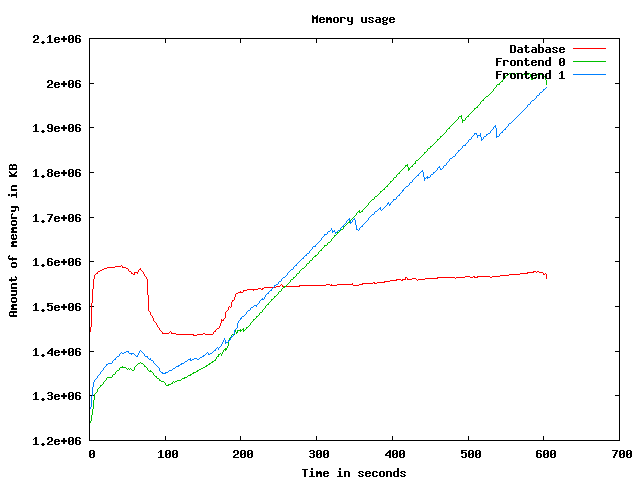
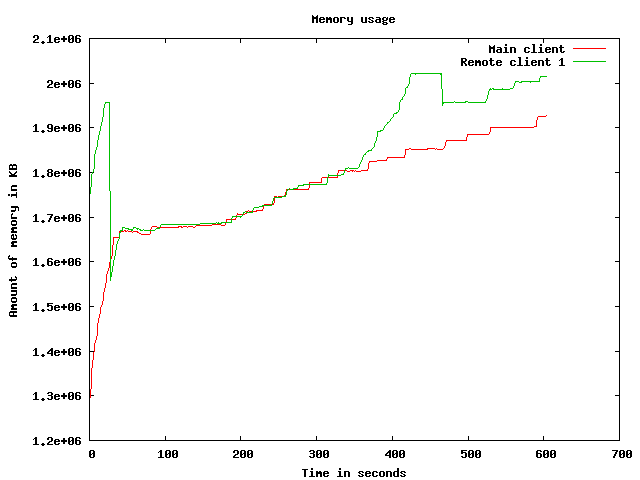
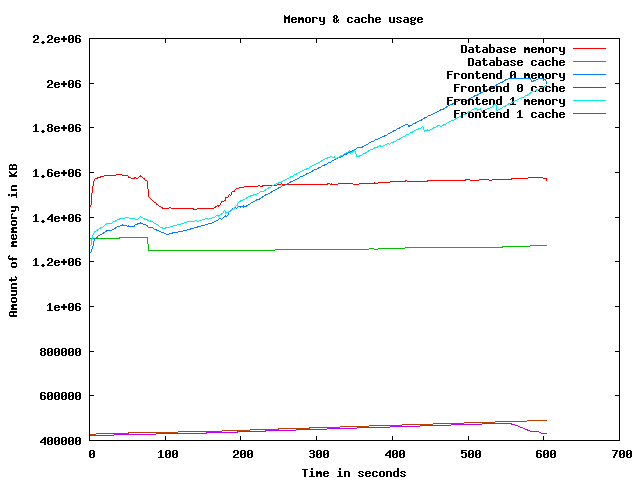
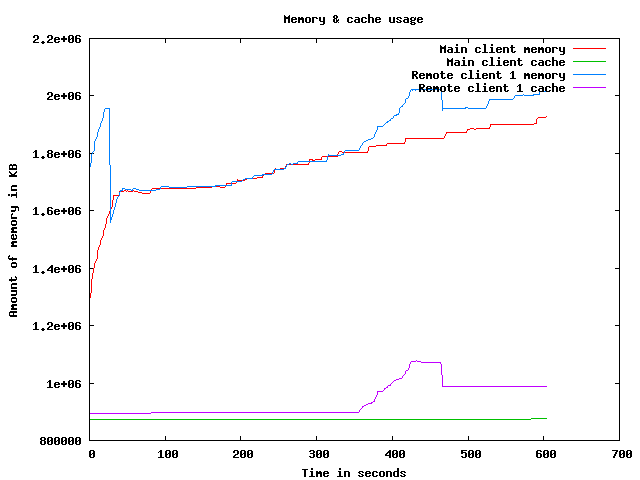
Memory usage graph
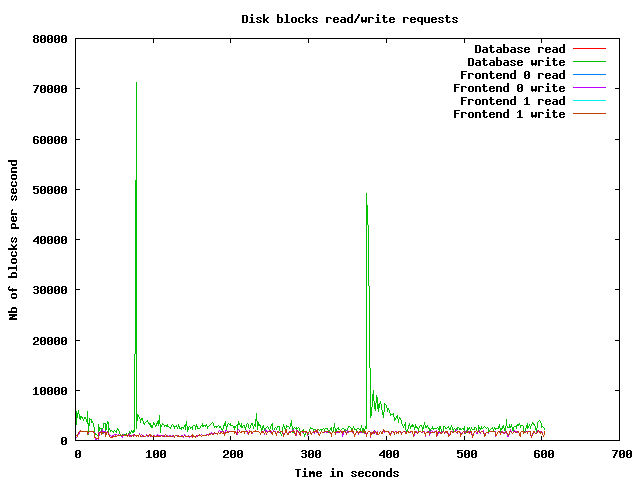
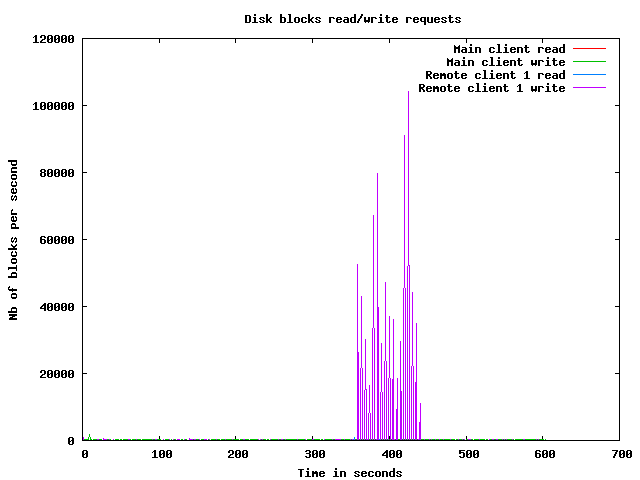
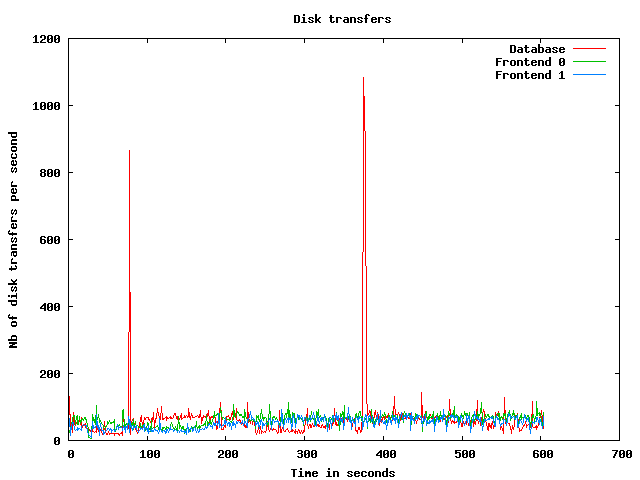
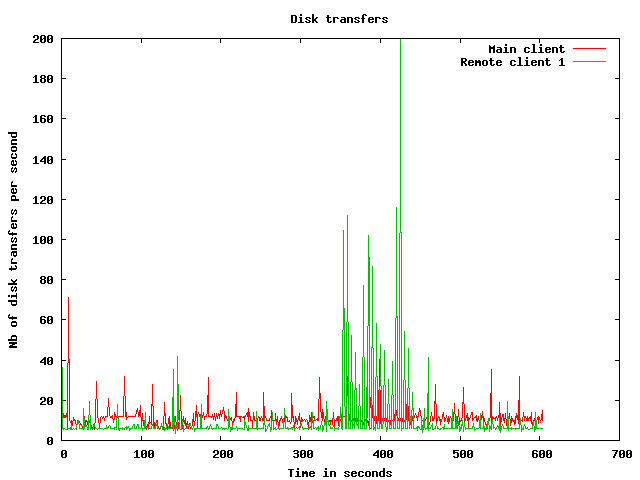
Disk usage graphs
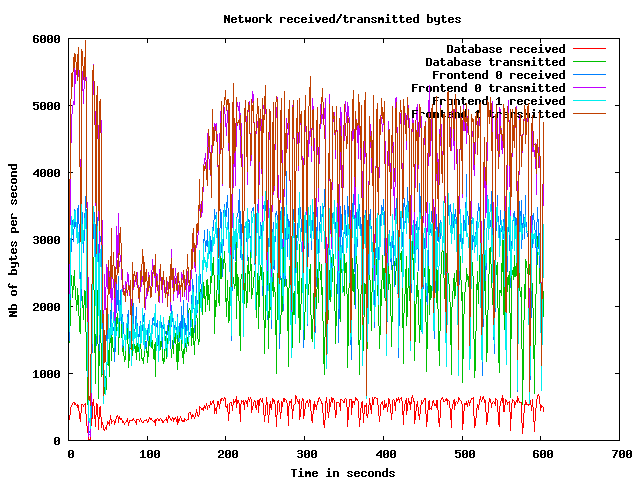
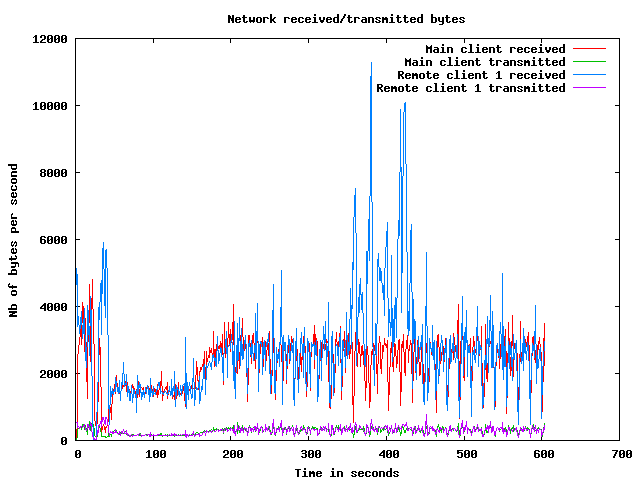
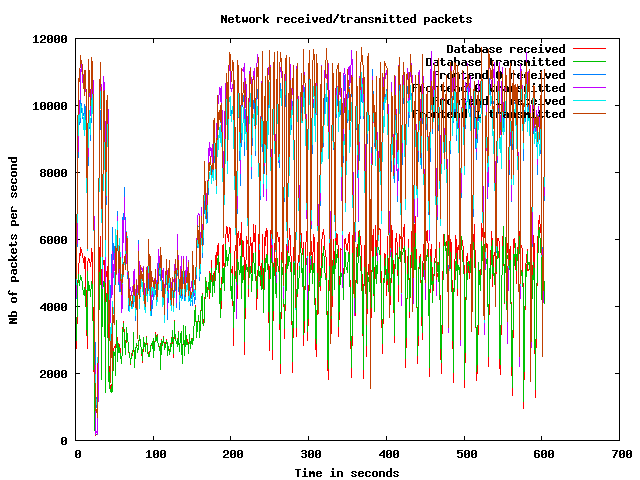
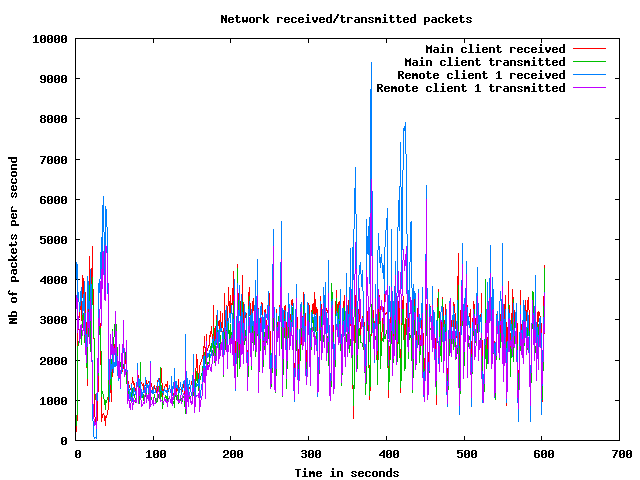
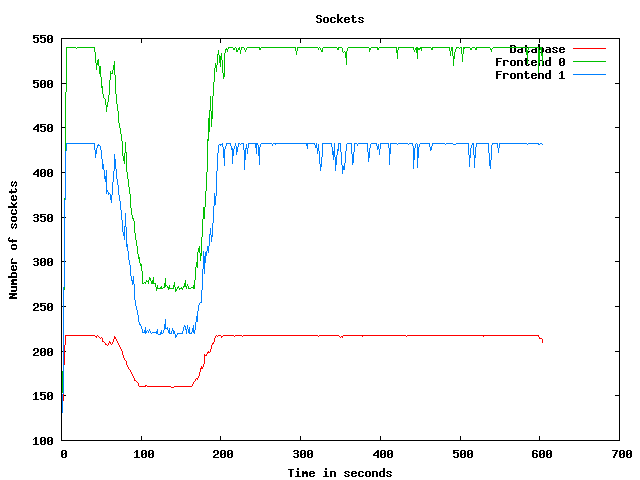
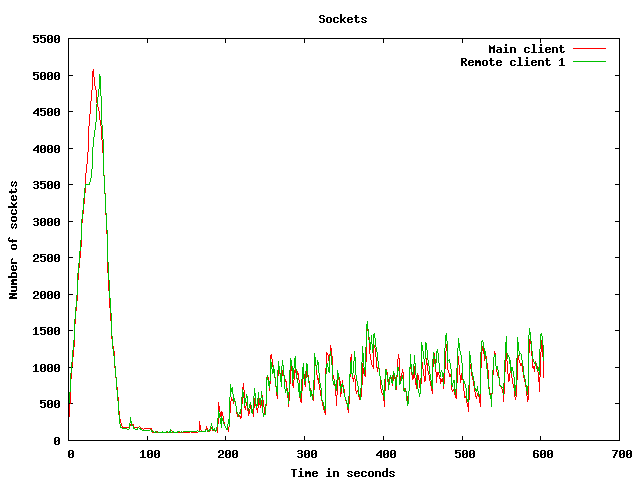
Network usage graphs
| Test start | 2009-3-20 1:24:26 |
| Up ramp start | 2009-3-20 1:25:0 |
| Runtime session start | 2009-3-20 1:27:0 |
| Down ramp start | 2009-3-20 1:34:30 |
| Test end | 2009-3-20 1:36:59 |
| Up ramp length | 2 minutes 0 millisecond (requested 120000 ms) |
| Runtime session length | 7 minutes 30 seconds 1 millisecond (requested 450000 ms) |
| Down ramp length | 30 seconds 0 millisecond (requested 30000 ms) |
| Total test length | 12 minutes 33 seconds 556 milliseconds |
| State name | % of total | Count | Errors | Minimum Time | Maximum Time | Average Time |
|---|---|---|---|---|---|---|
Home | 9 % | 7489 | 0 | 0 ms | 93010 ms | 7446 ms
|
Register | 1 % | 1073 | 0 | 0 ms | 92998 ms | 2463 ms
|
RegisterUser | 1 % | 1000 | 19 | 4 ms | 93008 ms | 2273 ms
|
Browse | 9 % | 7445 | 0 | 0 ms | 92999 ms | 2977 ms
|
BrowseCategories | 6 % | 4948 | 0 | 3 ms | 93012 ms | 2255 ms
|
SearchItemsInCategory | 14 % | 11273 | 0 | 3 ms | 93048 ms | 1695 ms
|
BrowseRegions | 2 % | 2017 | 0 | 3 ms | 93003 ms | 1960 ms
|
BrowseCategoriesInRegion | 2 % | 1876 | 0 | 3 ms | 93012 ms | 2189 ms
|
SearchItemsInRegion | 4 % | 3798 | 0 | 0 ms | 93010 ms | 1572 ms
|
ViewItem | 12 % | 9554 | 0 | 3 ms | 59302 ms | 1573 ms
|
ViewUserInfo | 2 % | 1767 | 0 | 3 ms | 65146 ms | 1676 ms
|
ViewBidHistory | 1 % | 888 | 0 | 3 ms | 47097 ms | 1714 ms
|
BuyNowAuth | 1 % | 820 | 0 | 2 ms | 93003 ms | 1221 ms
|
BuyNow | 0 % | 733 | 111 | 4 ms | 93016 ms | 694 ms
|
StoreBuyBow | 0 % | 535 | 0 | 4 ms | 93009 ms | 1420 ms
|
PutBidAuth | 4 % | 3189 | 0 | 0 ms | 65103 ms | 1513 ms
|
PutBid | 4 % | 3108 | 383 | 3 ms | 46886 ms | 1064 ms
|
StoreBid | 2 % | 1794 | 0 | 4 ms | 93015 ms | 1683 ms
|
PutCommentAuth | 0 % | 0 | 0 | 0 ms | 0 ms | 0 ms
|
PutComment | 0 % | 281 | 19 | 4 ms | 45722 ms | 1517 ms
|
StoreComment | 0 % | 231 | 0 | 5 ms | 45720 ms | 1494 ms
|
Sell | 0 % | 536 | 0 | 0 ms | 65095 ms | 2919 ms
|
SelectCategoryToSellItem | 0 % | 489 | 0 | 4 ms | 46332 ms | 2156 ms
|
SellItemForm | 0 % | 459 | 0 | 2 ms | 93008 ms | 1733 ms
|
RegisterItem | 0 % | 418 | 0 | 4 ms | 45638 ms | 1888 ms
|
AboutMe (auth form) | 2 % | 1612 | 0 | 0 ms | 93007 ms | 3186 ms
|
AboutMe | 2 % | 2222 | 0 | 4 ms | 65149 ms | 2047 ms
|
Back probability | 7 % | 6033 | 0 | 0 ms | 0 ms | 0 ms
|
End of Session | 1 % | 771 | 0 | 0 ms | 0 ms | 0 ms
|
Total | 100 % | 76359 | 532 | - | - | 2272 ms
|
Average throughput | 640 req/s
| |||||
Completed sessions | 690
| |||||
Total time | 41250 seconds
| |||||
Average session time | 59 seconds
| |||||
| State name | % of total | Count | Errors | Minimum Time | Maximum Time | Average Time |
|---|---|---|---|---|---|---|
Home | 4 % | 13259 | 0 | 0 ms | 190001 ms | 381 ms
|
Register | 1 % | 3383 | 0 | 0 ms | 93711 ms | 820 ms
|
RegisterUser | 1 % | 3327 | 106 | 5 ms | 93066 ms | 794 ms
|
Browse | 7 % | 22654 | 0 | 0 ms | 190211 ms | 931 ms
|
BrowseCategories | 4 % | 15865 | 0 | 3 ms | 194187 ms | 946 ms
|
SearchItemsInCategory | 15 % | 50482 | 0 | 3 ms | 194192 ms | 1018 ms
|
BrowseRegions | 2 % | 6533 | 0 | 3 ms | 190212 ms | 875 ms
|
BrowseCategoriesInRegion | 1 % | 6408 | 0 | 3 ms | 193995 ms | 1002 ms
|
SearchItemsInRegion | 5 % | 16658 | 0 | 0 ms | 190070 ms | 967 ms
|
ViewItem | 14 % | 45866 | 0 | 3 ms | 190094 ms | 893 ms
|
ViewUserInfo | 3 % | 10082 | 0 | 3 ms | 190578 ms | 981 ms
|
ViewBidHistory | 1 % | 5551 | 0 | 3 ms | 190207 ms | 1347 ms
|
BuyNowAuth | 1 % | 4446 | 0 | 2 ms | 190005 ms | 954 ms
|
BuyNow | 1 % | 4358 | 566 | 5 ms | 93940 ms | 858 ms
|
StoreBuyBow | 1 % | 3721 | 4 | 5 ms | 190044 ms | 868 ms
|
PutBidAuth | 4 % | 15685 | 0 | 0 ms | 194156 ms | 904 ms
|
PutBid | 5 % | 18176 | 1901 | 4 ms | 191859 ms | 981 ms
|
StoreBid | 3 % | 12014 | 20 | 5 ms | 190063 ms | 947 ms
|
PutCommentAuth | 0 % | 0 | 0 | 0 ms | 0 ms | 0 ms
|
PutComment | 0 % | 1586 | 118 | 4 ms | 190154 ms | 951 ms
|
StoreComment | 0 % | 1444 | 0 | 5 ms | 190033 ms | 1089 ms
|
Sell | 0 % | 1769 | 0 | 0 ms | 93479 ms | 842 ms
|
SelectCategoryToSellItem | 0 % | 1747 | 0 | 4 ms | 94220 ms | 1053 ms
|
SellItemForm | 0 % | 1713 | 0 | 2 ms | 93641 ms | 906 ms
|
RegisterItem | 0 % | 1689 | 0 | 5 ms | 190695 ms | 935 ms
|
AboutMe (auth form) | 1 % | 5054 | 0 | 0 ms | 94011 ms | 893 ms
|
AboutMe | 2 % | 8652 | 0 | 5 ms | 190257 ms | 1094 ms
|
Back probability | 10 % | 33747 | 0 | 0 ms | 0 ms | 0 ms
|
End of Session | 1 % | 4654 | 0 | 0 ms | 0 ms | 0 ms
|
Total | 100 % | 320523 | 2715 | - | - | 812 ms
|
Average throughput | 718 req/s
| |||||
Completed sessions | 4673
| |||||
Total time | 1209328 seconds
| |||||
Average session time | 258 seconds
| |||||
| State name | % of total | Count | Errors | Minimum Time | Maximum Time | Average Time |
|---|---|---|---|---|---|---|
Home | 3 % | 460 | 0 | 0 ms | 21000 ms | 237 ms
|
Register | 1 % | 130 | 0 | 0 ms | 45005 ms | 1227 ms
|
RegisterUser | 0 % | 112 | 3 | 5 ms | 46165 ms | 1962 ms
|
Browse | 7 % | 891 | 0 | 0 ms | 190010 ms | 1866 ms
|
BrowseCategories | 4 % | 599 | 0 | 3 ms | 190005 ms | 1421 ms
|
SearchItemsInCategory | 15 % | 1823 | 0 | 3 ms | 190040 ms | 2221 ms
|
BrowseRegions | 2 % | 261 | 0 | 3 ms | 93006 ms | 1911 ms
|
BrowseCategoriesInRegion | 2 % | 250 | 0 | 3 ms | 190031 ms | 2562 ms
|
SearchItemsInRegion | 5 % | 672 | 0 | 0 ms | 93022 ms | 1120 ms
|
ViewItem | 13 % | 1682 | 0 | 3 ms | 190047 ms | 2463 ms
|
ViewUserInfo | 3 % | 434 | 0 | 3 ms | 190023 ms | 2799 ms
|
ViewBidHistory | 1 % | 186 | 0 | 4 ms | 190188 ms | 5515 ms
|
BuyNowAuth | 1 % | 136 | 0 | 2 ms | 93004 ms | 1985 ms
|
BuyNow | 1 % | 157 | 22 | 5 ms | 21520 ms | 1101 ms
|
StoreBuyBow | 1 % | 154 | 0 | 5 ms | 46375 ms | 1480 ms
|
PutBidAuth | 5 % | 618 | 0 | 0 ms | 93063 ms | 1773 ms
|
PutBid | 5 % | 699 | 74 | 5 ms | 190017 ms | 1807 ms
|
StoreBid | 3 % | 481 | 0 | 5 ms | 93015 ms | 1367 ms
|
PutCommentAuth | 0 % | 0 | 0 | 0 ms | 0 ms | 0 ms
|
PutComment | 0 % | 72 | 3 | 5 ms | 45038 ms | 1410 ms
|
StoreComment | 0 % | 60 | 0 | 5 ms | 3506 ms | 188 ms
|
Sell | 0 % | 64 | 0 | 0 ms | 21171 ms | 483 ms
|
SelectCategoryToSellItem | 0 % | 70 | 0 | 4 ms | 190018 ms | 3383 ms
|
SellItemForm | 0 % | 64 | 0 | 2 ms | 46306 ms | 1859 ms
|
RegisterItem | 0 % | 68 | 0 | 5 ms | 21333 ms | 810 ms
|
AboutMe (auth form) | 1 % | 225 | 0 | 0 ms | 190001 ms | 1582 ms
|
AboutMe | 2 % | 303 | 0 | 5 ms | 190030 ms | 2646 ms
|
Back probability | 10 % | 1288 | 0 | 0 ms | 0 ms | 0 ms
|
End of Session | 1 % | 171 | 0 | 0 ms | 0 ms | 0 ms
|
Total | 100 % | 12130 | 102 | - | - | 1694 ms
|
Average throughput | 407 req/s
| |||||
Completed sessions | 147
| |||||
Total time | 53743 seconds
| |||||
Average session time | 365 seconds
| |||||
| State name | % of total | Count | Errors | Minimum Time | Maximum Time | Average Time |
|---|---|---|---|---|---|---|
Home | 5 % | 21208 | 0 | 0 ms | 190001 ms | 2886 ms
|
Register | 1 % | 4587 | 0 | 0 ms | 93711 ms | 1236 ms
|
RegisterUser | 1 % | 4440 | 128 | 4 ms | 93066 ms | 1199 ms
|
Browse | 7 % | 30995 | 0 | 0 ms | 190211 ms | 1467 ms
|
BrowseCategories | 5 % | 21416 | 0 | 3 ms | 194187 ms | 1270 ms
|
SearchItemsInCategory | 15 % | 63855 | 0 | 3 ms | 194192 ms | 1194 ms
|
BrowseRegions | 2 % | 8813 | 0 | 3 ms | 190212 ms | 1154 ms
|
BrowseCategoriesInRegion | 2 % | 8534 | 0 | 3 ms | 193995 ms | 1309 ms
|
SearchItemsInRegion | 5 % | 21187 | 0 | 0 ms | 190070 ms | 1090 ms
|
ViewItem | 13 % | 57225 | 0 | 3 ms | 190094 ms | 1071 ms
|
ViewUserInfo | 3 % | 12320 | 0 | 3 ms | 190578 ms | 1165 ms
|
ViewBidHistory | 1 % | 6653 | 0 | 3 ms | 190207 ms | 1577 ms
|
BuyNowAuth | 1 % | 5402 | 0 | 2 ms | 190005 ms | 1089 ms
|
BuyNow | 1 % | 5252 | 699 | 4 ms | 93940 ms | 859 ms
|
StoreBuyBow | 1 % | 4411 | 4 | 4 ms | 190044 ms | 977 ms
|
PutBidAuth | 4 % | 19495 | 0 | 0 ms | 194156 ms | 1050 ms
|
PutBid | 5 % | 22048 | 2358 | 3 ms | 191859 ms | 1041 ms
|
StoreBid | 3 % | 14290 | 20 | 4 ms | 190063 ms | 1060 ms
|
PutCommentAuth | 0 % | 0 | 0 | 0 ms | 0 ms | 0 ms
|
PutComment | 0 % | 1939 | 140 | 4 ms | 190154 ms | 1050 ms
|
StoreComment | 0 % | 1735 | 0 | 5 ms | 190033 ms | 1165 ms
|
Sell | 0 % | 2371 | 0 | 0 ms | 93479 ms | 1301 ms
|
SelectCategoryToSellItem | 0 % | 2306 | 0 | 4 ms | 190018 ms | 1358 ms
|
SellItemForm | 0 % | 2236 | 0 | 2 ms | 93641 ms | 1145 ms
|
RegisterItem | 0 % | 2176 | 0 | 4 ms | 190695 ms | 1114 ms
|
AboutMe (auth form) | 1 % | 6892 | 0 | 0 ms | 190001 ms | 1452 ms
|
AboutMe | 2 % | 11245 | 0 | 4 ms | 190257 ms | 1318 ms
|
Back probability | 10 % | 41081 | 0 | 0 ms | 0 ms | 0 ms
|
End of Session | 1 % | 5596 | 0 | 0 ms | 0 ms | 0 ms
|
Total | 100 % | 409708 | 3349 | - | - | 1126 ms
|
Average throughput | 688 req/s
| |||||
Completed sessions | 5596
| |||||
Total time | 1338065 seconds
| |||||
Average session time | 239 seconds
| |||||
An error occured while waiting for remote processes termination (Skipping waits)
Command is: /usr/bin/scp farm6.csail.mit.edu:/tmp/client1 /home/drkp/sandbox/txcache/src/RUBiS-1.4.3/bench/2009-3-20@1:24:26//client1.bin
Command is: /usr/bin/ssh -x localhost /bin/bash -c 'LANG=en_GB.UTF-8 /usr/bin/sar -n DEV -n SOCK -rubcw 1 605 -f /home/drkp/sandbox/txcache/src/RUBiS-1.4.3/bench/2009-3-20@1:24:26//client1.bin > /home/drkp/sandbox/txcache/src/RUBiS-1.4.3/bench/2009-3-20@1:24:26//client1'
Command is: /usr/bin/scp farm14:/tmp/db_server0 /home/drkp/sandbox/txcache/src/RUBiS-1.4.3/bench/2009-3-20@1:24:26//db_server0.bin
Command is: /usr/bin/ssh -x localhost /bin/bash -c 'LANG=en_GB.UTF-8 /usr/bin/sar -n DEV -n SOCK -rubcw 1 605 -f /home/drkp/sandbox/txcache/src/RUBiS-1.4.3/bench/2009-3-20@1:24:26//db_server0.bin > /home/drkp/sandbox/txcache/src/RUBiS-1.4.3/bench/2009-3-20@1:24:26//db_server0'
Command is: /usr/bin/scp farm12.csail.mit.edu:/tmp/web_server0 /home/drkp/sandbox/txcache/src/RUBiS-1.4.3/bench/2009-3-20@1:24:26//web_server0.bin
Command is: /usr/bin/ssh -x localhost /bin/bash -c 'LANG=en_GB.UTF-8 /usr/bin/sar -n DEV -n SOCK -rubcw 1 605 -f /home/drkp/sandbox/txcache/src/RUBiS-1.4.3/bench/2009-3-20@1:24:26//web_server0.bin > /home/drkp/sandbox/txcache/src/RUBiS-1.4.3/bench/2009-3-20@1:24:26//web_server0'
Command is: /usr/bin/scp farm13.csail.mit.edu:/tmp/web_server1 /home/drkp/sandbox/txcache/src/RUBiS-1.4.3/bench/2009-3-20@1:24:26//web_server1.bin
Command is: /usr/bin/ssh -x localhost /bin/bash -c 'LANG=en_GB.UTF-8 /usr/bin/sar -n DEV -n SOCK -rubcw 1 605 -f /home/drkp/sandbox/txcache/src/RUBiS-1.4.3/bench/2009-3-20@1:24:26//web_server1.bin > /home/drkp/sandbox/txcache/src/RUBiS-1.4.3/bench/2009-3-20@1:24:26//web_server1'
Command is: /usr/bin/scp localhost:/tmp/client0 /home/drkp/sandbox/txcache/src/RUBiS-1.4.3/bench/2009-3-20@1:24:26//client0.bin
Command is: /usr/bin/ssh -x localhost /bin/bash -c 'LANG=en_GB.UTF-8 /usr/bin/sar -n DEV -n SOCK -rubcw 1 605 -f /home/drkp/sandbox/txcache/src/RUBiS-1.4.3/bench/2009-3-20@1:24:26//client0.bin > /home/drkp/sandbox/txcache/src/RUBiS-1.4.3/bench/2009-3-20@1:24:26//client0'
Command is: /usr/bin/scp farm6.csail.mit.edu:/tmp/trace_client1.html /home/drkp/sandbox/txcache/src/RUBiS-1.4.3/bench/2009-3-20@1:24:26//
Command is: /usr/bin/scp farm6.csail.mit.edu:/tmp/stat_client1.html /home/drkp/sandbox/txcache/src/RUBiS-1.4.3/bench/2009-3-20@1:24:26//
|
|
|
|
|
|
 | 
|
 | 
|
 | 
|
 | 
|
 | 
|
 | 
|
 | 
|
 | 
|
 | 
|